Amazon Wholesale: The Complete Guide for Beginners [2023]
Selling on Amazon
Most Recent
5.1.23
0
Min
Do you want to start a scalable Amazon business without the hassle of creating your own brand? Selling wholesale can help you achieve that.
Amazon wholesale is a business model where you purchase products in bulk directly from manufacturers or distributors and resell them on Amazon's platform for a profit.
With the wholesale business model, you can access a wide range of products at competitive prices, streamline your supply chain, and reduce costs associated with storing inventory. This makes it an attractive option for sellers who want to start a scalable Amazon business without investing the time and resources required to create a brand from scratch.
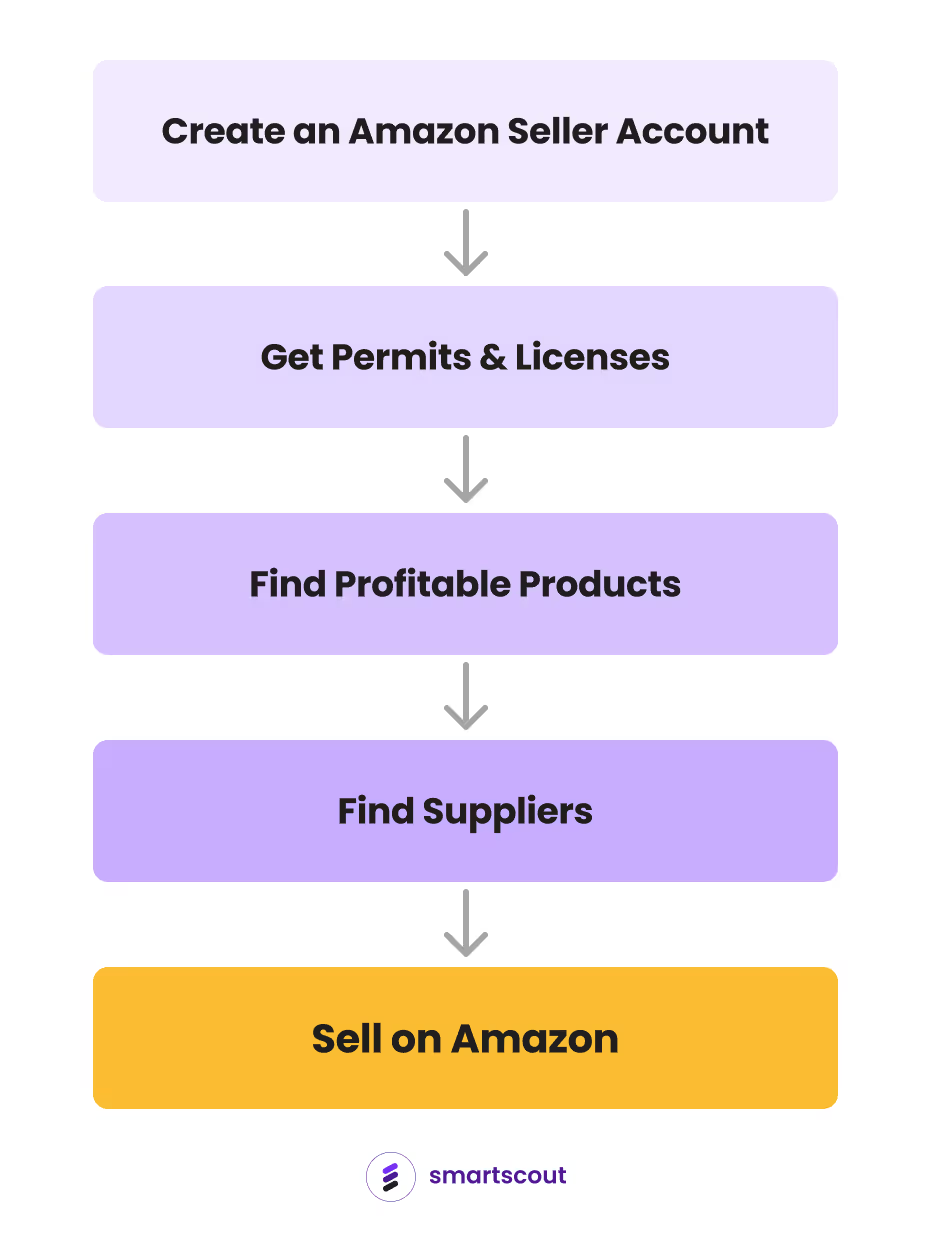
Follow this guide to learn the basics of starting an Amazon wholesale business.
The Wholesale Supply Chain
As a wholesaler on Amazon, you act as the intermediary between the manufacturer (or distributor) and the end user. You’re buying goods at a low price and then selling them at a higher price. This business model can be a profitable venture for entrepreneurs looking to expand their online presence and reach a wider audience.
Is Amazon Wholesale Still Worth It in 2023?
Amazon wholesale is still a good business to start in 2023 because, despite an increase in the number of Amazon sellers, thepotential customer base on Amazon also continues to grow.
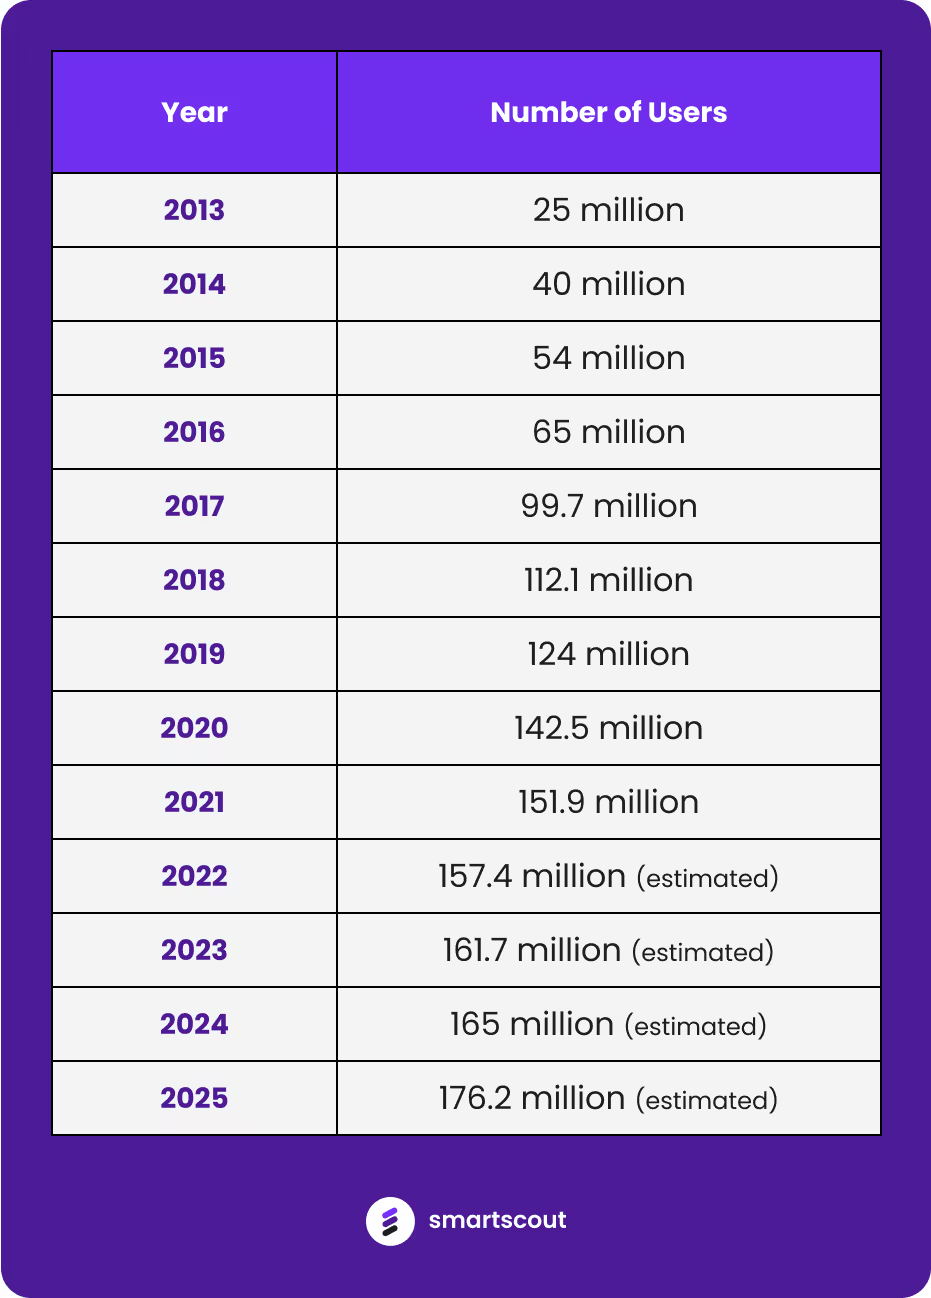
Here’s the growth of Prime users in the United States:
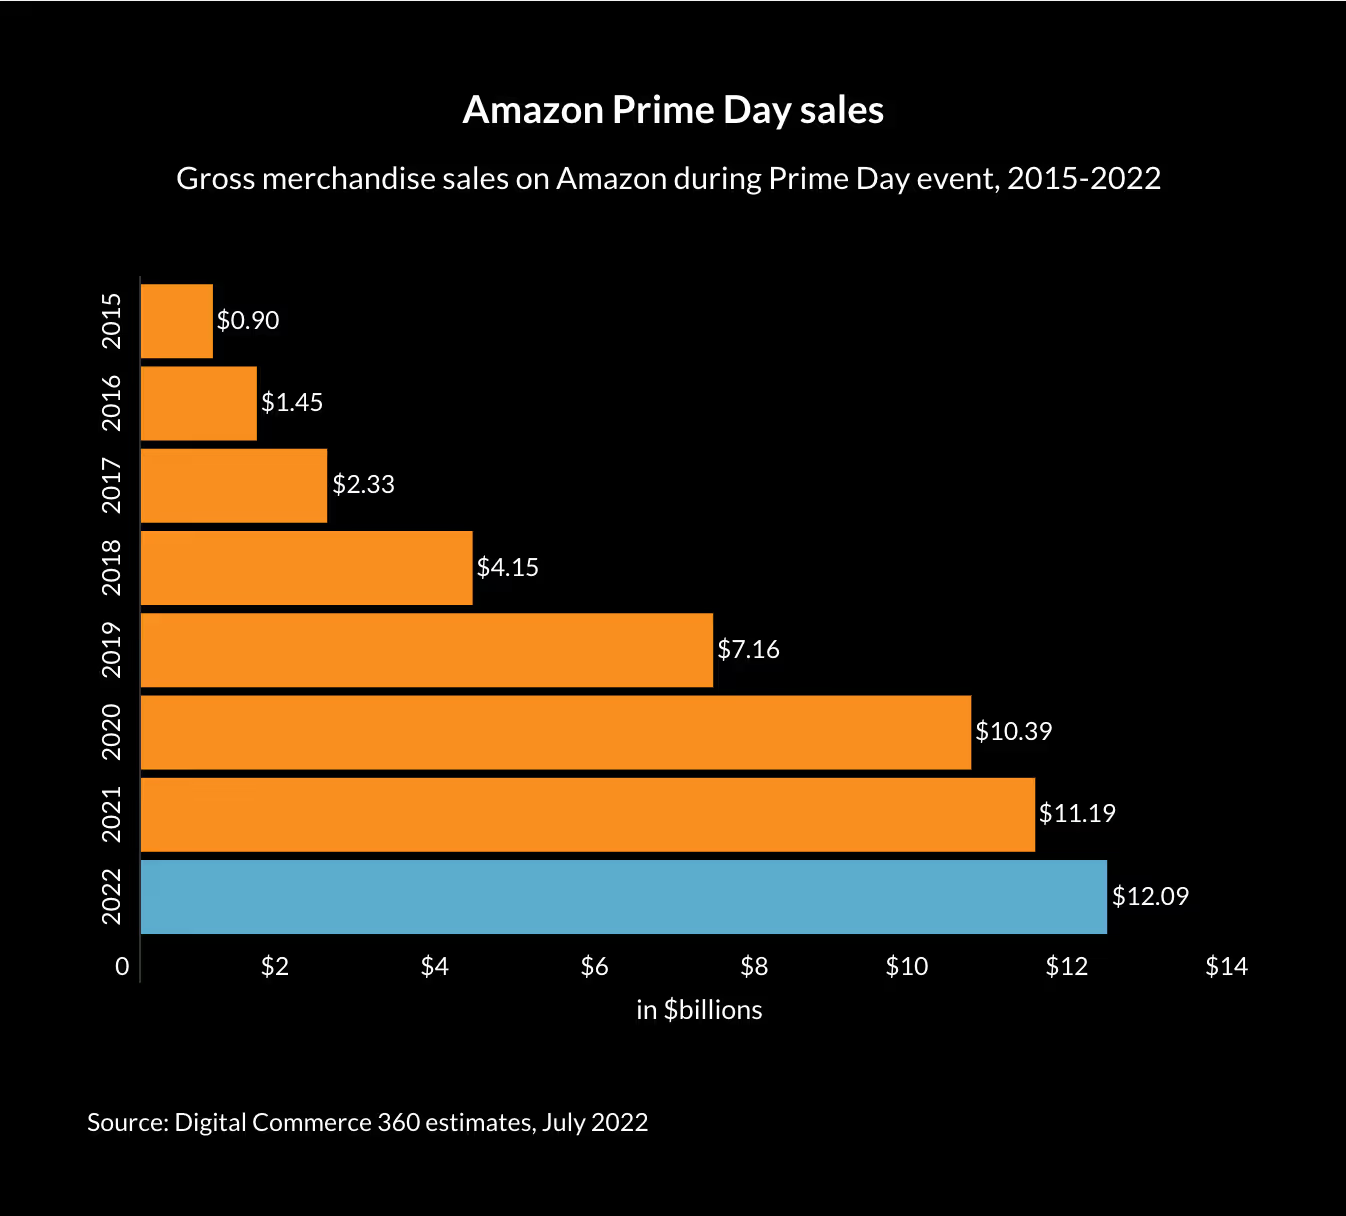
The growth of the number of Amazon Prime users comes with the growth of Prime Day sales.
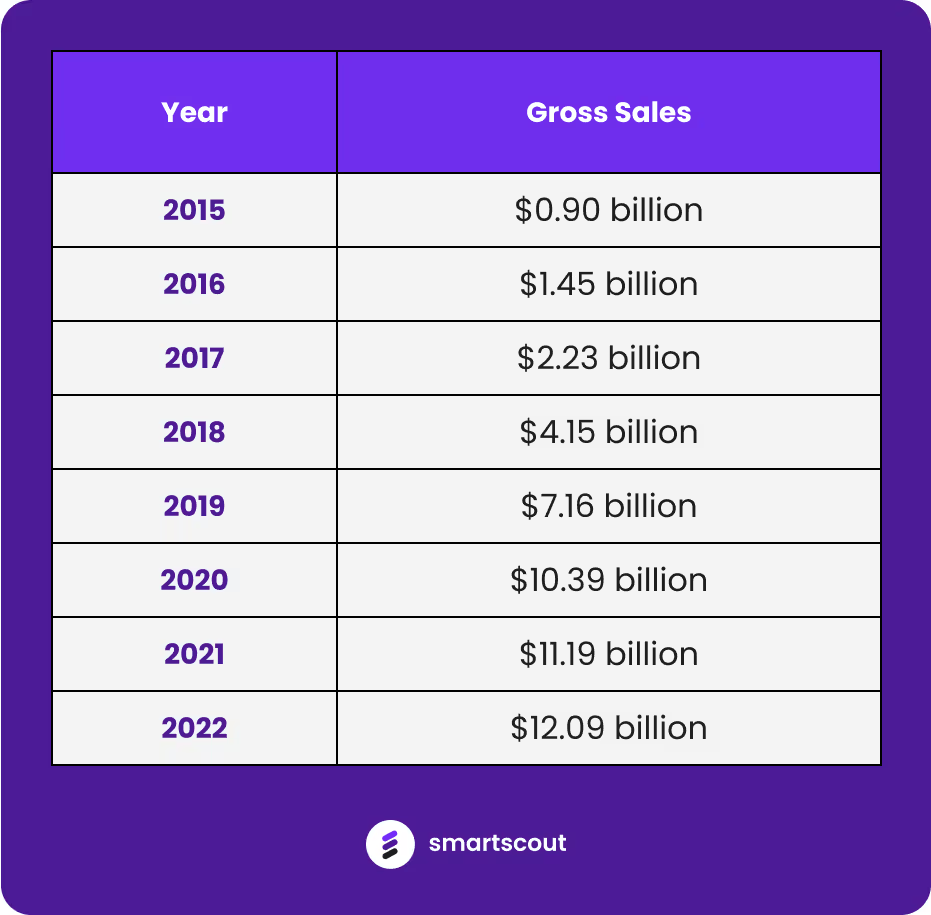
Here’s the table of the Prime Day sales growth since 2015:
All the data above shows that Amazon’s revenue continues to grow, so there is still plenty of room for new sellers to get started.
Wholesaling Versus Other Amazon Business Models
Retail Arbitrage: Retail arbitrage and wholesaling sellers both buy products at a discounted price and resell them at a higher price. But unlike wholesalers who buy products from manufacturers or distributors, retail arbitrage buys products from retail stores.
Online Arbitrage: From the word “online” itself online arbitrage is just retail arbitrage done online. Instead of buying from physical stores, online arbitrage sellers buy products from online stores.
Private Label: Wholesale sellers buy products from existing brands. Private label sellers create their own brand. This involves working with a manufacturer to develop and produce the products, giving you more control over quality and pricing. While this can lead to higher profit margins, it also requires a significant investment in time, resources, and marketing.
Advantages of Amazon Wholesale Over Arbitrage
Bulk Discounts: Buying in bulk results in a higher discount, which then results in higher profit margins.
Time Efficiency: Unlike arbitrage where you need to search for deals constantly, wholesaling can be more time-efficient as it involves purchasing products in bulk from a single supplier. This means you can spend less time searching for deals and more time focusing on other aspects of your business, such as hunting for more products to sell.
Consistent Supplier Relationships: Wholesalers on Amazon work directly with manufacturers or established distributors, allowing for the development of long-term and reliable supplier relationships. This can lead to more consistent product quality and availability.
Greater Control Over Inventory: Wholesalers have greater control over their inventory levels, as they are buying products in bulk. This means they are less reliant on external factors, such as price fluctuations and supply shortages.
Lower Competition for Products: Unlike arbitrage, which involves competing with other sellers for limited inventory, wholesale sellers can acquire products that are less readily available to the general public. This can lead to less competition and a greater chance of securing sales.
Scalability: Wholesale sellers buy in large quantities, allowing them to take advantage of economies of scale and negotiate better pricing and terms with their suppliers. This can lead to increased profit margins and the ability to offer competitive pricing to customers. Also, having a reliable supply of products can help sellers avoid stockouts and fulfill orders quickly, which can lead to higher customer satisfaction and repeat business.
Advantages of Amazon Wholesale Over Private Label
Lower Startup Costs: With private label, you need to invest in product development, branding, and manufacturing, whereas, in wholesale, you purchase existing products in bulk at a discounted price. This can make it more affordable to get started in wholesaling, especially for new entrepreneurs.
Faster Time-to-Market: In Amazon wholesale, you're selling established products from existing brands. This means you can start selling more quickly than with a private label business, which involves creating, developing, and launching your own products. This faster time-to-market enables you to generate revenue more quickly and start building your business sooner.
Predictable Demand: Since you're selling products that are proven to sell from established brands in Amazon wholesale, you can benefit from the existing demand for those products. This predictability can make inventory management and sales forecasting more manageable than with private label.
Lower Risk of Intellectual Property Issues: In a private label, there's a risk of inadvertently infringing on another company's intellectual property rights, such as patents, trademarks, or copyrights, which can lead to legal disputes and costly settlements. With Amazon wholesale, you're selling products from established brands that have already addressed these issues, reducing the risk of intellectual property infringements.
The Simplified Roadmap to Becoming an Amazon Wholesale Seller
Choosing the Right Account Type
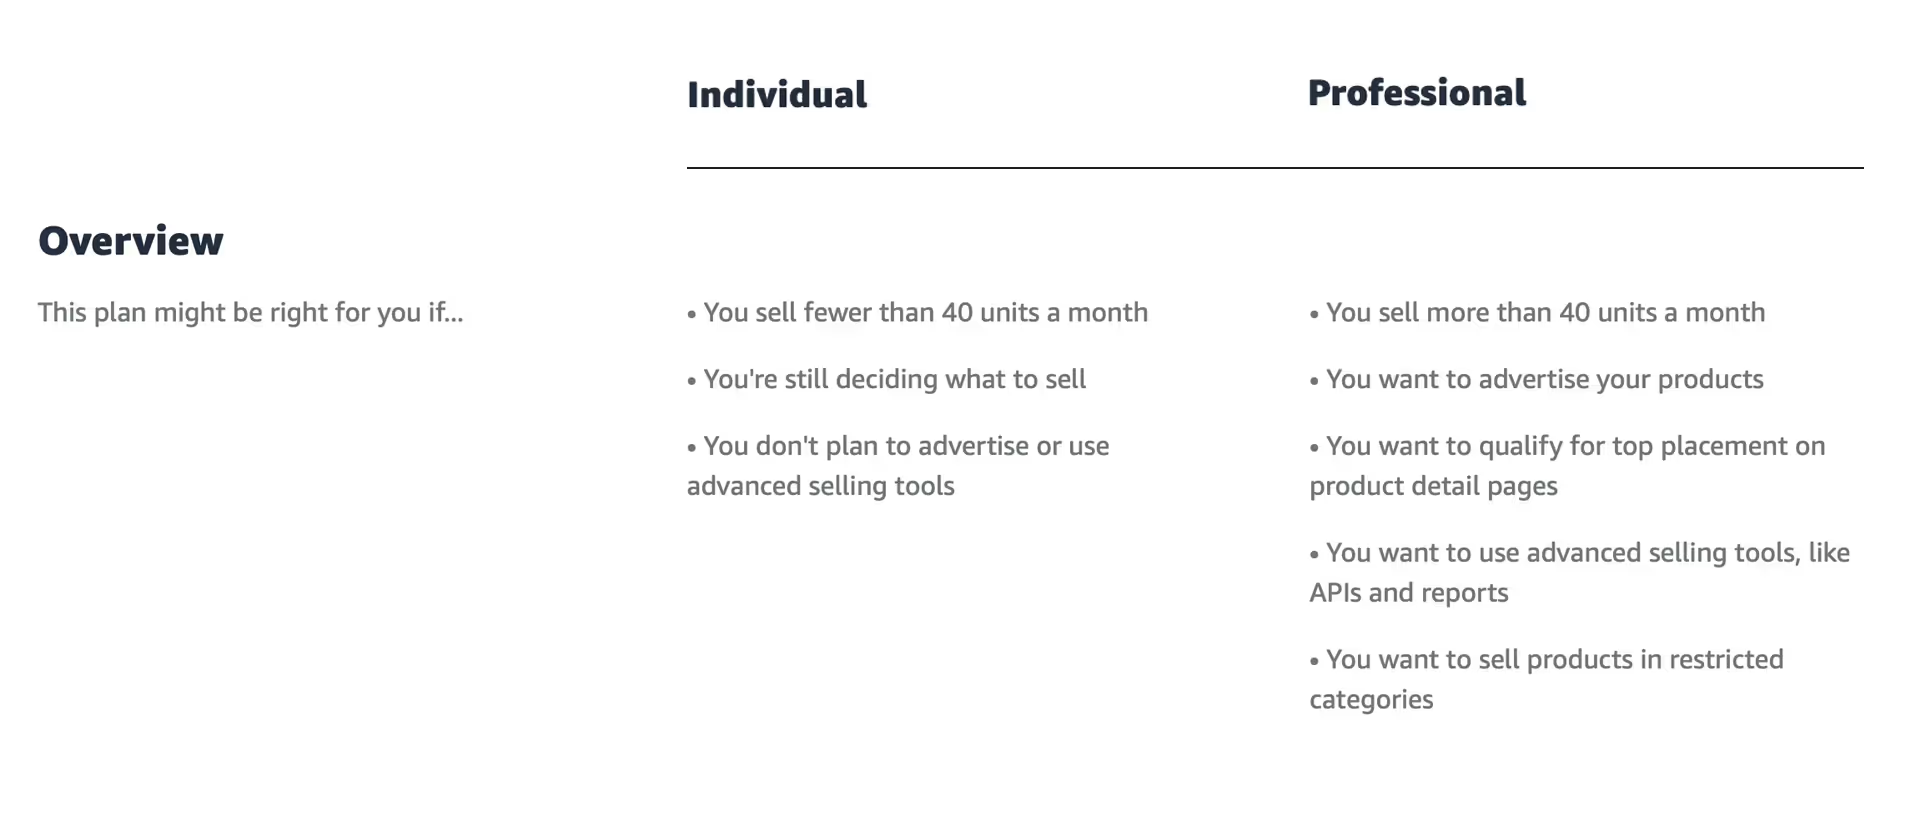
Amazon offers two types of seller accounts: Individual and Professional.
The Individual plan, which costs $0.99 for each item you sell, is best for sellers who plan to sell fewer than 40 items per month. The Professional plan, which costs $39.99 per month is best for those who plan to sell more than 40 items per month or want access to advanced selling tools.
Since you'll likely be dealing with a high volume of sales as a wholesaler, the Professional plan is the best plan for you.
Here Are the Steps To Set Up Your Amazon Seller Account.
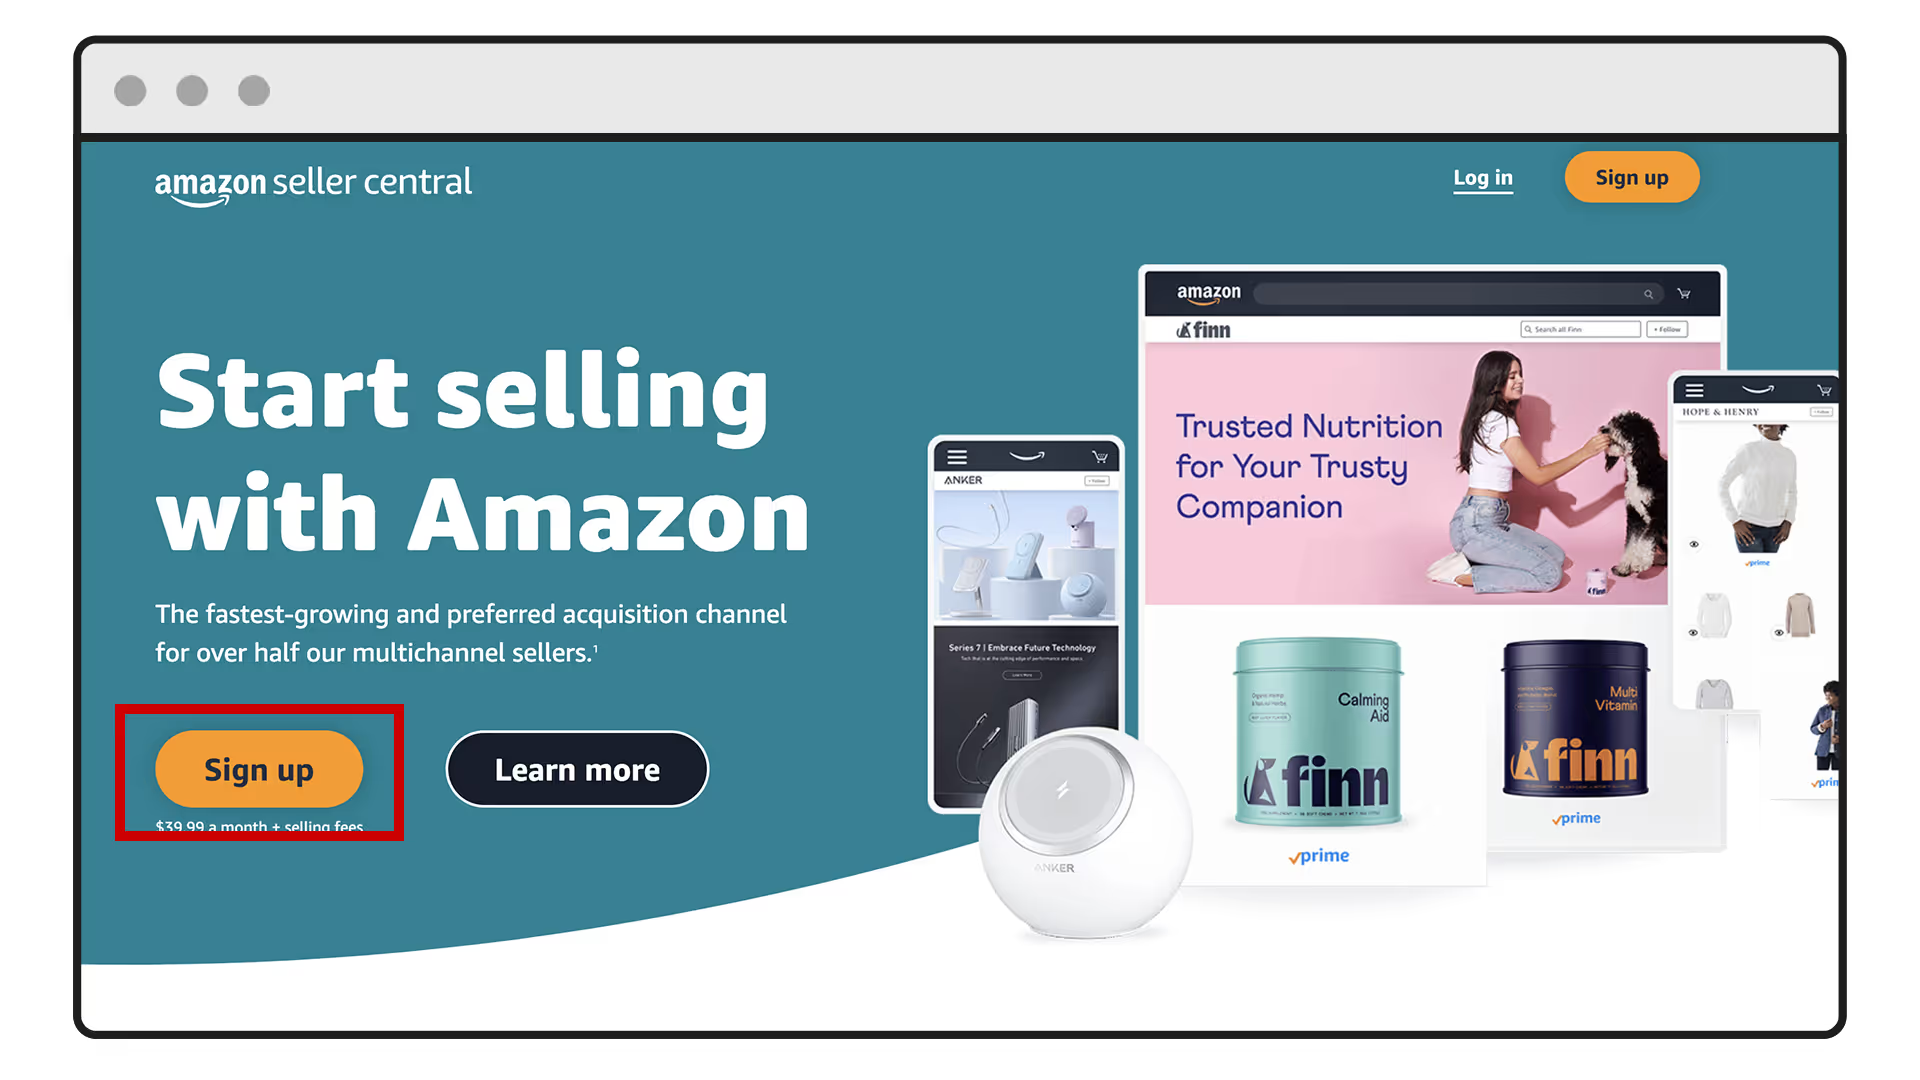
Visit the Amazon Seller Central website and click on "Sign Up."
Sign in with your existing Amazon account or create a new one.
Fill in the details.
Choose your plan (Professional).
Enter your tax identity information.
Set up your payment method, and voilà! You now have an Amazon seller account.
Permits and Licenses
Before diving headfirst into the wholesale pool, make sure you have the right gear — meaning permits and licenses.
Here's what you'll need:
1. Reseller's permit. A reseller's permit (also known as a sales tax permit) allows you to purchase goods for resale without paying sales tax. Suppliers often require a reseller's permit before they'll do business with you, so don't skip this step. The process varies by state, so be sure to check your state's requirements.
2. Business license. Depending on your state and local regulations, you may need a business license to operate your Amazon wholesale business. Think of it as your business's ticket to the big leagues. Check with your local government office to determine what's required in your area.
3. Tax ID number. You'll need a tax ID number (also known as an Employer Identification Number or EIN) to file taxes and open a business bank account. It's like your business's Social Security number — unique and essential. You can obtain one for free from the IRS by applying online.
Understanding Amazon Fees and Expenses
Amazon charges various fees for selling on their platform. Here's a breakdown of the main fees:
Subscription fees. For Professional sellers, Amazon charges a monthly subscription fee of $39.99. Think of it as a small price to pay for the chance to make some serious dough.
Referral fees. Amazon charges referral fees as a percentage of the item's sale price, including shipping and gift wrap charges. These fees vary by category, typically ranging from 8% to 15%.
Fulfillment fees. Amazon FBA fees refer to the charges that Amazon imposes on sellers who use theFulfillment by Amazon (FBA) service. With FBA, Amazon stores sellers' products in their fulfillment centers, picks, packs, and ships orders on their behalf, and handles customer service.
The FBA fees vary based on the size and weight of the product, as well as the time it takes to store and fulfill orders. These fees include storage fees, which are calculated based on the amount of space the product occupies in the fulfillment center, and fulfillment fees, which are charged per unit and cover picking, packing, and shipping.
You can use SmartScout’s FBA Calculator to determine a product’s net profit after all the fees.
How To Find Amazon Wholesale Products
There are several methods for finding wholesale products to sell. And there’s no one right way to do it. When you’re in the game for a long time, you’ll discover nuances in product hunting and develop your own method.
Here are some general tips when finding products for your wholesale business:
Avoid Amazon like a plague
Avoid selling private label products
Avoid products with the brand as one of the sellers
Sell products that are proven to sell. (BSR below 40,000)
Look for established small-to-medium brands
Check your potential share of units sold per month
Check price history
Methods To Find Products for Wholesaling
Method #1 Amazon to Wholesale: The Category Filtering Method
One way to hunt for products on Amazon is through category filtering.
Category filtering is where you dive deep into categories and subcategories to find profitable products.
In a nutshell, here’s what the process looks like:
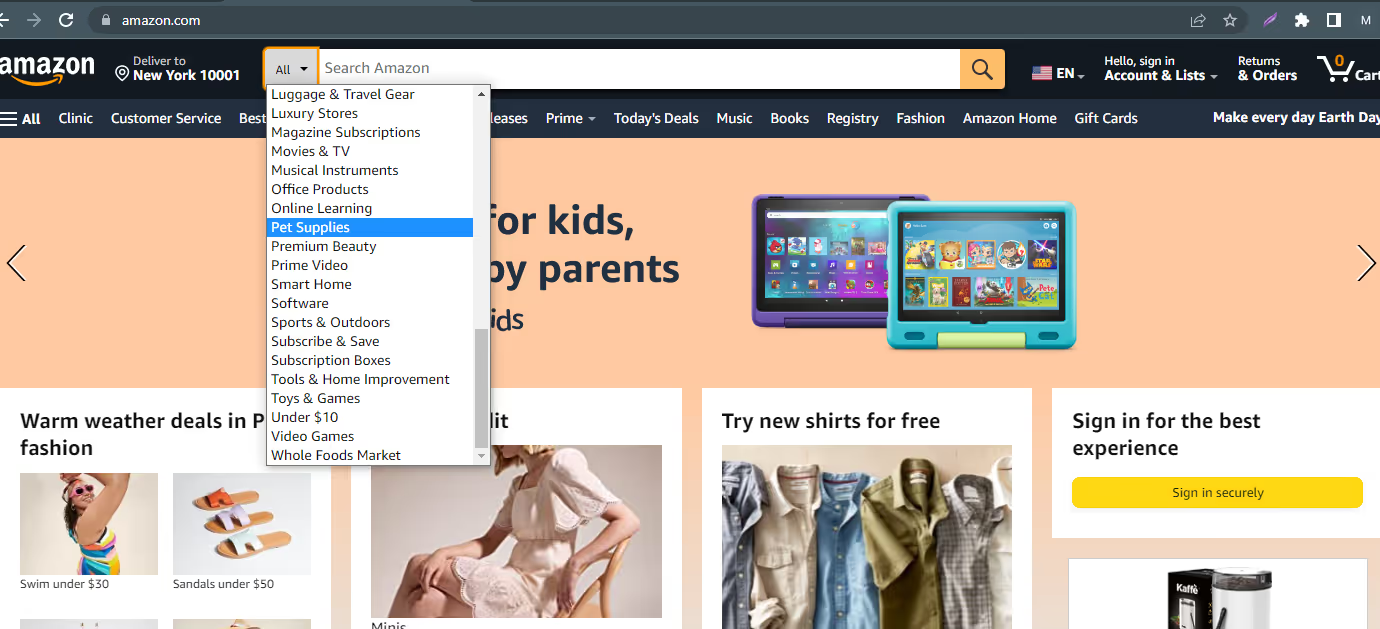
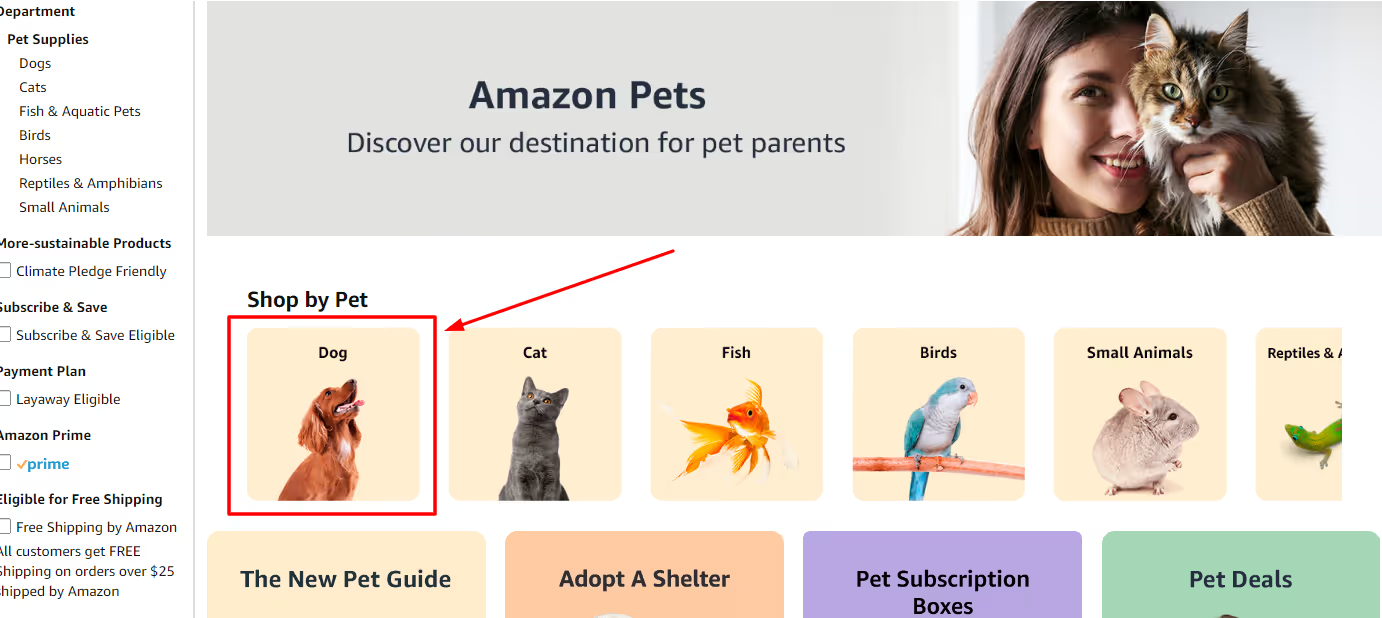
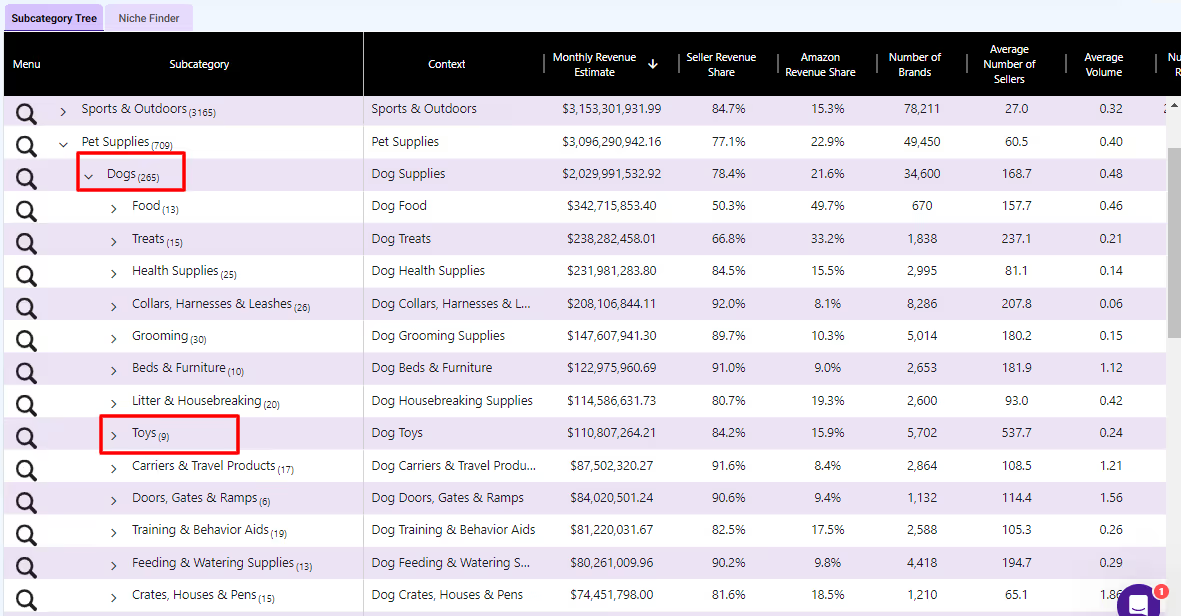
Step 1. Go to Amazon and choose a category you are interested in selling to.
Step 2. Then choose a category.
Suppose you want to find products under the Pet Supplies category.
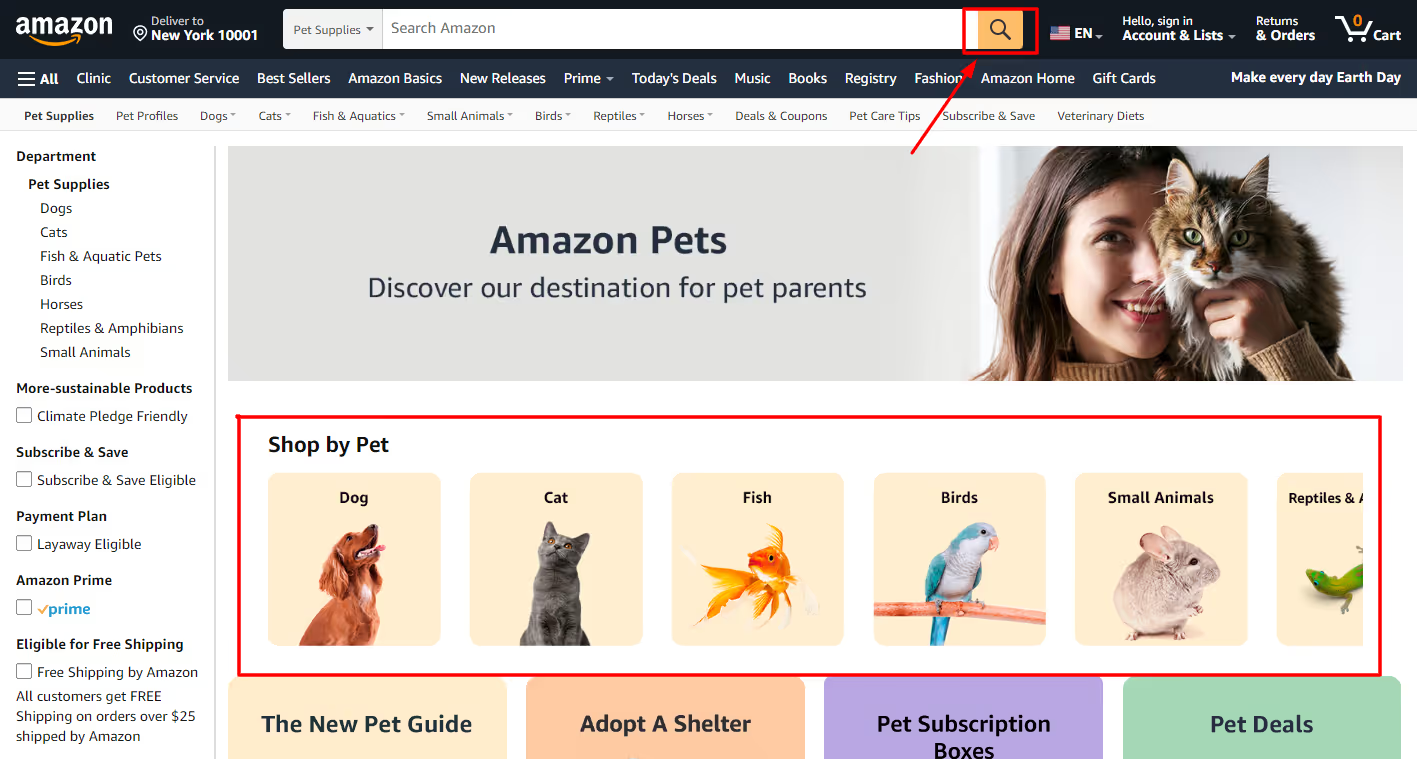
Step 3. Click “Search,” and you will see subcategories under the Pet Supplies category.
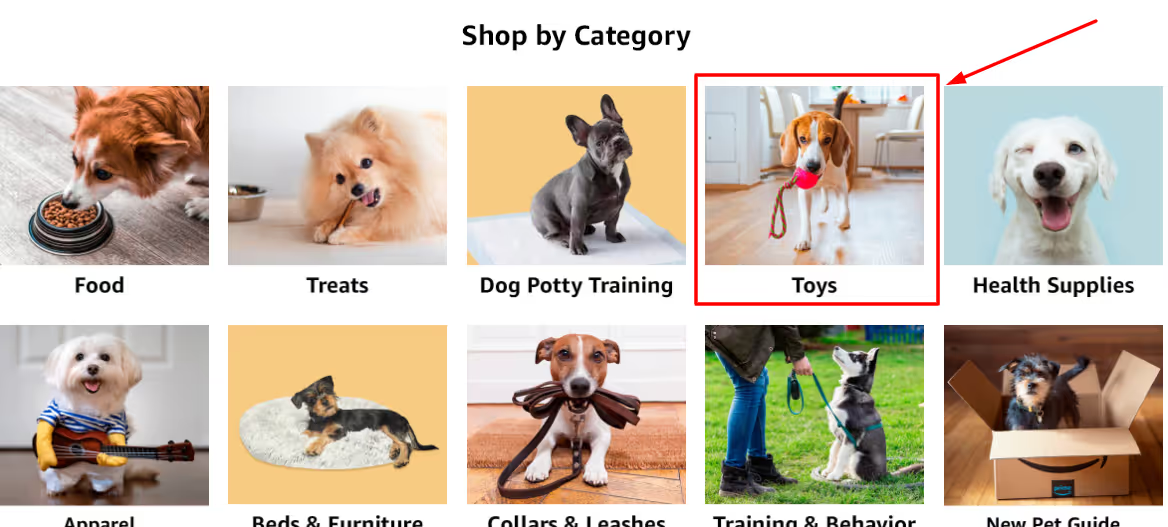
Step 4. Choose a subcategory. (Ex. “Dogs”)
And then another subcategory within your chosen category. (Ex. “Toys”)
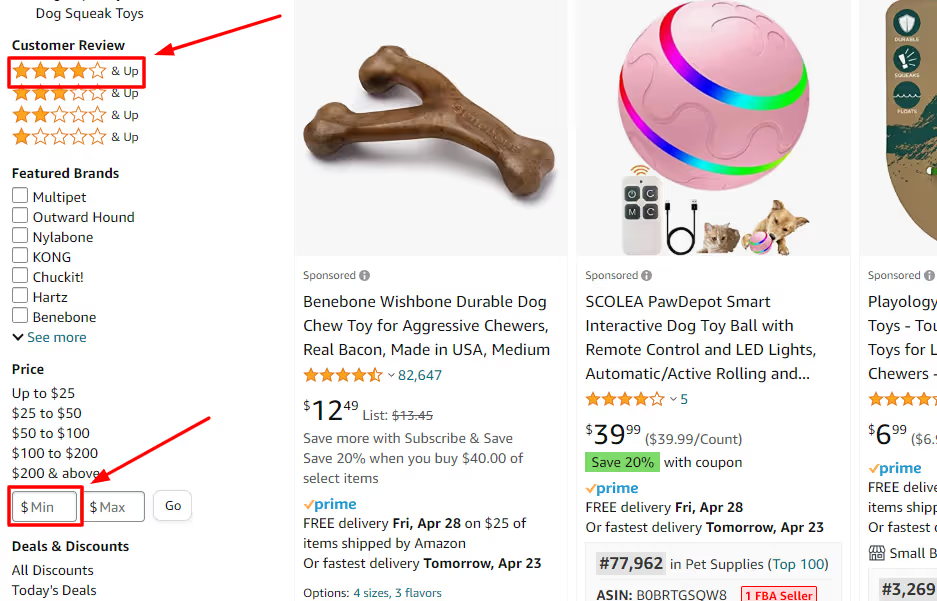
Step 5. Set your filters.
Customer reviews (4 Stars +)
Price ($15 - $20 & higher)
Step 4. Start exploring for product opportunities.
Here’s a demonstration of The Category Filtering Method from Larry Lubarsky:
Method #2 Use a Product Research Tool
If you have enough budget, you can also use Amazon seller tools such as SmartScout to make product hunting easier and faster.
For example, you can perform the Category Filtering Method faster using the Subcategories tool. SmartScout’s Subcategories tool shares the same browsability feature with Amazon, helping you to easily zoom in on your chosen subcategory and filter out products that you don’t want to see.
Let’s perform the same exact process from Method #1 using the Subcategories tool.
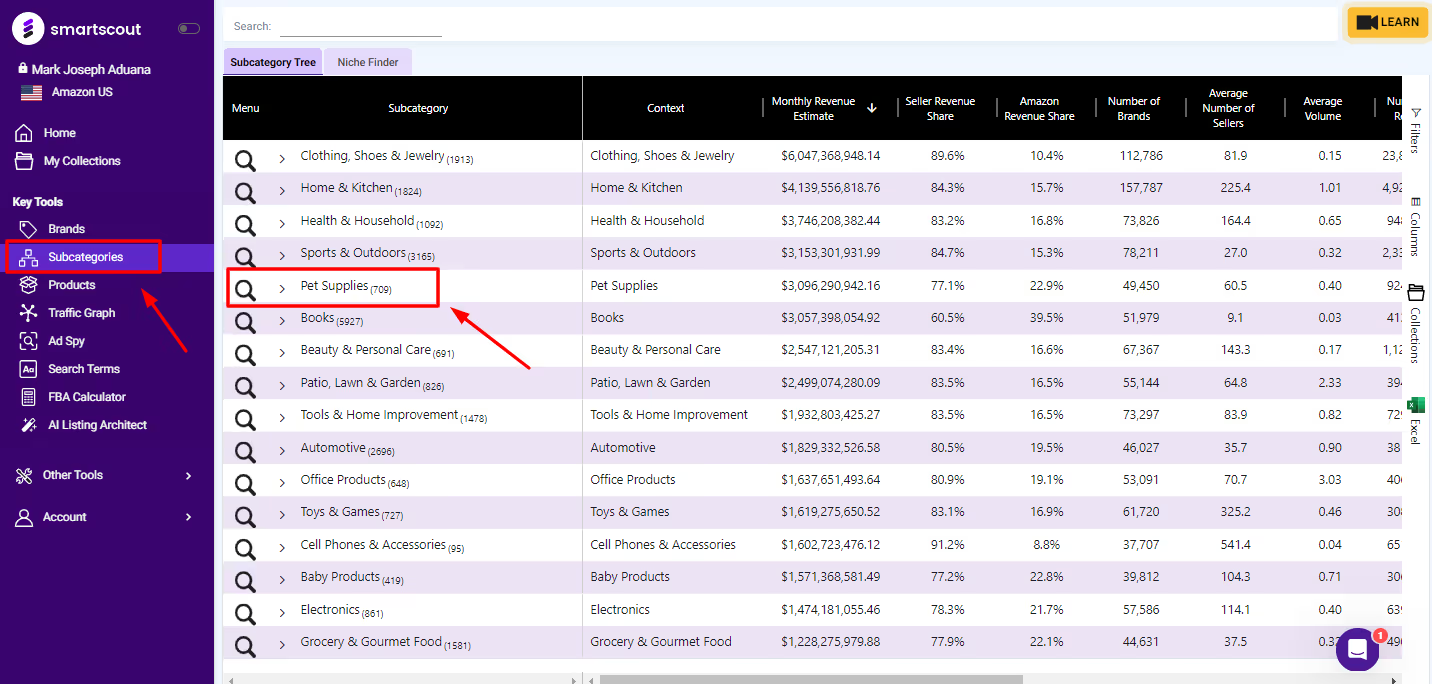
Step 1. Login to your SmartScout account.
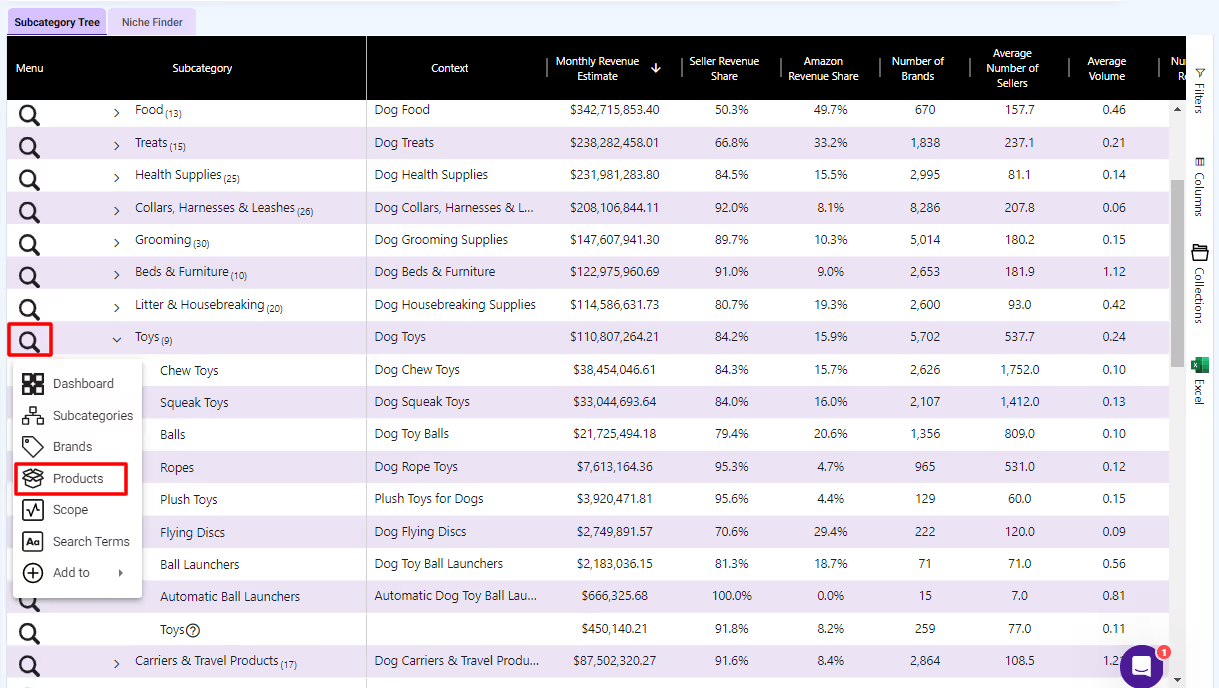
Step 2. Click “Subcategories” and then choose a subcategory (ex. Pet Supplies).
Step 3. Then click a subcategory (ex. Dogs) and another subcategory (ex. “Toys”).
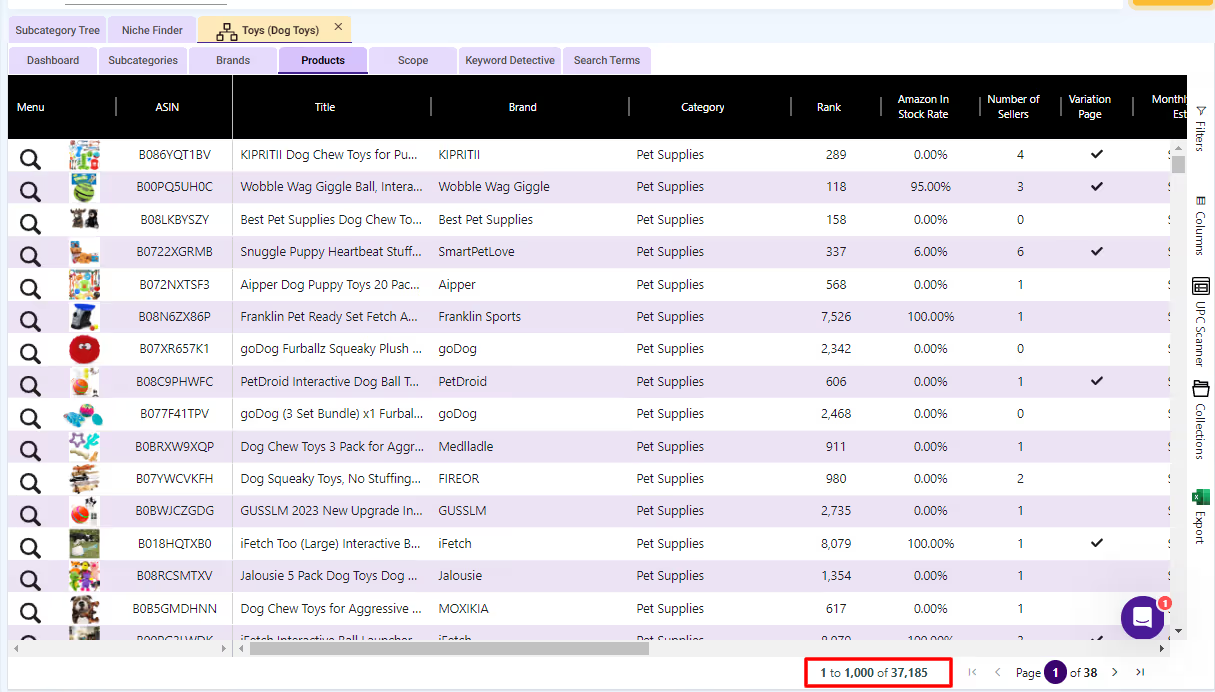
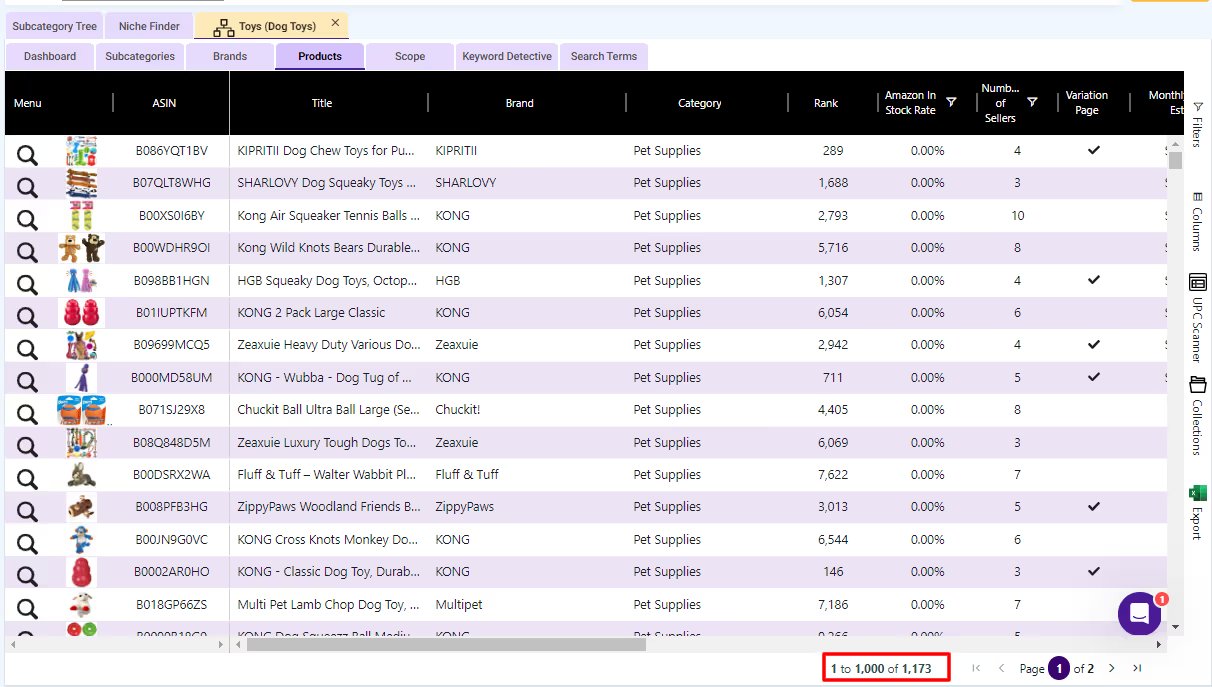
Step 4. After that, click the “magnifying icon” and then “Products.”
And you will see all the products inside the Toys subcategory.
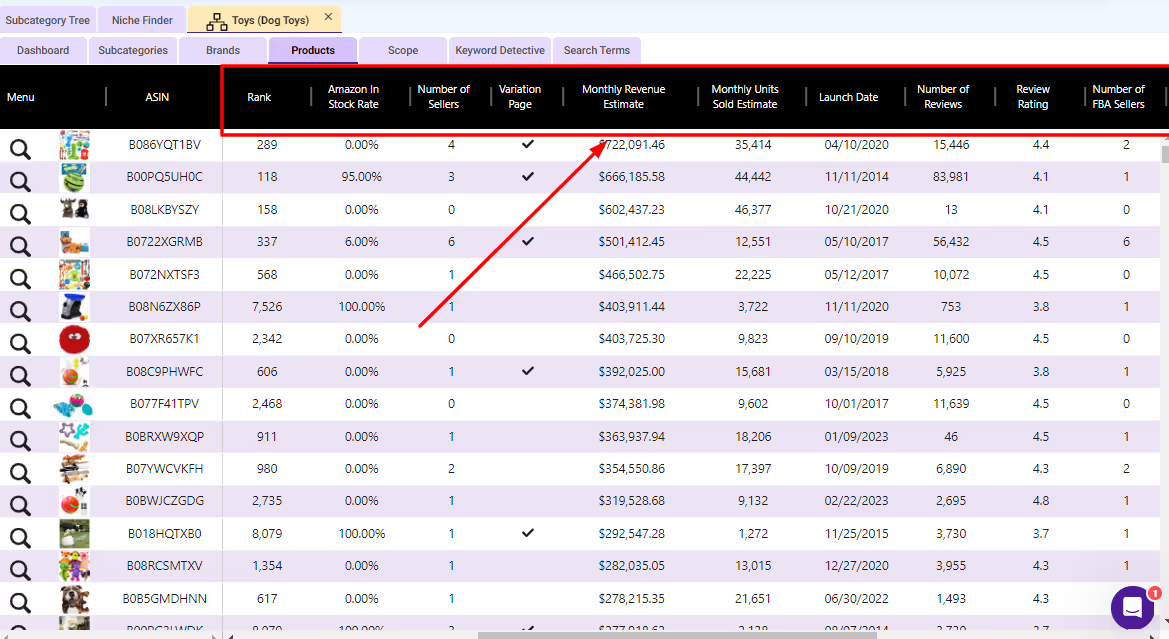
Step 5. Set your desired criteria to only show products that you want to see.
Suppose we set the criteria below:
Criteria #1: Buy Box Price = $15 minimum
Criteria #2: Review rating = 4 minimum
Criteria #3: Amazon In Stock Rate = 0 maximum (to eliminate products with Amazon as one of the sellers)
Criteria #4: Number of sellers = 3 minimum (to eliminate Private Label products)
After setting the filters, we narrowed our list from 37,185 to 1,173.
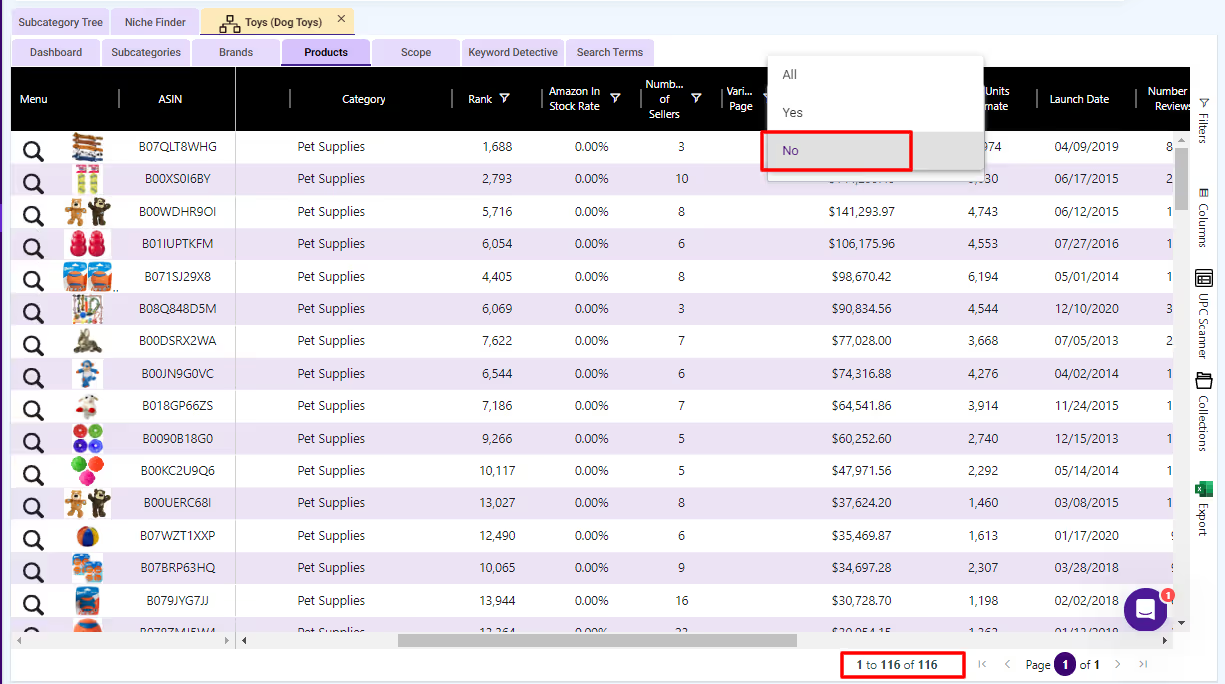
You can further narrow your list down by setting more filters. Let’s say we set the minimum BSR to 40,000 and also set the Variation pages to “No” to remove products with variations.
As you can see, we narrowed down our options to 116 potential products to sell. You can now go through each product and run them onto your checklist for profitable products hunting.
These include:
Confirming that the brand owner is not one of the sellers
Checking the price history
Calculating net profits using an FBA Calculator
Bonus Method:
Here’s another way to find wholesale products to sell on Amazon using SmartScout:
How I've been using SmartScout (@SmartScout_com) to find Wholesale Products and Brands!
Another way to find profitable products for a wholesale business model is by opening an account with wholesale suppliers and asking for a master list of their wholesale catalog.
In general, here are the steps to find profitable products using this method.
Find Potential Wholesale Suppliers
Open an Account With Wholesale Suppliers
Request a Master List of Their Wholesale Catalog
Evaluate the Products To Determine Which Ones Meet Your Desired Criteria
Here’s Larry Lubarksy again finding 10 -50 potential products from a Brand’s catalog:
TIP: Use SmartScout’s UPC Scanner tool to scan thousands of products and determine which ones give the highest ROI.
Finding and Approaching Suppliers
Here are some ways to find wholesale suppliers:
1. Attending Trade Shows
Trade shows provide a unique opportunity to meet potential suppliers in person, learn about their products, and network with industry professionals. Plan your visit by researching the exhibitors and preparing a list of suppliers you'd like to meet. If you can't attend in person, many trade shows provide a list of exhibitors on their websites, allowing you to research and contact suppliers directly.
2. Reverse Sourcing with SmartScout
Reverse sourcing involves analyzing competitors' listings on Amazon to identify their suppliers. Tools such as SmartScout simplify this process by providing valuable data on sellers, products, and brands. Use SmartScout to identify trends, find popular products, and uncover suppliers used by successful sellers.
3. Local Distribution Advantages
Sourcing from local distributors offers several benefits, including faster shipping times, lower shipping costs, better quality control, and stronger personal relationships. Additionally, working with local suppliers supports your local economy and small businesses.
4. Wholesale Forums and Communities: Wholesale Central and SaleHoo
Wholesale forums and communities such as Wholesale Central and SaleHoo offer valuable resources for sellers looking for suppliers. These platforms provide a place for sellers to connect with suppliers, share experiences, and seek recommendations.
Wholesale Central is a comprehensive directory of wholesalers and dropshippers, offering a wide range of products from various industries. The platform also features a forum where sellers can exchange information and advice.
SaleHoo is a popular wholesale directory and community, providing access to over 8,000 suppliers and dropshippers worldwide. The platform offers a forum, market research tools, and customer support to help sellers find and work with reliable suppliers.
5. Supplier Directories
Finding suppliers can feel like searching for a needle in a haystack, but supplier directories can make the process much easier.
Here are a few popular options:
Alibaba: A global marketplace connecting sellers with suppliers from various industries. It's an excellent resource for finding manufacturers and wholesalers, primarily in Asia.
Global Sources: A leading B2B marketplace offering a wide range of products from manufacturers and suppliers, mainly in Asia.
ThomasNet: A directory of North American manufacturers, suppliers, and distributors, with a focus on industrial and commercial products.
Managing Inventory and Order Fulfillment
You've found profitable products and reliable suppliers, but your Amazon wholesale journey is far from over. Now comes the task of managing inventory and order fulfillment.
In this chapter, we'll help you navigate the ins and outs of fulfillment methods, inventory management, and dealing with returns and refunds.
Choosing a Fulfillment Method
Fulfillment by Amazon (FBA) vs. Fulfillment by Merchant (FBM)
When it comes to fulfilling orders, you have two main options: Fulfillment by Amazon (FBA) and Fulfillment by Merchant (FBM). Each has its pros and cons, so let's take a closer look:
Fulfillment by Amazon (FBA): With FBA, Amazon takes care of storage, packing, shipping, and customer service for your orders. This means you can sit back, relax, and let Amazon handle the nitty-gritty details. However, FBA comes with its own set of fees, and you'll need to comply with Amazon's strict inventory requirements.
Fulfillment by Merchant (FBM): FBM puts you in the driver's seat, allowing you to manage your own inventory, shipping, and customer service. This can lead to lower fees and more control over your business, but it also means increased responsibility and potential time constraints.
Note: FBA products win the BuyBox more than the FBM products. Amazon prioritizes FBA. Plus, your products become eligible for Amazon Prime when you use FBA, helping you increase your sales and visibility. Prime members tend to prefer products that are eligible for free two-day shipping, so having this badge on your listings can give you an edge over competitors.
Inventory Management Best Practices
Maintaining optimal inventory levels is crucial for ensuring smooth order fulfillment and happy customers. Follow these best practices to keep your inventory management game strong:
Keeping track of stock levels: Monitor your inventory levels closely to avoid stockouts and overstocking. Use inventory management software or create a spreadsheet to track your stock levels, and make sure to update it regularly
Planning for seasonality and fluctuations in demand: Seasonal trends, holidays, and other factors can impact product demand, so plan your inventory accordingly. Anticipate these fluctuations and adjust your inventory levels to meet changing demand and avoid stockouts or excess inventory
Dealing With Returns and Refunds
Returns and refunds are inevitable in the world of eCommerce. Here's how to handle them like a pro:
1. Amazon's Return Policy
As an Amazon seller, you're required to comply with Amazon's return policy, which generally allows customers to return items within 30 days of receipt. Familiarize yourself with this policy and make sure your business practices align with its requirements.
2. Handling Returns Efficiently
To minimize the impact of returns on your business, establish an efficient return process. This includes:
Inspecting Returned Items: Check returned products for damage or defects and determine if they can be resold
Processing Refunds Promptly: Refund customers promptly to maintain a positive reputation and keep them coming back for more
Analyzing Return Data: Keep track of return reasons to identify patterns and address potential issues with your products or suppliers
Final Thoughts
Starting an Amazon FBA wholesale business can be a lucrative opportunity for those who are willing to put in the effort and learn the fundamentals of the business. Despite the increasing competition, the growth of Amazon and e-commerce in general presents a promising market for wholesalers.
Additionally, tools such as SmartScout can help in finding profitable products with ease. By investing time and effort, anyone can thrive in the world of Amazon wholesale. The key is to stay focused, determined, and willing to adapt to changes in the industry. With these traits, success in Amazon wholesaling is possible.
Frequently Asked Questions
How Much Capital Do I Need To Start an Amazon Wholesale Business?
The amount of capital needed to start an Amazon wholesale business depends on factors like product selection, order quantity, and fulfillment method. However, a general rule of thumb is to have at least $2,000 to $5,000 to cover initial inventory, account setup fees, and other startup expenses. This is just an estimate. Your specific needs may differ.
How Much Capital Do I Need To Start an Amazon Wholesale Business?
The time it takes to become profitable in Amazon wholesale can vary depending on factors like product selection, competition, and how well you manage your business. Some sellers may see profits within a few months, while others might take longer. The key is to stay persistent, continually optimize your strategies, and learn from your experiences.
Can I Do Amazon Wholesale Part-Time?
Absolutely! Many successful Amazon wholesalers start part-time while maintaining a day job or juggling other responsibilities. With proper time management and a clear plan of action, you can grow your Amazon wholesale business without sacrificing your work-life balance.
What Are the Most Common Challenges in Amazon Wholesale?
Some common challenges in Amazon wholesale include finding profitable products, establishing relationships with reliable suppliers, managing inventory, and navigating the ever-changing landscape of Amazon fees and policies. However, with dedication, persistence, and a healthy dose of humor, you can overcome these challenges and build a thriving wholesale business.
How Do I Handle Sales Tax in Amazon Wholesale?
As an Amazon wholesaler, you'll need to collect sales tax on your sales and remit it to the appropriate tax authorities. To do this, you'll first need to get a sales tax permit (also known as a reseller's permit) and register with your state's tax agency. Once registered, you can set up a sales tax collection through your Amazon seller account.
What Are Good Wholesale Margins?
While there's no one-size-fits-all answer, a good rule of thumb is to aim for a profit margin of at least 20-30%. This should give you enough room to cover your costs and still turn a profit. However, keep in mind that margins can vary depending on factors like competition, product category, and supplier relationships.
Who Is Taking My Category, and What Do I Do About It?
The Prompt
Preview
I want to know the impact that chineese sellers are having on the Skillets, Saute Pans, and Kitchen Cookware Sets subcategories on Amazon.
using SmartScout, find these details for me, tell me the impact this is having on HexClad, what these brands are doing to win over HexClad and others, whitespaces they've found and dominated, and what HexClad can do to defend itself.
Tell me any other findings you can from the data, and please visualize some of your findings into a chart.
Note the shape. Name the subcategories, name the brand to center it on, ask what the challengers are doing, then ask what to do about it. Adding "tell me any other findings you can from the data" is what surfaced the strongest insight in the whole report, which nobody thought to ask for.
What You Get Back
A seven-section briefing across $56.9M of combined monthly revenue in three subcategories. The framing the analysis lands on: the challengers did not take shelf space, they built a bigger shelf next to it, and they are now climbing toward the price band the incumbent depends on.
The structural read splits the three subcategories cleanly. Sauté Pans is a fortress at 40.7% share and gaining 17 points month over month. Skillets is where the fight is, with a 4.5 point share loss in a single month, the largest decline in the subcategory, while nine of eleven tracked challengers gained. Two very different situations that would blend into nothing if you looked at the brand total.
The Findings That Were Not Asked For
Branded search leakage. 65% of clicks on the brand's own name go somewhere outside the top three results. 76,735 searches a month, 15 brands advertising against it, CPC at $5.96.
Channel leakage the rivals do not have. 1.76 sellers per ASIN against 0.83 to 1.01 for every challenger. The competitors run single controlled seller accounts with no diversion.
Revenue is gift-driven, not replacement-driven. From December to February the incumbent fell 83%, from $34.3M to $5.9M. The largest challenger fell 57% in the same window. One business is a Christmas present, the other is a kitchen restock, and the second is a far more durable base. That comparison is the sharpest thing in the report and it came out of the catch-all question at the end of the prompt.
Astercook is the one to watch, not the biggest player. 379% growth on 70 ASINs is not catalog spam, it is a small number of very well executed listings, which means the capability exists to move upmarket whenever it chooses.
Four China-based cookware brands now out-earn HexClad on Amazon by more than four to one. They didn't take HexClad's shelf. They built a bigger one next to it, and they are climbing toward the price band HexClad depends on.
Skillets revenue, 100 hexes = 100%
Tracked Western brands — 41% China-based brands — 9% Unclaimed long tail — 50%
HexClad TTM
$142.4M
76 active ASINs
Carote TTM
$213.3M
336 active ASINs
China brands, Jun 26
$29.3M
vs HexClad $6.4M
Skillets share change
−4.5pt
HexClad, month over month
01
The market
Three subcategories, $56.9M in combined monthly revenue. Sauté Pans is small and it is effectively HexClad's private room. Skillets is where the fight is.
Kitchen Cookware Sets
$36.2M
Skillets
$16.3M
Sauté Pans
$4.4M
Electric Skillets (adjacent)
$1.4M
Sauté Pans HexClad fortress
HexClad holds 40.7% share and gained 17.2 points month over month. Only one China-based brand has real presence, SENSARTE at 15.1%, and it fell 9.3 points. This is a category HexClad can lock.
Skillets Contested
HexClad holds 9.2% and shed 4.5 points, the largest single decline in the subcategory. Caraway, GreenPan, Made In and Carote all took ground in the same window. Nine of eleven tracked China-based brands gained share.
02
The challengers
Seller-entity records confirm the ownership. These are not white-label drop-shippers. They are manufacturers selling direct, with single controlled seller accounts and no channel leakage.
Carote
Zhejiang Carote Industry Trade Co Ltd CN + CAROTE USA LLC
TTM revenue$213.3M
Jun 26$15.4M
Growth, 22mo+231%
ASINs336
Sellers / ASIN0.83
Astercook
Dongguan Vega E-commerce Co. Ltd CN
TTM revenue$78.0M
Jun 26$6.6M
Growth, 22mo+379%
ASINs70
Sellers / ASIN1.01
SENSARTE
Wenzhou Gogogo International CN + Zhejiang Yiju E-commerce
TTM revenue$77.7M
Jun 26$4.2M
Growth, 22mo−3%
ASINs294
Sellers / ASIN0.99
Umite Chef
Hong Kong Xingmu Manufacturing Co., Limited CN
TTM revenue$44.1M
Jun 26$3.2M
Growth, 22mo+103%
ASINs113
Sellers / ASIN0.98
Monthly Amazon revenue, Sep 2024 – Jun 2026
Click a brand to show or hide it. Carote crossed HexClad in early 2026 and has not given the lead back.
Astercook is the one to watch, not Carote
Carote is already big. Astercook grew 379% on only 70 ASINs. That is not catalog spam, it is a small number of extremely well-executed listings. A brand that can do that has the capability to launch upmarket whenever it decides to.
03
Impact on HexClad
Four separate problems. Only one of them is about the Chinese brands directly, which is what makes this fixable.
HexClad is losing its own branded search
65%
of clicks on the term "hexclad" go somewhere outside the top three results
13%
11%
11%
65% leaked
76,735 searches a month. 15 brands running ads on it, 19 ranking organically. CPC is $5.96. On "hexclad cookware," 20 brands are bidding and the top three take just 28%.
Channel leakage HexClad's rivals don't have
14
distinct sellers carry HexClad; most look like unauthorized resellers
Average sellers per ASIN: HexClad 1.76. Carote 0.83, Astercook 1.01, SENSARTE 0.99, Umite Chef 0.98. Every diverter costs Buy Box control and creates the price volatility that trains shoppers to wait for a deal.
The half-star conversion tax
4.3
stars on the hero 6-piece set, against 4.5 to 4.7 across the field
Hero listing
Price
Rating
HexClad 6pc hybrid US
$371
4.3
Carote 26pcs CN
$181
4.7
Astercook 21pcs CN
$81
4.5
Carote 19pcs CN
$93
4.5
Revenue is gift-driven, not replacement-driven
−83%
HexClad's fall from December 2025 to February 2026
Carote's same-window drop was 57%. HexClad's business is a Christmas present. Carote's is a kitchen restock, which is a far more durable base.
Skillets share change, month over month
HexClad gave back more ground than any brand in the subcategory gained.
04
The price-band battleground
This is the clearest picture in the whole dataset. Chinese brands own everything below $80 and have almost nothing above it. The question is whether that wall holds.
China-based brands Western brands
The $80 wall is the whole strategy
In Skillets, China-based brands hold 11 ASINs and $557K in the $80–149 band against 162 Western ASINs and $53.8M. Above $150 they have effectively nothing. That gap is HexClad's remaining moat, and it is one product launch wide.
05
Whitespace they found and took
Carote renamed the category
Detachable handles were a feature. Carote turned them into a search term with its own brand baked in. Shoppers now type the brand name as the category descriptor.
"carote detachable handle cookware set"
8,918
"detachable handle cookware set"
382
Monthly searches. The branded variant grew +8,555 in twelve months and +5,153 in the last three. CPC on it is just $0.78 because nobody contested it early. Astercook followed straight in with its 21-piece removable-handle set.
Piece-count inflation
On a phone screen, "44pcs" next to "6pc" at a third of the price is a brutal comparison, whether or not the pieces are equivalent.
Carote 44pcs CN
$269
Carote 31pcs CN
$290
Carote 26pcs CN
$181
Astercook 21pcs CN
$81
HexClad 6pc US
$371
Use-case copy
Astercook's top listing is written for RV kitchens, stackable storage, induction readiness and Father's Day gifting. That is named demand Western brands are not writing copy against.
Ceramic and PFAS-free
Carote's 25-piece ceramic set launched straight into the health-anxiety trend and is already doing $110K a month on a listing with only 525 reviews.
The $30–49 corridor
In Sauté Pans, 50 Chinese ASINs in this band generated $8.92M trailing twelve months with zero Western competition at that price.
06
Where HexClad still holds
Two findings cut against the alarm, and both matter for how HexClad should respond.
Premium is intact
$88.9M
Western TTM revenue above $80 in Skillets, against $557K for China-based brands
Brand trust at a price point where the buyer researches before clicking is something these brands have not cracked. Sauté Pans reinforces it: above $150 the split is 49 Western ASINs and $27.5M against a single Chinese ASIN doing zero.
They aren't stealing HexClad's exact shopper
Traffic-overlap analysis on HexClad's hero ASIN returns All-Clad, Cuisinart and T-fal as the closest competitors by shared search terms. All-Clad's 10-piece set shares 169 common terms. The nearest Carote ASIN shares only 51.
The Chinese brands are winning a different shopper, the value-set buyer, and growing that pool. HexClad's immediate search-intent rivals are still the legacy Western names. That means the defense is two separate campaigns, not one.
One more thing worth stealing
Cuisinart quietly pulls $342K and $271K a month from two ancient stainless ASINs carrying 9,649 and 11,171 reviews. Review moats built a decade ago still work. HexClad's hero has 5,699 reviews at 4.3 stars; the moat is half-built and the water is the wrong colour.
07
The playbook
Ordered by return on effort, not by size of the idea. Open any item for the detail.
1Shut down the reseller leakageCheapest, highest leverage
Fourteen sellers, 1.76 per ASIN, against roughly 1.0 for every China-based competitor. Names on the listing include Rays Ark LLC, MAGEN CAPITAL GROUP, Orta Industries, "nickaamazonsales inc" and two individual-name sellers.
Brand Registry enforcement, Transparency and Project Zero exist for exactly this. Every diverter costs Buy Box control, undercuts MAP, and creates the price volatility that teaches shoppers to wait rather than convert. This costs nothing but process and it is the single largest structural gap between HexClad and its rivals.
2Stop leaking branded searchFast, measurable
76,735 monthly searches on "hexclad" alone, with 65% of clicks falling outside the top three positions and fifteen brands bidding against it.
Sponsored Brands video plus a top-of-page lock on "hexclad," "hexclad pan," "hexclad cookware," "hexclad set." At $5.96 CPC the math still works when it converts a customer who was one scroll from a Carote ad. Add negative-match discipline so spend concentrates on the branded cluster rather than generic category terms where the Chinese brands have better unit economics.
3Move the 4.3Highest conversion impact
Rating is the one number a comparison shopper weighs directly against Carote's 4.7. Every tenth of a star is worth more right now than a new ASIN launch.
Vine enrolment, review-request automation, and a hard read of the negative reviews on B09ZBF3856 to find the actual complaint pattern. A 4.3 on 5,699 reviews means roughly 900 to 1,100 unhappy buyers left a reason in writing. That is free product research.
4Take the $80–149 band before someone else doesStrategic, 2 to 3 quarters
There is open ground between HexClad's $150+ position and the Chinese wall at $79. A fighter line under a distinct sub-brand, hybrid tech at a lower ply count, blocks the ladder the challengers will climb next.
They will climb it. Astercook grew 379% on 70 ASINs, which is the profile of a brand with the operational discipline to go upmarket the moment margins at the bottom compress. Better to own the rung than to defend against someone standing on it.
5Answer piece count without chasing itMerchandising
HexClad cannot win 44-piece and should not try. It can win "everything a real cook needs, nothing they don't," a curated 10 to 12-piece with a per-piece value story that survives the side-by-side and an image stack that makes the comparison explicit.
The 6-piece hero at $371 against a 26-piece at $181 is a losing frame no matter how good the pan is. Change the frame.
6Defend Sauté Pans deliberatelyProtect the asset
40.7% share and +17.2 points month over month is a genuine asset, and the only China-based brand with presence there, SENSARTE at 15.1%, is falling fast at −9.3 points.
This is a category HexClad can lock while it fixes everything else. Expand the ASIN count from five, own the subcategory badge, and treat it as the profit engine that funds the fighter line in item four.
7Look at the knivesUnder-served demand
"hexclad knives" and "hexclad knife set" pull 16,513 combined monthly searches, with an $8.16 CPC on the set term and 20 brands bidding. That is real category-extension demand with expensive competition already sitting on it.
Worth a read of whether HexClad's own knife listings are capturing it, or whether that spend is subsidising someone else's catalogue.
The Capability Most People Miss
The report identifies each challenger's registered selling entity, which is how it separates manufacturers selling direct from resellers and white-label operations. That distinction changes the competitive read entirely, and most people do not know it is available.
Data It Touches
Market share by subcategory, brand search, seller entity records, product research across price bands, search terms, ad spy.
Go Deeper
Show me every ASIN the challengers hold above the $80 price band and how they are performing
Who is bidding on our branded term and what share does each one take
Map every seller carrying our listings, ranked by offers and revenue
Run the same analysis in [ADJACENT SUBCATEGORY] before they get there
Where It Gets Soft
Seller entity records show a registered business address, which is not the same as where a product is made or where a company is run. Describe what the records say rather than drawing conclusions past them, especially in anything customer-facing.
The seasonality comparison rests on two points in one season. It is a strong signal and worth a full 24-month view before treating it as settled. Click share and CPC are modelled estimates. Revenue and share are estimates throughout, so read the gaps between brands rather than the absolute levels.
How Is Pricing Actually Structured in This Category?
The Prompt
Run as two turns. The first pulls the analysis, the second turns it into the artifact.
Preview
Turn 1
using smartscout's tools, find the groupings of serving sizes for childrens gummies, and the price per serving. Do supply days as well and also multipacks. also pick out any other valuable findings you can find during your research.
Turn 2
great now make some neat visuals with the data and turn it into a shareable pdf doc please
The two-turn pattern is worth copying. Ask for the analysis first, then ask for the artifact. Trying to get both in one prompt usually costs you depth on the analysis.
What You Get Back
A five-page market snapshot of the Amazon US Children's Vitamins subcategory: $11.2M monthly revenue across 327 ASINs and 93 brands, four serving-size tiers, every top listing normalized to cost per daily serving, multipack economics, share of subcategory revenue with month-over-month movement, and a key findings page.
The headline the prompt was not asked for: a 17x spread in cost per daily serving, from $0.08 to $1.38. MaryRuth's took the #1 share position at 31% by selling dosing efficiency rather than a lower sticker price, letting a $22.64 bottle beat rivals on cost per day. SmartyPants quietly halved its dose to cut per-day cost from roughly $0.83 to $0.60.
Preview
Children's gummy vitaminsAmazon US market snapshot
Market snapshot
Children's gummy vitamins
Serving sizes, price-per-serving economics, and multipack analysis across the Amazon US Children's Vitamins subcategory.
$11.2MMonthly subcategory revenue
327Active ASINs across 93 brands
$30.50Average listing price
17×Spread in cost per daily serving
Serving-size groupings
Products cluster into four dosing tiers, and the tier — not the sticker price — drives real cost. Two gummies a day is the dominant format; one-a-day is the efficiency play; three and four-a-day sit at the whole-food premium end.
1gummy / day
Efficiency play
Flintstones MaryRuth's Sugar-Free
Marketed as "60 count = 2-month supply"
2gummies / day
Dominant format
SmartyPants · Olly · L'il Critters · Amazon Basics · First Day · MaryRuth's standard
3gummies / day
Whole-food
Llama Naturals
4gummies / day
Premium
SmartyPants classic 120ct · Garden of Life · Nordic Berries
Bottle counts cluster at60ct (30-day, most common) · 70–90ct · 120ct · 180–190ct value sizes
Price per daily serving
Normalizing every listing to its labeled day-supply reveals a 17× spread — from $0.08/day (Flintstones 180ct) to $1.38/day (First Day). Three clear tiers emerge.
Mass / legacy valueMainstream brandedPremium clean-label DTC
Flintstones Complete
$0.08
L'il Critters Gummy Vites
$0.11
Amazon Basics Kids
$0.11
Mama Bear Organic
$0.27
Olly Multi + Probiotic
$0.32
Olly Kids Multi
$0.36
MaryRuth's Sugar-Free
$0.38
MaryRuth's Toddler Organic
$0.46
SmartyPants Kids
$0.60
Nordic Berries
$0.68
MaryRuth's Kids Multi
$0.81
Garden of Life Organics
$0.89
Llama Naturals
$0.93
SmartyPants Organic
$0.97
First Day Kids
$1.38
Buy-box price divided by labeled supply days. MaryRuth's Sugar-Free hits $0.38/day on a $22.64 bottle purely through 1/day dosing.
Top revenue-generating listings, normalized to labeled day-supply.
Multipack economics
Multipacks are surprisingly rare in this category, and the savings logic is inconsistent.
First Day
−19%Real discount on the 2-pack
Llama Naturals
−11%Savings on the 180ct size
Amazon Basics
~0%Effectively no 2-pack savings
SmartyPants and Olly skip multipacks entirely, laddering bottle sizes instead (60→80→180ct; 70→100→120ct) — and the bigger bottle sometimes costs more per day. SmartyPants' 80ct runs $0.61/day versus $0.60 for the 60ct.
Competitive landscape
Share of subcategory monthly revenue, with month-over-month share change.
MaryRuth's
31%+9 pts
SmartyPants
19%−6 pts
Llama Naturals
12%+5 pts
Olly
7%flat
Other 89 brands
31%
Key findings
MaryRuth's just took #1
31% market share, up +9 points MoM, overtaking SmartyPants (19%, down 6 pts). The winning angle is dosing efficiency — "only 1 gummy a day, 2-month supply" lets a $22.64 bottle undercut rivals on $/day despite a premium sticker.
But MaryRuth's has a supply-chain crack
Top ASINs show 2–10% buy-box suppression and near-zero Amazon in-stock rates (ISR 0.00–0.03). They're winning share while operationally wobbly — an opening for competitors.
SmartyPants quietly reformulated
Legacy 120ct / 4-per-day SKUs are shrinking (organic 120ct down ~$956K TTM) while 2024-launched 60ct / 2-per-day SKUs added $7.5M TTM — effectively cutting per-day cost from ~$0.83 to $0.60 by halving the dose. A Disney-Pixar Toy Story 5 co-branded SKU (April 2026) signals a licensing play.
Olly is buying its position
21% ad-spend share on just 7% market share — the category's most aggressive advertiser. Llama Naturals is second at 12% and it's working (+$615K MoM revenue, +5 pts share).
First Day is collapsing
One 2-pack variation shows −97% twelve-month growth; the $1.38/day price point looks hard to defend when MaryRuth's offers clean-label vegan at $0.38/day.
Amazon private label anchors the floor
Mama Bear ($7.99) and Amazon Basics ($10.38) hold the value tier at ~$0.11–0.27/day with 4.7–4.8 star ratings.
Category context
Average price $30.50, average rating 4.48, average listing age ~6 years — an entrenched market. Growth pockets: toddler-specific SKUs, sugar-free claims, and probiotic/greens hybrids (LILICARE super-greens, Llama probiotic lines are the newest traction stories).
Methodology & notes
Data pulled from SmartScout (US marketplace) for the Amazon Children's Vitamins subcategory, July 2026. Price per serving = current buy-box price ÷ labeled day-supply from the product listing (a daily serving may be 1–4 gummies depending on brand). Revenue and share figures are SmartScout monthly estimates; MoM = month over month; TTM = trailing twelve months. Figures reflect a snapshot and will drift with pricing and promotions.
Data It Touches
Subcategory and market share data, product research across the top revenue listings, ad spy for the share-of-spend comparison.
Go Deeper
Which brands are winning on cost per serving rather than sticker price
Show me the newest ASINs in this subcategory and what claims they lead with
Who is advertising hardest relative to the share they hold
Run the same normalized pricing analysis in [ADJACENT SUBCATEGORY]
Where It Gets Soft
Cost per serving depends on the labeled day-supply from the listing, which brands write themselves and sometimes state loosely or not at all. Spot check the dosing on any listing you plan to quote. Revenue and share are monthly estimates. The whole picture is a snapshot and drifts with pricing and promotions, so date-stamp it before sending it anywhere.
Is Our Growth Coming From Ad Spend or From Off-Amazon Demand?
Preview
I'm an agency and my client is [BRAND].
Is [BRAND]'s growth coming from on-Amazon spend (PPC) or off-Amazon efforts? Where should my brand invest?
I need to report this to stakeholders regarding their strategy on incremental spend.
This prompt is short but it asks a genuinely hard question, and the shape is worth copying. It states the relationship (agency, this client), asks an attribution question rather than a reporting question, and names the audience for the answer. That last part changes the output: "I need to report this to stakeholders" produces a defensible recommendation instead of a data dump.
The Question Underneath
Most growth reporting tells you a brand grew. This asks why, which is the question a CFO actually asks before approving more budget. On Amazon that attribution is genuinely difficult, because paid and organic lift look similar in a revenue line.
The way to get at it is to compare three trends against each other:
Ad spend share over time against revenue over time. If spend is climbing in step with revenue, growth is bought. If revenue is outrunning spend, something else is driving it.
Branded search volume against generic category search. Branded demand growing faster than the category is the fingerprint of off-Amazon activity, since nobody searches a brand name because of a sponsored placement on a generic term.
Organic rank movement on the head terms. Rank gains that hold without spend behind them point to conversion and relevance rather than budget.
Where those three disagree is the finding.
What You Get Back
Preview
Swig Life · Account Growth Brief
Is growth coming from Amazon PPC or off-Amazon demand?
An incremental-spend read for the board conversation.
Amazon USTrailing 12 monthsSmartScout market data
Bottom line
There isn't much growth to attribute yet
Swig's revenue is flat-to-seasonal over the trailing 12 months. Before deciding where to put incremental dollars, the board needs to see that neither channel is currently generating net growth — the real opportunity is in two specific gaps.
0.24%
PPC isn't the growth engine
Ad spend is $27.3K TTM — about 0.24% of revenue. It's defending brand terms, not driving the topline.
–32.6%
Off-Amazon brand demand is softening
Core branded search (“swig”, “swig tumbler”) is down 6.5–32.6% over 12 months — awareness isn't the driver either.
0.47%
The real gap is category-term invisibility
Swig holds 0.47% share of voice on non-branded category terms, versus 6–12%+ for Stanley, YETI, and Owala.
Simply Sales · Swig Life growth driver analysis02
Revenue trend
Monthly revenue tracks the holiday calendar, not a channel
$1,800K$1,350K$900K$450K$0K
Aug-25
Sep
Oct
Nov
Dec
Jan-26
Feb
Mar
Apr
May
Jun
Jul-26
Reading it
—Nov–Dec spike ($1.26M → $1.60M) is the holiday gifting window, not a paid push — ad spend is flat all year.
—12-month average MoM growth is –3.2%. Outside the holiday months, revenue oscillates in a $0.4M–$1.0M band.
—Units track revenue almost 1:1, so this isn't a pricing effect — it's genuinely fewer units outside peak season.
Simply Sales · Swig Life growth driver analysis03
Paid media benchmark
Swig spends like an organic brand — because it mostly is one
Ad spend as a share of revenue, TTM
Swig Life
0.24%
Stanley
0.22%
YETI
0.32%
REDUCE
1.62%
Simple Modern
1.22%
BrüMate
2.46%
What this tells us
—Swig (0.24%) sits right next to Stanley (0.22%) and YETI (0.32%) — the two most organically dominant brands in the set.
—BrüMate, Simple Modern, and REDUCE all spend 5–10x that ratio — they're buying visibility their organic presence doesn't yet earn.
—So Swig isn't under-spending in isolation — it's under-spending relative to a brand its organic size, not relative to Stanley or YETI.
Simply Sales · Swig Life growth driver analysis04
Share of voice
Swig owns its name, but is nearly invisible past it
On Swig's own branded termsOrganicPaid
Swig Life
SANDJEST
LARQ
Greens Steel
Simple Modern
BrüMate
On non-branded category terms
6.02%Stanley
2.99%BrüMate
2.11%Simple Modern
0.47%Swig Life
0.22%REDUCE
For reference, category leaders Owala (12.55%) and Contigo (7.84%) sit off this scale — both almost entirely organic.
Simply Sales · Swig Life growth driver analysis05
Off-Amazon demand proxy
Core brand demand is cooling;new product lines are heating up
12-month branded search growth
“swig”–6.5%
“swig tumbler”–32.6%
“swig 40oz tumbler w/ handle”+19.9%
“swig lunch box”+7.2%
What's actually growing
—“swig lunch box” search volume is up 264% in 3 months and 1,837% in 6 months — a genuinely new demand pocket, likely social / off-Amazon driven.
—“swig 40oz tumbler with handle” is up 19.9% over 12 months, the one core-product term still growing.
—The head terms are both declining, meaning overall brand awareness for the flagship tumbler line is not being refreshed.
—Competitors show the same pattern: Simple Modern's head term is down 57.5% while its lunch box, backpack and bento terms are up 115–1,730%.
Simply Sales · Swig Life growth driver analysis06
Competitor patterns
Spend alone doesn't explain growth or decline
Brand12-mo growthAd spendPattern
BrüMate↑ +18.9%$1.30MHeavy PPC plus genuine off-Amazon demand growth on specific SKUs (water bottle +186%, slim can cooler +2,315%). Paid and organic pulling together.
REDUCE↑ +74.8%$195KModerate spend (1.6% of revenue) with a real May-26 volume spike — smaller base, but the clearest revenue growth in the set.
Simple Modern↓ –18.9%$1.17MHeavy spend but declining — core brand term down 57.5%. Spend is propping up new SKUs, not rescuing the flagship line.
Swig Life↓ –3.2%$27KMinimal spend, flat revenue, declining core brand search. Growth, where it exists, is coming from a new product line — not either channel.
Simply Sales · Swig Life growth driver analysis07
Recommendation
Where incremental dollars should go
1
Buy category-term visibility
Swig is nearly absent (0.47% SOV) on non-branded terms where BrüMate and Simple Modern are winning share with paid alone. This is open whitespace, not a defended position.
2
Back the lunch box line off-Amazon
It's already generating organic demand on its own (+264% search in 3 months). Off-Amazon content and social investment here compounds faster than defending the core tumbler term.
3
Don't expect PPC to fix flat revenue alone
Simple Modern proves heavy spend doesn't offset a declining core term. Any new spend should follow the demand signal above, not blanket the whole catalog.
Simply Sales · Swig Life growth driver analysis08
Data It Touches
Ad spy for spend share over time, brand search for the revenue trend, search terms for branded versus generic demand, organic ranks, market share for category context.
Go Deeper
Show me branded search volume against category search over 24 months
If we hold ad spend flat next quarter, what does the data suggest happens
Which terms are we winning organically versus buying
What are the competitors gaining share doing differently on spend
Where Does This Brand Actually Make Its Money, and What Should It Do About It?
Another packaged workflow rather than a single prompt. Name a brand, get back a 5 to 7 page report on where that brand actually makes its money and what it should do about each position.
What It Does
The report answers four things for one brand: which three subcategories carry the revenue, how the brand stacks up in each on share, ad spend share, rank, and month-over-month trend, who leads the category and who the closest competitors are by revenue, and one concrete action per subcategory.
The only required input is the brand name. Add a recipient and it prints a "prepared for" line on the cover.
What Comes Out
Run on Medicube, the report finds a tension worth the whole page. The brand is the outright #1 in all three of its largest subcategories, and all three are contracting month over month: Serums down 6.2%, Masks down 13.9%, Toners down 16.2%. Meanwhile total brand revenue is up 9.5% month over month and roughly 214% over twelve months. Growth has quietly moved to newer lines while the hero categories that built the brand erode.
Preview
SmartScout
Medicube — Subcategory Market Position ReportConfidential
Amazon Marketplace Intelligence
Medicube
Subcategory Market Position Report
Prepared by
SmartScout Insights
Date
August 4, 2026
Marketplace
Amazon US
Scope
Medicube's three largest Amazon subcategories by monthly revenue
Executive Summary
Medicube generates roughly $34.2M in monthly Amazon revenue across 215 ASINs, and its three largest subcategories by revenue — Serums, Masks, and Toners & Astringents — together account for about $15.7M of that, or 46% of total brand revenue. The remaining 54% is spread across a long tail of smaller lines, most notably Face Moisturizers, Wrinkle & Anti-Aging Devices, and Balms.
The headline pattern is consistent, not mixed: Medicube is the outright #1 brand by revenue in all three of its top subcategories, but all three are also contracting month over month — Serums down 6.2%, Masks down 13.9%, and Toners & Astringents down 16.1%. Being the category leader everywhere and still losing ground everywhere is the central tension this report digs into.
That softening in the historical core sits against a brand that is growing overall — monthly revenue is up 9.5% month over month and roughly 214% over the trailing 12 months. That growth is increasingly coming from outside the top three: Wrinkle & Anti-Aging Devices, Balms, and the newly-launched Neck & Décolleté line each posted large month-over-month gains. Medicube looks less like a brand in decline and more like one whose growth engine is shifting away from the hero SKUs that built it — worth watching before the core erosion outpaces the new-line growth.
01
Serums
Medicube's single largest subcategory by revenue, and its most precarious #1 — the lead over the runner-up is under 1%.
Medicube's lead in Serums is razor-thin: $5.41M versus THE ORDINARY's $5.37M, a gap of under $40K — roughly 0.7% of Medicube's own revenue in this subcategory. This is a lead that could flip next month, not a comfortable #1.
Both brands are shrinking in step — Medicube down 6.2%, THE ORDINARY down 10.2% — so the top spot is actually holding (and the gap widening slightly) because the incumbent leader is declining more slowly, not because either brand is growing. That reads as category-wide softening rather than a Medicube-specific problem, but it doesn't make the #1 position any less fragile.
Both leaders are also spending on ads at roughly 60% of their market-share weight (Medicube 3.0% ad spend share against 5.1% market share; THE ORDINARY nearly identical), while fourth-place ANUA over-indexes on spend (4.9% ad spend share against a 3.6% share) and is the only top-5 brand actually growing revenue month over month. ANUA is $1.6M behind today, but it's the one gaining while the top two erode.
Test incremental ad spend specifically in Serums — a subcategory this close, with a similarly-underspending #2 and a faster-growing #4 closing from behind, is exactly where a modest spend increase is most likely to protect the #1 position rather than just pad an already-secure lead.
02
Masks
Medicube's most comfortable #1 by revenue margin, currently absorbing a category-wide pullback better than its nearest rival.
n/d = not disclosed / no measurable Sponsored ad spend detected for that brand in this subcategory.
SmartScout callout — Masks
This is Medicube's safest lead of the three: at $5.36M it holds more than 1.8x the revenue of second-place BIODANCE ($2.96M), a much wider cushion than the near-tie in Serums.
Masks is contracting broadly — Medicube's revenue is down 13.9% month over month — but BIODANCE is faring worse, down 26.1% and losing 2.24 percentage points of share versus Medicube's 0.92-point loss. In relative terms, Medicube is gaining ground on its closest rival even while both brands shrink in absolute dollars.
Medicube's ad spend share (16.5%) tracks close to its market share (18.0%, a 0.92 ratio) — proportionate, neither aggressive nor starved. BIODANCE, by contrast, spends at less than half its share weight (4.2% spend against 9.9% share), which likely explains why it's eroding faster; that's a BIODANCE problem, not evidence Medicube should change course here.
Hold ad spend steady in Masks and consider shifting a modest amount of incremental budget from this comfortable position into Serums, where the #1 spot is genuinely contested — Masks doesn't need the defense that Serums does right now.
03
Toners & Astringents
Medicube's most dominant share position and its steepest monthly decline — a combination that points away from ad spend as the fix.
Medicube's dominance here is the strongest of the portfolio — 22.5% market share, more than 4x second-place ANUA's 5.6% — yet this subcategory posted the steepest month-over-month decline of the three, down 16.1% in revenue and 2.37 percentage points of share.
The notable structural fact: Medicube's ad spend share (30.5%) runs well above its market share (22.5%), a 1.36 ratio — the highest ad-spend-to-share ratio anywhere in this report — and it's still the fastest-eroding of the three subcategories. Heavy spend is demonstrably not preventing the slide here.
The decline isn't unique to Medicube — ANUA and THAYERS are both softening too — but THE ORDINARY and Clinique, both spending far below their share weight, are actually growing revenue slightly. That undercuts the case that more ad spend is the answer for Medicube specifically.
Don't add incremental ad spend to Toners & Astringents — the brand is already over-indexed on spend relative to share and still losing ground fastest here. Run a listing and creative refresh (and a price/promo check against ANUA and THAYERS) before considering any further budget increase.
Serums: test incremental ad spend to defend the sub-1%-margin #1 position over THE ORDINARY before fourth-place ANUA's growth closes the gap.
Masks: hold spend steady — the lead is comfortable (1.8x runner-up) and Medicube is losing less share than BIODANCE in a category-wide pullback.
Toners & Astringents: pause on ad spend increases and prioritize a listing/creative and pricing refresh — spend already runs above market-share weight (30.5% vs 22.5%) and the subcategory still has the fastest decline in the portfolio.
Portfolio-wide: Medicube is #1 in all three of its largest subcategories yet all three are contracting month over month even as total brand revenue grows 9.5% MoM — growth is shifting toward newer lines (Wrinkle & Anti-Aging Devices, Balms, Neck & Décolleté). Treat the hero-category decline as an early signal to address now, before it outpaces the new-line growth carrying the brand's topline.
Source: SmartScout, Amazon US marketplace data retrieved August 4, 2026. Revenue figures are SmartScout monthly revenue estimates; "MoM" reflects month-over-month change as reported by SmartScout. "Ad spend share" denotes each brand's estimated share of Sponsored ad spend within the subcategory.
The Analytic Move Worth Stealing
The report divides ad spend share by market share, then reads the ratio. Same brand, three subcategories, three opposite recommendations:
Subcategory
Share
Ad spend share
Ratio
Recommendation
Serums
5.11%
3.0%
0.59
Test more spend. The #1 lead is under 1% and a faster-growing #4 is closing.
Masks
18.00%
16.5%
0.92
Hold. The lead is 1.8x and the runner-up is eroding faster.
Toners
22.53%
30.5%
1.36
Do not add spend. Already over-indexed and still declining fastest. Fix listings and pricing first.
That middle column is why the report is useful. Most analysis tells a brand losing share to spend more. Here the fastest-eroding subcategory is the one already spending well above its share weight, which points at creative, listings, and price rather than budget. Two competitors spending far below their share weight are the only ones growing, which makes the case harder to argue with.
Data It Touches
Brand search for the overall footprint, market share by subcategory, subcategory brand rankings for leader and competitor sets, product research to verify the subcategory mix.
Go Deeper
Run the same report on the two closest competitors and compare the spend ratios
Which newer lines are carrying the growth, and how fast are they scaling
What did the brands gaining share change in the last 90 days
Rebuild this quarterly so the month-over-month reads as trend instead of noise
Where It Gets Soft
Picking the top three subcategories is the step that decides whether the whole report is right, and the fast way to get them can under-report on brands with long-tail catalogs. In testing on one brand it returned subcategories summing to roughly $580K against an actual total near $1.98M, missing the brand's single largest line. For any brand with hundreds or thousands of ASINs, verify the mix against the product catalog before committing to the three.
Everything else carries the usual caveats. Revenue, share, and ad spend share are estimates. An undisclosed ad spend share is not zero, and reporting it as zero makes a different claim than the data supports. Month-over-month movement on a single month is noisy, so read it against the twelve-month trend before calling it a direction.
Get Me Ready for a Strategy Meeting on This Brand
The Prompt
Preview
You are a senior Amazon market intelligence analyst preparing a pre-meeting briefing on new zealand honey co for a strategic conversation. Use the SmartScout MCP server to pull the following data, then synthesize it into a tight, executive-ready briefing.
DATA TO PULL and insights to create:
Brand overview for new zealand honey co: estimated monthly revenue, total ASIN count, category footprint, growth trajectory over the last 12 months.
Top 10 ASINs by revenue: title, price, monthly revenue estimate, review count, BSR trend, and whether they're winning or losing share in their subcategory.
Top 5 competitors in their primary category: relative market share, growth rate vs. new zealand honey co, and any competitor that's gained meaningful share in the last 6 months.
Category dynamics: total category size, growth rate, top movers (brands gaining and losing share fastest), and any notable new entrants.
White space opportunities: subcategories or price points where new zealand honey co underindexes vs. category leaders.
Give me an executive summary of the best moves new zealand honey co can make today.
Three things make this one work. Assigning a role sets the voice. Numbering the data to pull means nothing gets skipped. And ending with "best moves today" forces a recommendation instead of a summary. Use this shape whenever you need something you can walk into a meeting holding.
What You Get Back
A briefing tight enough to read in the parking lot. Roughly $1.05M monthly revenue, $13.5M trailing twelve, 56 ASINs, the highest average selling price of any major honey brand at $117.76, and a single seller controlling 98.3% of GMV.
The read that matters: the brand is up 20.5% year over year but down 9.8% last month, and its share still ticked up because the category fell faster. Losing more slowly than everyone else is a defensive win, not an offensive one.
The strategic call is a reframe. The threat is not the mass-market leader bleeding share at the bottom. It is Manukora at the top, the only premium Manuka peer gaining share, doing it with 12 ASINs against 49 and higher ad intensity, by owning a sub-$30 entry tier the brand has left empty. That gap is roughly $270K a month being conceded.
The Competitive Set
Brand
Mo. revenue
Share
Share change
Read
Nate's Honey
$1.31M
13.3%
-2.25pp
Mass market, bleeding fast
NZ Honey Co
$1.05M
10.6%
+0.28pp
Holding in a falling category
Manukora
$648K
6.6%
+0.29pp
The real threat. 11.3% ad share vs 7.2%
Wedderspoon
$406K
4.1%
-0.63pp
Established, declining
Manuka Doctor
$402K
4.1%
-0.60pp
Premium UK, declining
The Three Moves It Lands On
Plug the entry-tier hole. Launch a sub-$25 Manuka SKU against Manukora's $13 to $25 doorway. Capturing 30% of that ceded segment is roughly +$80K a month.
Lean into ads on the flagship tiers. Under-indexing at 7.2% ad share while owning the highest-margin SKUs in the category, and three of the top five peers are retreating, so CPC pressure is loosening. A rare offensive window.
Build review density on ultra-premium. The $175 UMF 26+ SKU carries 709 reviews against the flagship's 5,700. That credibility gap costs conversion on the highest-margin tier.
Full Briefing Output
Brand snapshot. ~$1.05M monthly, $13.5M trailing twelve, 56 ASINs with 49 active in Honey, $117.76 average selling price, 19,404 monthly units, 4.61 stars across 26.6K reviews, brand score 8.2. Storefront live with one seller at 98.3% of GMV.
Concentration. Revenue clusters in UMF 20+, where three of the top four SKUs carry roughly $398K a month, about 38% of the brand. The UMF 24+ and 26+ tiers price at $108 to $186 on thin review bases, which reads as the fastest available lift.
Category. Honey runs $9.88M a month and $136M trailing twelve across 427 brands and 1,975 ASINs, average price $34.05. Up 23% over twelve months, down 3.0% last month in a broad contraction. Channel mix is 70% third-party seller, 30% Amazon retail.
Movers. Nature Nate's went zero to 1.07% share in a single month on 5 ASINs at roughly $89. MJO added $76K with an odd profile, 2.9 stars on 94 reviews at $51. Desert Creek gained quietly at a $67 average price. Nate's, Wedderspoon, Manuka Doctor and Manuka Health all fell between $40K and $300K.
Other whitespace. Subscribe and Save plus multipack bundling looks under-captured given daily-wellness positioning. The honey dipper adjacency sits at 2 ASINs and 4% share and declining, which is the worst of both options.
Watch list. Nature Nate's, to work out whether it is a new brand, a rebrand, or a pricing anomaly. MJO, whose rating and velocity do not fit together.
Data it touches
Brand search, product research across the top ASINs, subcategory and market share data with month-over-month movement, ad spy for share of spend.
Go deeper
Build the case for the entry-tier SKU with pricing and volume assumptions
Show me Manukora's full price ladder and which rungs convert best
What happened to the brands losing share, and is any of it recoverable demand
Pull the same briefing on [SECOND BRAND] so I can compare before the meeting
Where It Gets Soft
Single-month moves are noisy. The 9.8% monthly decline here sits inside 20.5% annual growth and a category that fell 3% in the same window, so read the month against the year and the category before calling it a trend. Revenue and share are estimates. The note about a competitor's rating not matching its velocity is an inference worth investigating, not a finding, so keep that framing if it goes in front of a customer.
Build Me a Target List of 100 Brands Worth Pitching
The Prompt
Preview
You have the SmartScout MCP connected. we are an Amazon agency — we do full-service management: retail media/ads, listing content and catalog, review velocity, and marketplace strategy. We have no outbound sales team and want a data-backed target list.
Build me a prospect hit list of 100 brands that show clear, fixable underperformance on Amazon right now. Screen on signals like: declining revenue or subcategory market share over the trailing 6–12 months, weak paid presence relative to category peers, low review counts or ratings versus competing ASINs, thin or stale listing content, and unprotected/contested buy box. Prioritize brands large enough to afford agency fees but not so large they already have a sophisticated internal team — roughly $2M–$50M annual Amazon revenue.
Output in two parts:
Part 1 — Top 5, detailed. For each: brand, category, est. annual Amazon revenue, the specific decline or gap with numbers, which our service fixes it, the outreach angle in one or two sentences, and what to say in the first email.
Part 2 — Top 100, table. Brand, category, est. revenue, trailing trend, primary weakness, primary agency service fit. One row each, no commentary.
State your screening criteria and thresholds before you start pulling so I can adjust.
Three Techniques Doing the Heavy Lifting
Say who you are and what you sell. Listing the four service lines is why every prospect comes back matched to a specific service instead of a generic "needs help."
Ask for the criteria before the work. The last line is the most useful sentence in the prompt. You get the thresholds first, adjust them, and only then does it go pull 100 brands. Without it you find out the screen was wrong after the output exists.
Ask for two tiers. Five worked in full plus 100 in a table gives you something to act on Monday and something to work through for a quarter.
What You Get Back
A screened list of 100 brands in a $3M to $20M revenue band with trailing declines from 3% to 40%, across four categories, plus the top five worked all the way to a written first email.
The screen states its own thresholds up front: revenue band, decline range, a minimum catalog of 10 products and 100 reviews to exclude noise, and a manual exclusion of brands owned by major CPG or luxury parents. That last filter is what makes the list usable, since a brand inside a large parent is not an agency's buyer.
Preview
Prospecting reference
Amazon prospect hit list — declining mid-market brands
One hundred brands doing $3M–$20M on Amazon with a trailing revenue decline and at least one diagnosable gap: underfunded paid, a rating under the conversion threshold, thin review depth, or missing catalog and storefront coverage. Five are worked in full, with the numbers and a first email.
Data sourceAmazon US marketplace
Revenue history throughMid-July 2026
100Brands screened in
$3M–$20MTTM revenue band
−3% to −40%Trailing 12-mo MoM trend
4Categories in scope
Screening criteria
Composite scored on depth of trailing decline, ad spend as % of TTM revenue, average rating, reviews per ASIN, and storefront presence.
Filter
Threshold
Field
Revenue band
$3M – $20M TTM
Trailing 12-month revenue
Trailing decline
−3% to −40%
Average 12-month MoM growth
Real catalog
≥ 10 products
Total products
Real review base
> 100 reviews
Total reviews
Categories
Beauty & Personal Care, Home & Kitchen, Health & Household, Grocery & Gourmet Food
Primary category
Excluded manually
Brands owned by major CPG or luxury parents, and rows with visible category misclassification.
Every month from Dec 2025 forward is below the same month a year earlier. This is not seasonality — the year-ago comparison controls for it.
The gap, with numbers
Ad Spy shows "beach waver curling iron" pulling 35,360 monthly searches at an estimated CPC of $8.48 (range $6.36–$10.60), with 20 brands actively advertising on it. Generic "curling iron" clears at $1.99. Competitors have bid Beachwaver's own brand term to more than 4x the category rate. Total ad spend is $227K against $13.2M TTM — 1.7% of revenue, well under the 3–6% category norm. They are being conquested on their own name and not defending it.
Retail mediaDefensive brand-term campaigns first
Outreach angle
Twenty brands are paying up to $10.60 a click to intercept people searching for Beachwaver by name, and Beachwaver isn't bidding hard enough to hold the top slot. That's the cheapest revenue in the account to win back.
First email
Subject: 20 brands are bidding on "beachwaver" — you're not top slot
Hi [name],
I pulled Amazon ad data on your category this week. "Beach waver curling iron" gets about 35,000 searches a month, and 20 brands are currently bidding on it — CPC is running $6–$10 versus $1.99 for generic "curling iron." That premium exists because people are typing your name and competitors are paying to get in front of them.
Your Amazon revenue is down roughly 45–55% year over year across Feb through June. Some of that is category, but branded-term leakage is the part that's fixable in about 30 days.
Worth 20 minutes? I'll walk you through the keyword data — no deck.
[signature]
2
Frownies
Eye wrinkle pads & patches · Beauty
Est. annual revenue$19.5M
Trailing trend−25.5%Verified vs. monthly series
Monthly revenue series
Month
Revenue USD
Note
Sep 2025
$1.78M
Baseline
Nov 2025
$2.47M
Holiday peak
Apr 2026
$1.19M
No recovery
Jun 2026
$1.08M
−39% vs. Sep
No month after November recovers to the September starting level. June is the weakest complete month in the window.
The gap, with numbers
Average rating 3.98 across 56,095 reviews — the lowest rating of any brand in this revenue band in the set, and below the 4.2 threshold where Amazon conversion falls off sharply. Ad spend is $57,497 on $19.5M TTM: 0.30% of revenue, roughly a tenth of category norm. Catalog is only 20 products for a $19.5M brand.
Review velocityRetail media, second
Outreach angle
A 130-year-old brand doing nearly $20M on Amazon with a 3.98 rating is leaving conversion on the table on every session — and at 0.30% ad spend, they're not buying traffic either. Both are fixable without touching the product.
First email
Subject: Frownies is at 3.98 stars — that's the whole conversion problem
Hi [name],
Frownies is doing close to $20M a year on Amazon, which is remarkable for a 20-SKU catalog. But you're sitting at 3.98 stars across 56,000 reviews, and 4.2 is roughly where Amazon's conversion curve breaks. Every point of traffic you get converts worse than it should.
The other half: your Amazon ad spend looks like about 0.3% of revenue. Category peers run 3–6%. So you're converting below par on traffic you're barely buying.
Your revenue is down about 39% from September to June. I think a meaningful chunk of that is these two things, not demand.
Can I show you the numbers? 20 minutes.
[signature]
3
THE COMFY
Wearable blankets · Home & Kitchen
Est. annual revenue$14.4M
Trailing trend−8.5%Unconfirmed — see caveat
Trend caveat
This brand is heavily gift-seasonal — Dec 2025 peaked at $4.50M against $182K in June 2026. Prior-year monthly comps were unavailable, so seasonal decay cannot be separated from true decline. Treat the trend as unconfirmed; the ad gap stands on its own.
Dec 2025$4.50M
Jun 2026$182K
The gap, with numbers
Total ad spend of $3,142 against $14.4M TTM revenue — 0.02% of revenue, the lowest ratio of any brand in the 100-brand set. Meanwhile the brand holds a 4.78 average rating across 125,791 reviews, the strongest rating/review profile in the top 5. They have earned the social proof and are buying almost no traffic to put in front of it.
Retail mediaBuilt from zero
Outreach angle
A 4.78-star brand with 125,000 reviews spending $3,000 a year on Amazon ads is the rarest thing in the category — proven conversion with no traffic engine attached. Paid is pure upside here, not a rescue.
First email
Subject: 4.78 stars, 125k reviews, $3k in ad spend
Hi [name],
THE COMFY has one of the best review profiles I've seen in home goods on Amazon — 4.78 stars across 125,000+ reviews. That's the hard part, and you've already done it.
What caught my attention is that your Amazon ad spend appears to be around $3,000 against roughly $14M in sales. Most brands your size run 3–6% of revenue. You're at a fraction of a percent.
That's unusual, and it's good news: when conversion is already proven, paid traffic is additive rather than a gamble. Given how seasonal your business is, there's a case for building this before Q4 rather than during it.
Open to a short call?
[signature]
4
EYE-VAC
Canister vacuum cleaners · Home & Kitchen
Est. annual revenue$14.7M
Trailing trend−8.7%Field-based, not verified
Signals
Ad spend$47,0940.32% of revenue
Average rating4.6333,069 reviews
Catalog29products
Category paid norm3–6%of revenue
The gap, with numbers
Strong conversion signal, near-zero paid support, and a narrow SKU footprint in a category where variant coverage drives share. Ad spend $47,094 on $14.7M TTM = 0.32% of revenue; rating 4.63 across 33,069 reviews; catalog thin at 29 products.
Retail mediaCatalog & variation expansion, phase two
Outreach angle
4.63 stars and 0.32% ad spend means EYE-VAC wins every comparison it's actually shown in — it just isn't being shown. Paid plus wider variant coverage is a straightforward share play.
First email
Subject: EYE-VAC converts well — it's just not getting shown
Hi [name],
Quick observation from Amazon category data: EYE-VAC holds a 4.63 rating across 33,000 reviews, which is above most of the canister vacuum set. But your ad spend looks like roughly 0.3% of revenue, and you're running about 29 SKUs.
Translation: when a shopper sees you next to a competitor, you tend to win. The problem is how rarely that comparison happens.
Revenue is off modestly over the trailing year. I'd argue that's a visibility problem rather than a product one, and it's the more fixable of the two.
Worth a conversation?
[signature]
5
Nextmug by Nextboom
Tea & espresso beverage warmers · Home & Kitchen
Est. annual revenue$15.1M
Trailing trend−10.5%Field-based, not verified
Signals
Ad spend$23,4030.15% of revenue
Average rating4.25At the threshold
Total reviews7,654365 per ASIN
Catalog21products
The gap, with numbers
Rating 4.25 is right at the conversion threshold, and low for a premium-priced device. Only 7,654 total reviews across 21 products — thin for a brand at this revenue, which suggests review velocity has not kept pace with sales volume. Ad spend is 0.15% of revenue.
Review velocityListing content, then retail media
Outreach angle
$15M on a 21-SKU catalog with only 7,600 reviews and a 4.25 rating — the sales are there but the social proof and the paid engine are both underbuilt, which is why the trend has turned.
First email
Subject: $15M in sales, 7,600 reviews — that ratio is the issue
Hi [name],
Nextmug is doing around $15M a year on Amazon across about 21 SKUs. Impressive. But you've only accumulated ~7,600 reviews, and you're sitting at 4.25 stars.
For a premium-priced device, both of those numbers are working against you at the moment of decision — shoppers comparing warmers see thinner social proof than your actual sales volume would suggest, and 4.25 is right at the edge where Amazon conversion softens.
Your ad spend also looks like about 0.15% of revenue, so there's not much pushing against it.
Revenue is down roughly 10% over the trailing year. I think review velocity is the highest-leverage fix. Can I show you what I'm seeing?
[signature]
Part 2
The full 100
PaidAd spend under ~1% of revenue
RatingAverage rating below 4.30
ReviewsThin reviews per ASIN
ContentNo Brand Store, catalog gaps
StrategyDecline steeper than 25%, paid already funded
92Great Bay HomeHome & Kitchen$17.8M−5.1%Paid — 0.16% of revRetail media
93PompeianGrocery$18.4M−4.8%Paid — 0.91% of revRetail media
94UmbraHome & Kitchen$16.2M−4.3%Paid — 0.98% of revRetail media
95MorovanBeauty$11.0M−3.8%Paid — 0.18% of revRetail media
96IvilonHome & Kitchen$15.7M−3.7%Paid — 0.45% of revRetail media
97SeoulCeuticalsBeauty$10.9M−3.6%Paid — 0.76% of revRetail media
98The Republic of TeaGrocery$20.0M−3.1%Content — no storefrontCatalog & content
99BruderHealth & Household$19.3M−3.1%Paid — 0.69% of revRetail media
100L'ANZABeauty$12.4M−3.0%Content — no storefrontCatalog & content
No brands match these filters. Clear the search or pick “All categories” and “All services”.
What Makes the Top Five Worth Reading
Each one names the specific fixable gap with a number attached. Competitors bidding a brand's own name to more than 4x the generic category rate while the brand spends 1.7% of revenue on ads against a 3 to 6% norm. A brand sitting at 3.98 stars, below the threshold where conversion falls off, spending 0.30% of revenue on ads. A brand with 4.78 stars across 125,791 reviews spending $3,142 a year on advertising, which is proven conversion with no traffic engine attached.
That last framing is the interesting one. It is not a rescue pitch, it is pure upside, and it reads completely differently in a first email.
The Integrity Move
The report checks declines against prior-year monthly comps to rule out seasonality, and where those comps were not available it says so and marks the trend unconfirmed rather than quietly counting it. One gift-heavy brand went from $4.50M in December to $182K in June, which looks catastrophic and is mostly a calendar. The entry stands on its ad gap instead. Worth copying that habit, because a prospect will absolutely know their own seasonality.
Data It Touches
Brand search across the revenue band, market share and subcategory trend, product research on catalog and review depth, ad spy for spend and CPC, search term volumes.
Go Deeper
Re-run the screen with the revenue band at [RANGE] and tell me what changes
Rank all 100 by how fast the primary gap could be fixed
Pull the full teardown on the top three before I reach out
Which of these have contested buy boxes, and who is on the listings
Where It Gets Soft
Revenue, ad spend, and CPC are estimates, so a brand near a threshold may not belong in the band at all. Widen the range rather than trusting the edges.
A trailing decline is not automatically a problem to sell against. It can be seasonality, a deliberate SKU exit, a channel shift, or a parent-company decision, and the brand knows which. Check prior-year comps before treating any decline as a finding, and say so when you cannot.
Category norms like a 3 to 6% ad spend benchmark are reasonable rules of thumb rather than measured figures from this dataset. Present them as context, not as the brand's own number.
Pitch a Prospective Client With Their Own Data
How an agency wins a new client: show up to the first meeting already holding a diagnosis of their business.
The Prompt
Preview
I have a meeting with [BRAND] and want to present a brand analysis to them. identify the top subcategories they operate in and their market positions, how their share has grown or shrunk in each, their resellers, and identify opportunities to grow based on strengths and weaknesses illuminated in the data.
Then a second step that most people skip: attach the agency's brand style guide as a template and run the report through Claude Design to produce the finished presentation.
That second step is the difference between a document and a deliverable. The analysis is the same either way. Feeding it a style guide is what makes it land as something you built for them rather than something you generated.
What You Get Back
A seven-section pitch deck on Amazon UK. £2.89M trailing twelve, #1 in retractable ballpoint pens, and revenue down 17.1% month over month. Strong brand, stalled momentum, which is the opening an agency wants.
The finding that sells the meeting is distribution. Zebra runs a storefront but does not control its own listings: one seller holds 63.2% of brand revenue, the top two hold about 85%, and roughly 48 more sit in the tail. That concentration plus long tail is the signature of grey-market resale, and it points straight at a MAP enforcement and seller consolidation programme. It is a problem the brand can feel and an agency can fix.
The second finding is demand drifting away from the brand name. The generic term now out-searches the branded one, with 15 brands competing on the generic against 10 on the branded. Dupes are intercepting demand the brand built. Meanwhile "ballpoint pen" runs 9,568 searches a month across 29 fragmented brands with no dominant owner, which is an obvious paid opening given the #1 position in retractables.
The deck is also honest about what is noise. One category shows a large share swing off a single ASIN, and the report says so rather than counting it as momentum.
Zebra Pen preview
Amazon Growth Partners
Amazon UK Marketplace Analysis
Zebra Pen
A growth diagnosis & the plan to defend and expand share
£2.89MTrailing 12-month revenue
#1Retractable ballpoint pens
−17.1%Revenue, month-over-month
Prepared forZebra Pen — brand leadership team
Data: SmartScout · July 2026
01Executive summary
A strong year — with momentum that has stalled
Zebra Pen holds a fragmented, category-dependent position on Amazon UK. It leads retractable ballpoint pens — its largest category — yet slips to #6 in general ballpoint pens and #9 in highlighters, a category where a globally iconic Zebra line (Mildliner) is losing search visibility to competitors and dupes.
£149,311Estimated monthly revenue
£2.89MTrailing 12-month revenue
528Active ASINs
+24.1%Revenue growth, trailing 12 mo
−17.1%Revenue change, month-over-month
4.51★339,990 reviews — trust is not the barrier
What the data is telling us
01
Category-dependent, not category-wide
#1 in retractable ballpoint pens, its largest category, but #6 in general ballpoint pens and #9 in highlighters.
02
A strong year, a stalled quarter
+24.1% over the trailing 12 months, but −17.1% month-over-month. Momentum has cooled across nearly every category.
03
Reseller concentration risk
Two sellers control ~85% of Zebra revenue, with a long tail of 48+ smaller and unauthorised sellers.
04
Highlighters bleed ad budget
Zebra spends near BIC-level ad share while holding a fifth of BIC’s category share — the clearest inefficiency in the portfolio.
05
The brand is losing its own word
“Mildliner” now out-searches “Zebra Mildliner” — demand is genericising, and copycats are positioned to intercept it.
02Brand snapshot — UK
The brand at a glance
Monthly revenue (est.)£149,311
Trailing 12-month revenue£2,892,374
Monthly units sold41,711
Active ASINs528
Average price£13.25
Avg sellers per ASIN3.26
Review rating4.51★
Brand Score7.6 / 10
12-month growth+24.1%
Month-over-month growth−17.1%
Reseller concentration is the headline risk
Zebra runs a storefront on Amazon UK but has no single-seller lock on its own listings. A single seller controls 63.2% of brand revenue and the top two control ~85% — third parties are actively reselling alongside, or instead of, any authorised presence. That is a direct lever on price integrity and buy-box control.
Figures are SmartScout modelled estimates for the UK marketplace, July 2026 — not confirmed Amazon sales data.
03Market position by subcategory
Seven categories, three that matter
The top three subcategories account for ~89% of Zebra's UK revenue. Every core category except mechanical pencils lost share month-over-month.
Subcategory
Monthly revenue
Market share
MoM revenue
Retractable Ballpoint Pens· Rank #1
£94,491
12.10%
−£17,398
Ballpoint Pens· Rank #6
£28,056
4.34%
−£10,376
Highlighters· Rank #9
£7,836
2.10%
−£4,905
Gel Ink Rollerball Pens
£4,861
0.55%
−£7,736
Fountain Pens
£2,741
0.79%
−£1,783
Mechanical Pencils· gaining share
£2,635
1.10%
−£347
Ballpoint / Fountain / Pencil Sets· single ASIN
£68
17.51%
−£420
Read this carefully
The Sets row shows a large share swing but is a single ASIN — statistically noisy, not a trend. Mechanical pencils is the only category gaining share, but inside a rapidly shrinking search market. The real story sits in the top three revenue categories on the next pages.
04Competitive landscape — top 3
Where Zebra wins, and where it is exposed
Retractable Ballpoint PensZebra’s stronghold
#1
Zebra Pen
£94,491−0.05
BIC
£78,169+0.57
Parker
£46,866−0.25
Chipate
£32,908+3.15
Paper Mate
£22,816+0.04
Cross
£22,502−0.21
Ballpoint PensWeakest major category
#6
BIC
£89,584−1.30
Parker
£80,999+3.02
Paper Mate
£56,798−1.44
Eziglide
£39,522−0.37
Yoosso
£33,192+2.24
Zebra Pen
£28,056−1.44
HighlightersDisproportionate ad spend
#9
STABILO
£86,016ad 10.8%
STAEDTLER
£39,948ad n/a
BIC
£39,762ad 23.2%
Amazon Basics
£27,496ad n/a
Crayola
£18,577ad n/a
Zebra Pen
£7,836ad 12.3%
05Reseller & distribution
Two sellers control 85% of the brand
A concentrated top plus a long tail of 40+ small sellers is the classic footprint of unauthorised, grey-market resale — a common source of price erosion and diluted brand experience.
This concentration-plus-long-tail pattern is a strong basis for a MAP enforcement and seller-consolidation programme — regaining buy-box control, stabilising price, and consolidating revenue behind an authorised presence.
06Keyword & demand signals
Demand is genericising away from the brand
"Mildliner" now out-searches "Zebra Mildliner"
"mildliner" (generic)
4,538/mo
"zebra mildliner"
3,560/mo
15 brands compete for the generic term versus 10 on the branded one. If Zebra isn't bidding on the generic term, competitors and dupes intercept that demand.
Category terms mapped to Zebra's footprint
Search term
Searches/mo
12-mo trend
Zebra position
"ballpoint pen"
9,568
+2,093
#6 · 4.3% share
"gel pen"
11,137
−937
Not top-3 for Zebra
"rollerball pen"
3,951
−1,214
0.55% share
"highlighter pens"
16,465
+1,016
#9 · 2.1% share
"fountain pen"
56,991
−12,220
0.79% share
"mechanical pencil"
66,798
−7,517
1.1% share, gaining
"Ballpoint pen" (9,568/mo, 29 fragmented brands, no dominant owner) is a clear PPC opening given Zebra's #1 in retractables. Fountain pens and mechanical pencils carry the biggest volume but are in the steepest decline of any term measured — low-reward for growth investment.
07Strengths, weaknesses & opportunities
The honest picture
Strengths
Category leadership in retractable ballpoint pens — £94K/mo, #1 by revenue
Strong review base and rating — 4.51★ across 340K reviews. Trust is not the barrier
Recognised product line (Mildliner) with standalone search demand
Weaknesses
Weak in broader ballpoint pens despite the largest catalogue there (166 ASINs)
Highlighter ad spend is disproportionate to the share it returns
High reseller concentration (2 sellers = 85%) plus an unauthorised long tail
Recent MoM softness across nearly every category
Opportunities — where we go to work
1Defend & expand the retractable lead — audit pricing and conversion at ASIN level as Chipate moves fast.
2Reallocate highlighter ad spend — cut to match realistic share, or fix listing quality and commit.
3Capture the generic "mildliner" term — a direct, low-effort keyword and PPC win.
4Consolidate the reseller base — open a MAP enforcement and seller-monitoring conversation.
5Test the "ballpoint pen" mega-keyword — 9,568/mo, no dominant owner, fragmented field.
6Don’t over-invest in fountain pens or mechanical pencils — huge but fast-declining demand.
Why partner with us
Your growth partner on Amazon
Zebra's brand strength is not in question — a 4.51★ rating across 340K reviews proves the trust is there. The gap is execution: category-level defence, ad efficiency, keyword ownership and distribution control. That is exactly the work we do.
Weeks 1–2Full account audit
ASIN-level pricing, buy-box, and listing health across all seven categories.
Weeks 3–4Distribution control
Map the reseller base and stand up a MAP enforcement plan.
Month 2PPC & keyword ownership
Reclaim "mildliner" and test the "ballpoint pen" mega-term.
OngoingDefend & grow
Protect the retractable lead; monthly share and efficiency reporting.
Brand search, subcategory market share and rankings, seller and offer data, search term volumes and trends, product research.
Go Deeper
Which of these opportunities pays back fastest in the first 90 days
Map every seller on the brand's listings and rank them by revenue and offer count
Show me the branded versus generic search split over 24 months
Build the same analysis for [SECOND PROSPECT] before next week
Where It Gets Soft
Seller data shows offer patterns, not authorisation status. A concentrated top plus a long tail is consistent with grey-market resale, but it is a hypothesis to raise with the brand, not a finding to assert. Keep that framing in a pitch. Revenue and share are modelled estimates rather than confirmed Amazon sales, and this one runs on the UK marketplace, so figures are thinner than US equivalents. Single-ASIN categories swing hard month to month and should be read as noise until a second month agrees.
Turn a Revenue Decline Into a Cold Email That Gets a Reply
Most entries here are single prompts. This one is a repeatable workflow our outbound team runs daily, packaged as two Claude skills that pull live SmartScout data before writing anything.
What It Does
Give it a name, a title, and a company. It searches SmartScout for the strongest divergent signal on that brand, then writes the email around that signal instead of around a pitch.
Divergent is the operative word. A prospect's own top-line revenue is not a hook, because they already know it. What they usually have not seen is the tension: one line declining while the category grows, a competitor climbing in the same subcategory, ad spend rising without sales following, seller count creeping up, a MAP break, a rank shift.
The angle then gets matched to what the title actually owns. An ecommerce director hears about share loss and reseller exposure. A growth lead hears about ad efficiency. An analytics lead hears about visibility gaps in their own reporting. Same underlying data, different framing.
There are two skills. One handles the cold open with no history to work from. The other handles a prospect who went quiet, and its rule is that the follow-up has to arrive with something the first email did not have. Repeating the ask louder does not count.
What Comes Out
Subject [PRODUCT LINE 1] and [PRODUCT LINE 2] down
Hi [FIRST NAME],
[BRAND]'s [PRODUCT LINE 1] lost $18,240 in Amazon revenue last month and [PRODUCT LINE 2] lost $26,910, two lines that haven't come up as headline numbers before but add up to just over $45,000 gone in a single month.
SmartScout tracks revenue and units across every subcategory, so smaller declines like these show up before they get lost inside one blended brand total.
Do you have 20 minutes Thursday at 1pm or Friday at 9am Mountain to walk through where it's concentrated?
Best, Brett
No greeting windup, no platform paragraph, no feature list. The observation opens the email, one line explains why it matters to that seat, and the ask names two specific times.
Why It Works
The subcategory split is the whole trick. Rolled up to one brand total, two declines like these disappear inside a number that looks flat. Split by line, they are a $45,000 hole in a single month, which is specific enough that a stranger reads past the first sentence.
The skills also enforce a writing standard: no colons anywhere including the subject, five words maximum on the subject line, no template jargon, and a banned-phrase list for constructions that read as machine-written no matter what data sits behind them. The bar is that it should read like it was typed between two calls.
Results
Six of our top targets have booked calls off this workflow, together representing roughly $481M/yr in Amazon revenue.
Where It Gets Soft
Revenue and unit figures are estimates, so quote the direction and the rough magnitude rather than presenting a number to the dollar as fact. Parent company names often return nothing, so search the consumer-facing brand instead. And when no divergent signal exists, the honest move is a plain line about what the data covers. A forced hook reads worse than no hook.
Should We Buy This Brand, and What Would We Do With It?
Preview
Using SmartScout and Amazon data, pressure-test Vital Pet Life as an acquisition target and give me a go / no-go view plus the value-creation plan if we buy.
Don't use the Amazon in stock rate metric at all during this analysis
First, establish the baseline:
Trailing-12-mo and monthly revenue, unit velocity, MoM & 12-mo growth.
The 2–3 subcategories where revenue concentrates, and top competing brands in each by revenue (with their share and momentum).
Pull the top ~75 ASINs and quantify revenue concentration (top-5 and top-10 ASIN share of tracked revenue).
Then assess the four things an acquirer underwrites:
REVENUE QUALITY & DURABILITY
Is growth broad-based or dependent on 1–2 hero ASINs / one subcategory?
Search-demand trend for the brand's core terms (growing, flat, fading?).
Seasonality, and any recent step-changes (launches, one-time spikes).
MOAT & DEFENSIBILITY
Review moat (count, rating, velocity) vs. top competitors.
Rank & buy-box stability; is the brand the sole/primary seller?
Share trend vs. competitors — gaining or bleeding.
RISK / RED FLAGS (the reasons to walk)
ASIN or subcategory concentration; single-point-of-failure SKUs.
Catalog/Expansion: adjacent subcategories, new price bands, fast-growing segments the brand is underweight in, international.
Size each lever's plausibility and rough impact where the data allows.
Deliver:
A one-paragraph VERDICT up top: acquire / pass / conditional, with the 2–3 factors driving it and what would change the answer.
An executive summary of the 3–4 most decisive findings.
Sections for Revenue Quality, Moat, Risks, and Value-Creation Levers.
A simple "underwriting scorecard" (Quality / Moat / Risk / Upside, each High-Med-Low) and the levers ranked by impact-vs-effort.
No length limit — build it out as a full report or deck, not one slide.
Include supporting visuals for the key findings. Flag that all figures are SmartScout estimates and month-to-month swings can be promo-driven.
Two details worth copying. The second line tells it to ignore a specific metric, which works and is the fastest way to keep an analysis off a number you do not trust. And asking for a verdict plus "what would change the answer" is what turns a data dump into something an investment committee can act on.
What You Get Back
A full underwriting report with a conditional lean-buy verdict up front. The decisive finding is that a $10.6M brand is really one listing wearing a brand's clothing: the 64oz fish oil ASIN is roughly 60% of revenue and the top two are 91%, across only nine total ASINs. The brand is down 11% year over year while its subcategory grows 12%, so it is donating share to Native Pet and Nutramax. What you would actually be buying is a review moat and buy-box control, sole seller on every ASIN with about 37,000 reviews at 4.5 stars.
The search-term work is the part that changes the deal. The brand's number one term, salmon oil for dogs, is down 26% year over year, while its hero SKU rides fish oil for dogs, up 12%. Consumer language is shifting underneath the catalog.
Preview
Acquisition Underwriting · Amazon Brand Diligence
Vital Pet Life
A pressure-test of the fish-oil-for-dogs brand as an acquisition target — revenue quality, moat, red flags, and the value-creation plan if we own it.
CategoryDog Fish Oil Supplements
Trailing 12-mo revenue~$10.6M
Category rank#6 of 311 brands
PreparedJul 2026 · SmartScout
RecommendationConditional — lean buy
Analysis brief · verbatim request
What was run to produce this
For transparency on scope and method, this is the exact instruction used to generate the diligence below. It was executed live against SmartScout and Amazon marketplace data — no figures were hand-picked; every metric is pulled from the brand, subcategory, product, and search-term APIs.
Prompt · Vital Pet Life acquisition pressure-test
Using SmartScout and Amazon data, pressure-test Vital Pet Life as an acquisition
target and give me a go / no-go view plus the value-creation plan if we buy.
Don't use the Amazon in stock rate metric at all during this analysis

First, establish the baseline:
  • Trailing-12-mo and monthly revenue, unit velocity, MoM & 12-mo growth.
  • The 2–3 subcategories where revenue concentrates, and top competing
    brands in each by revenue (with their share and momentum).
  • Pull the top ~75 ASINs and quantify revenue concentration (top-5 and
    top-10 ASIN share of tracked revenue).

Then assess the four things an acquirer underwrites:
  1. REVENUE QUALITY & DURABILITY
     - Is growth broad-based or dependent on 1–2 hero ASINs / one subcategory?
     - Search-demand trend for the brand's core terms (growing, flat, fading?).
     - Seasonality, and any recent step-changes (launches, one-time spikes).
  2. MOAT & DEFENSIBILITY
     - Review moat (count, rating, velocity) vs. top competitors.
     - Rank & buy-box stability; is the brand the sole/primary seller?
     - Share trend vs. competitors — gaining or bleeding.
  3. RISK / RED FLAGS (the reasons to walk)
     - ASIN or subcategory concentration; single-point-of-failure SKUs.
     - Buy-box suppression, hijackers, 3P sellers, out-of-stock exposure.
     - Declining review velocity, rating erosion, price/margin compression,
       rising competitive intensity, or a shrinking category.
  4. VALUE-CREATION LEVERS (upside if we own it)
     Organize under Content, Pricing, Advertising, and Catalog/Expansion:
     - Content: variation consolidation, A+/listing gaps, suppressed listings,
       weak titles, storefront.
     - Pricing: price-band gaps, trade-up ladders, buy-box/margin recovery,
       under- vs. over-priced vs. category and vs. own catalog.
     - Advertising: ad-spend share vs. market share, branded-term whitespace,
       under-indexed high-volume terms.
     - Catalog/Expansion: adjacent subcategories, new price bands, fast-growing
       segments the brand is underweight in, international.
     Size each lever's plausibility and rough impact where the data allows.

Deliver:
  • A one-paragraph VERDICT up top: acquire / pass / conditional, with the
    2–3 factors driving it and what would change the answer.
  • An executive summary of the 3–4 most decisive findings.
  • Sections for Revenue Quality, Moat, Risks, and Value-Creation Levers.
  • A simple "underwriting scorecard" (Quality / Moat / Risk / Upside, each
    High-Med-Low) and the levers ranked by impact-vs-effort.
No length limit — build it out as a full report or deck, not one slide.
Include supporting visuals for the key findings. Flag that all figures are
SmartScout estimates and month-to-month swings can be promo-driven.
Data sources: SmartScout brand / subcategory / product / search-term & Ad-Spy APIsMarketplace: Amazon USExcluded by request: Amazon in-stock-rate metric
V
The verdict
Conditional — lean acquire, but only at a price that underwrites a declining, hyper-concentrated cash cow, not a growth story.
Vital Pet Life is a clean, high-margin, brand-controlled asset sitting on a deep review moat — but it is a single-ASIN business in disguise, and it is quietly losing share in a category that is otherwise growing. Three factors drive the call:
Concentration is the whole thesis
One SKU (the 64 oz fish oil) is ~60% of revenue; the top two are ~91%. Nine total listings, five that matter. The entire investment is really an underwrite of one listing's durability.
Declining brand, growing category
Brand is −11% YoY while the subcategory is +12%. Native Pet, Nutramax and Pet Honesty are taking the share Vital Pet Life is donating. This is a fixable trajectory — but it is real.
Clean asset, clear levers
Sole seller on every ASIN, stable buy box, 4.5–4.6★ on ~37K reviews. Pricing, content, a cat line, and adjacency demand are all un-pulled. The upside is operator-dependent but concrete.
What would change the answer. A no-go if the seller prices it as a growth asset, or if diligence surfaces fragility in the hero listing — supply/co-pack single-source, trademark/IP gaps, review authenticity, or a variation restructure that could vaporize the 29K-review anchor. A firmer go if the hero ASIN's supply and IP are clean and transferable, DTC (vitalpetlife.com) adds a second channel of scale, and we have an operator lined up to execute the levers in year one.
All revenue, unit, share and search figures are SmartScout estimates. Month-to-month swings are frequently promo- or deal-driven and should not be read as trend on their own. The Amazon in-stock-rate metric was deliberately excluded from this analysis.
E
Executive summary — the decisive findings
The business is one listing wearing a brand's clothing
The 64 oz "Fish Oil for Dogs" ASIN did ~$6.36M of the brand's ~$10.6M trailing-12 (≈60%). Add the 32 oz salmon oil (~$3.31M) and two SKUs are ~91% of everything. There is no "top-75 ASIN" tail to analyze — the brand lists only nine ASINs. Single-point-of-failure risk is the dominant fact of this deal.
Share is bleeding into a rising tide
Category revenue is growing ~12% YoY; Vital Pet Life is −11%. It holds ~6% share (#6 of 311) but is one of the only top brands losing revenue month-over-month, while Native Pet (+$488K/mo), Nutramax and Bark&Spark gain. The brand is a share donor in a market that rewards format innovation and marketing muscle it currently lacks.
Its biggest search term is fading — but its hero rides a growing one
"Salmon oil for dogs" (the brand's #1 term) is down ~26% YoY, and the salmon SKUs that depend on it are exactly the ones eroding. But the hero's term, "fish oil for dogs," is up ~12% and the hero ASIN is essentially flat. Consumer language is shifting salmon→fish-oil/omega-3; the acquisition works only if we lean into the growing framing.
What you're actually buying is a review moat and buy-box control
Sole seller on all ASINs, buy box held at $49.95 / $34.95 unchanged for two years, ~37K reviews at 4.5–4.6★ on the two hero listings. That's a durable, transferable asset a new entrant can't replicate quickly — and it's the foundation the value-creation plan builds on.
01
Baseline
Scale, velocity, and where the money actually comes from.
$10.6M
Trailing-12 revenue (est.)
$628K
Latest monthly revenue
−8%
Revenue MoM
−11%
Revenue 12-mo
~19K
Units / month
9
Total ASINs (5 meaningful)
1.0
Sellers per ASIN — sole seller
4.48★
Brand avg rating
Weekly revenue, two years
Gentle erosion, not collapse — a flat hero masking a shrinking tail. Seasonal dips are promo/Prime-driven.
Where revenue concentrates: one subcategory, one SKU
~99% of tracked revenue sits in Dog Fish Oil Supplements; the remaining ~1% is scattered across a few adjacent pet-supplement subcategories and is rounding error. There is effectively no subcategory diversification to speak of — the "2–3 subcategories" the brand spans are one subcategory plus noise. Within it, the hero 64 oz fish oil and the 32 oz salmon oil carry the business; the 16 oz and 8 oz salmon SKUs are small and shrinking.
Competitive set — Dog Fish Oil Supplements ($9.9M/mo, 311 brands)
Monthly market share. Bars mark momentum: gaining, losing, flat. Vital Pet Life sits mid-pack and is sliding.
Top competitors by revenue and momentum: Zesty Paws 18% (declining leader), Native Pet 12% (surging, +$488K/mo), Nordic Naturals 10%, Nutramax 8% (+, highest ad spend), Natural Dog Company 7%. Vital Pet Life 6% and losing ~$66K/mo.
02
Revenue quality & durability
Is the revenue broad-based and durable, or one listing away from a step-change?
Not broad-based. Growth and decline both trace to a handful of SKUs. The hero 64 oz is roughly flat (−0.6% TTM) and rides a growing query. The 32 oz salmon oil is down ~10% TTM (−$345K), and the smaller salmon SKUs have lost 50–60% of their units over two years. So the brand's decline is really salmon-line erosion partly offset by a stable hero.
Demand is diverging under the brand's feet. The single largest search term, "salmon oil for dogs" (~72K/mo), is down ~26% YoY. Meanwhile "fish oil for dogs" (~63K/mo) — where the hero ranks #2 organically — is up ~12%. Consumer language is migrating from "salmon oil" toward "fish oil / omega-3." Two of the brand's ASINs are positioned on the fading term.
Seasonality & step-changes. Mild seasonal lift late summer/early fall (shedding and skin-allergy season) and around Prime events; the sharp single-week dips are promo cadence, not trend. No evidence of a one-time spike propping up the trailing-12 — the base is real and recurring, which is good for durability of the floor even as the ceiling drifts down.
Demand divergence — YoY search growth
The category and the hero's term are growing; the brand's flagship "salmon" term is not.
Durable
Recurring, subscription-friendly consumable. Hero ASIN listed since 2021, sits top-15 in subcategory, rides a growing term. Deep reviews defend the floor.
Watch
No branded search demand — buyers search the category, not the brand. Revenue is discovery-driven, so it lives and dies by organic rank and ads, not loyalty.
Fragile
60% of revenue on one listing tied to one co-pack and one buy box. Any rank suppression, supply gap, or variation misstep on that ASIN is a company-level event.
03
Moat & defensibility
What stops the next well-funded entrant from taking this shelf?
~37K
Reviews on the two hero listings
4.5–4.6★
Hero ratings
1 seller
On every ASIN — no hijackers, no 3P leakage
2 yrs
Buy box price unchanged & uncontested
Real, and transferable
Review depth. The 32 oz salmon oil carries ~29K reviews and the hero ~8.6K — among the deepest in the category (per-ASIN reviews second only to Zesty Paws). That's years of social proof a challenger can't buy.
Clean ownership. Sole FBA seller on all ASINs, buy box fully controlled, price rock-steady. For an acquirer this is the ideal shape: no gray-market erosion, no MAP wars, no buy-box roulette to inherit.
Organic rank. Hero ranks #2 on "fish oil for dogs," #4 on "salmon oil for dogs," #1 on "dog fish oil supplements." That real estate is the moat's active ingredient.
Thinner than it looks
No brand equity. Competitors own branded demand — thousands of monthly searches for "Zesty Paws," "Native Pet," "Nordic Naturals," "Welactin." Vital Pet Life generates essentially none. The moat is listing-and-review based, not brand-based; it protects the shelf, not the customer.
Format exposure. The brand is liquid-only while the fastest growers (Native Pet, Zesty Paws) win with chews/soft-chews. A format shift is the most credible way a competitor routes around the review moat.
Rank volatility. The hero bounces between ~800 and ~1,050 with brief spikes past 1,200 — healthy but not fortress-like; it must be defended with spend.
Net: a medium moat. Strong enough to protect a stable cash flow for years; not strong enough to assume the brand compounds on its own. It buys time to execute, not a pass on execution.
04
Risks & red flags — the reasons to walk
Ranked by how much each could impair the thesis.
Severity: critical
1 · Single-point-of-failure catalog
60% of revenue on one ASIN, 91% on two, one subcategory at 99%, nine SKUs total. There is no diversification cushion. A listing suppression, ingredient/supply disruption, or a botched variation change on the hero is an existential event, not a bad quarter. This alone caps the multiple you should pay.
Severity: high
2 · Losing share in a growing category
−11% brand vs +12% category. The share is moving to better-marketed, chew-format rivals. Absent intervention, the trajectory continues — you'd be buying a melting (slowly) ice cube unless the levers are executed.
Severity: medium
3 · Positioning tied to a fading query
"Salmon oil for dogs" −26% YoY drags two SKUs. The fix (re-SEO toward "fish oil / omega-3") is cheap, but the exposure is real today and the salmon line will keep eroding until it's addressed.
Severity: medium
4 · No brand pull + format gap
Zero meaningful branded search and a liquid-only lineup while the category shifts to chews. The brand competes purely on shelf position, which must be rented with ads at $5–$10 CPCs.
Severity: low / clean
5 · Buy box & sellers — no issue found
No hijackers, no buy-box suppression signal, no 3P sellers competing on-listing, no price war. Two years of stable, uncontested buy box. A rare clean bill on the usual Amazon landmines.
Severity: diligence item
6 · Confirm in diligence
Co-pack/supply single-sourcing on the hero; trademark & listing ownership; review authenticity; DTC channel size and profitability; and whether the 32 oz variation family is structurally stable (its review anchor is worth protecting).
05
Value-creation levers — the upside if we own it
Organized by Content, Pricing, Advertising, and Catalog/Expansion, with rough sizing where the data supports it.
Content
Fix the hero listing. The 64 oz page scores 7.8 while the 32 oz sibling scores 9.0 — lift title, A+, and imagery to match. On a $6.36M ASIN, a ~5% conversion gain is ~$300K.
Re-SEO the salmon SKUs toward "fish oil / omega-3" framing to arrest the −26% term decline.
Storefront + adjacency copy for skin/itch/allergy/shedding use-cases the product solves but doesn't rank for.
Pricing
Raise the hero. $49.95 held for two years; brand avg $27.95 sits below premium peers ($37–$43). A modest +6% with sole-seller control likely holds → ~$300–380K near-pure margin.
Premium "wild Alaskan" tier — high-intent term, 46% top-3 conversion, $9.79 CPC; a trade-up SKU captures willingness-to-pay the value line leaves behind.
Subscribe & Save + bundles to lift LTV and stabilize the eroding SKUs.
Advertising
Under-indexed on spend (~5% ad share vs 6% market share) in a category where the top-3 capture only ~21–30% of conversions — it's winnable, if CPCs ($5–$6 head, up to $10) are managed.
Adjacency whitespace — itch/allergy/shedding/coconut-oil terms where the hero sits rank 30–45 organically.
Catalog / Expansion
Dedicated cat line. The brand already ranks #2–3 on "salmon oil for cats" (23K), "fish oil for cats" (14K), "omega-3 for cats" (15K) with no cat-specific listing. A purpose-built cat SKU could add $0.5–1M+.
Soft-chew format — the biggest strategic bet and the category's growth engine (Native Pet). Highest effort/capex; builds a second moat.
Spanish-language listing — "aceite de salmón para perros" ~8K/mo, low-effort capture.
Impact vs. effort
Bubble number = priority rank. Start upper-left: content and pricing are near-free and land fast; the cat line is the biggest defensible add; soft-chews are the high-cost strategic bet.
STRATEGIC BETSQUICK WINSLOW PRIORITYImpact ↑Effort — lowEffort — high →
1
Hero listing / content fix
2
Hero price +6% & margin recovery
3
Dedicated cat line
4
Adjacency + conquest PPC/SEO
7
Soft-chew format line
5
Re-SEO salmon SKUs + Subscribe&Save
6
Spanish-language listing
Levers ranked — impact vs. effort
#
Lever
Impact
Effort
Rough size
1
Hero content / listing fix
High
Low
~$300K
2
Hero price +6% & margin recovery
High
Low
~$300–380K
3
Dedicated cat line
High
Med
$0.5–1M+
4
Adjacency + conquest advertising
Med
Med
$0.2–0.5M
5
Re-SEO salmon SKUs + Subscribe&Save
Med
Low
Defensive
6
Spanish-language listing
Low–Med
Low
~$0.1M
7
Soft-chew format line
High
High
Strategic / new moat
Sizes are directional order-of-magnitude estimates from SmartScout demand and revenue data, not a model. The first two levers are near-free and could plausibly offset the current decline on their own; levers 3 and 7 are what turn a stabilized cash cow into a growth story.
S
Underwriting scorecard
Revenue quality
Low–Med
Recurring & real, but declining and undiversified. Floor is solid; ceiling is drifting down.
Moat
Medium
Deep reviews + sole-seller buy-box control. No brand equity; format-flanked.
Risk
High
Concentration + share loss. High risk = discipline on price, not a walk on its own.
Upside
Med–High
Several concrete, ownable levers. Operator-dependent, but the roadmap is clear.
Underwriting stance. Buy on SDE/EBITDA with a concentration discount, not on peak or headline revenue. Price the −11% trajectory into the base case and treat the levers as upside you earn, not value you pay for. If the hero ASIN's supply and IP clear diligence and DTC adds real scale, this is an attractive, cash-generative tuck-in with a credible path back to growth. If it's priced as a grower, pass.
Data It Touches
Brand search, market share and subcategory competitive sets, product research at the ASIN level, search term history, ad spy.
Go Deeper
Rank the value-creation levers by impact against effort in year one
Show me the review velocity trend against the top three competitors
What is the cat-line adjacency worth if we launch into it
Run the same pressure test on [SECOND CANDIDATE] so I can compare
Where It Gets Soft
Revenue, unit, share, and search figures are estimates. Month-to-month swings are often promo or deal driven and should not be read as trend on their own. The prompt asked for the top 75 ASINs and the brand only lists nine, which the analysis handled fine, but it is a reminder that a template written for a big catalog needs a sanity check on a small one.
Find Acquisition Candidates in Pet Supplements
Preview
Using SmartScout and Amazon data, build me a shortlist of acquisition targets that fit this thesis:
Category / niche: pet supplements
Revenue band: $3M–$25M trailing-12-mo
Growth: flat-to-positive 12-mo; not collapsing
Ownership signal: prefer single-seller / high own-buy-box brands (clean cap table, not a reseller free-for-all)
Anything to exclude: heavy seasonality, sub-4.2 stars
Screen the brand universe on SmartScout and return a RANKED shortlist of 10–15 candidates. For each, pull and reason over:
Size & trajectory — trailing-12-mo revenue, monthly run-rate, MoM and 12-mo growth, and whether growth is broad or one-ASIN-driven.
Ownership cleanliness — # sellers per ASIN, FBA seller count, buy-box control / suppression, single-seller flag. Flag brands where 3P sellers or hijackers hold the buy box (messy to acquire).
Moat — review count & rating, review velocity, rank stability, brand score, and how concentrated revenue is (top-5 ASIN share, subcategory count).
Fit-to-thesis score (1–5) with a one-line "why this could be a good buy" and the single biggest red flag.
Organize output as:
A ranked table (rank, brand, category, rev, growth, #sellers, rating, top-ASIN concentration, fit score).
A short "top 3 to prioritize" write-up with the deal angle for each.
A "screened out / watch" list with the disqualifying reason.
Lead with a 3–4 bullet read on where the best opportunities cluster in this thesis and why. Multi-section report is fine — no length limit. Include supporting visuals (concentration, growth, competitive-intensity) where they sharpen the point. Note that all figures are SmartScout estimates.
What You Get Back
A full screen of roughly 2,300 brands across the dog, cat, and horse supplement nodes, narrowed to the 25 sitting inside the revenue band and the 13 that clear the thesis. Ranked table, a growth-versus-concentration scatter, competitive intensity bars, three prioritized targets with deal angles and red flags, plus a watch list and screened-out list with reasons.
Pet supplements: a ranked shortlist of buy-side targets
A brand-level screen of the Amazon pet-supplement universe against a single-owner, clean-buy-box, durable-growth thesis. From ~2,300 brands across the dog, cat, and horse supplement nodes, 25 sit inside the revenue band; 13 clear the bar.
Niche
Pet supplements
Rev band (TTM)
$3M – $25M
Growth
Flat-to-positive
Ownership
Single-seller / own BB
Exclude
Seasonal · <4.2★
01
Where the opportunity clusters
Four reads on the shape of the deal set before the individual names.
Read 01 · Ownership is not the constraint
Buy-box control is table stakes here — durability is the real filter
~20 of the 25 in-band brands run ≤1.3 sellers per listing with Amazon off the listing (in-stock-rate ≈ 0), so clean cap tables are the norm, not the exception. The differentiator that actually separates targets is growth durability and SKU concentration — not whether a hijacker holds the buy box.
Read 02 · Two distinct profiles
Stable "franchise" brands vs. hero-SKU rockets
The top of the board splits cleanly: (a) scaled, single-owner franchises anchored by a branded hero line — Bernie's Perfect Poop, Wholistic's organic vitamins, Revival — compounding ~8–13%; and (b) fast movers riding a format/ingredient wave (chews +96%, liquid collagen +122%, functional mushrooms +570–740%) where concentration and a <2-year track record are the tax on the upside.
Read 03 · Format & ingredient tailwinds
Soft chews, liquid omega/collagen, functional mushrooms are pulling the category
The dog fish-oil node ($131M TTM, +12%) and dog herbal node ($76M TTM, +45%) are both larger and faster than powder multivitamins. Cat supplements ($82M TTM, +41%) are an under-shopped adjacency. Category revenue is ~78% seller-owned (not Amazon), which is exactly what you want when buying independent brands.
Read 04 · Risk-adjusted takeaway
Buy the broad-catalog compounders; option-value the rockets
The cleanest risk-adjusted entries pair single ownership with broad SKU spread and a review moat — Chew + Heal, Wholistic, Revival, Rx Vitamins. The highest-return / highest-variance entries are the sub-two-year, single-hero spikes (Pets Are Kids Too, Petsology, SalutemPet). Size those as options, not as the core of a roll-up.
02
The opportunity map
Every candidate carries the same tension: growth on one axis, single-SKU concentration risk on the other. Bubble area is TTM revenue; color is fit-to-thesis. The sweet spot is upper-right — growing and broad.
Fit 5Fit 4Fit 3○ bubble = TTM revenue*Petsology +570% plotted at right edge
Competitive intensity
Avg. sellers per listing. ~1.0 = clean single-seller / own buy-box. Screened-out names shown for contrast.
VetSmart
0.82
Rx Vitamins
0.85
GoodGrowlies
0.89
Tomlyn
0.91
Wonder Paws
0.94
Revival
0.96
Chew + Heal
0.93
Wholistic
1.05
Four Leaf Rover
1.15
Petsmont
1.20
Bernie's
1.57
HomeoPet
2.42
Vet Classics
2.38
Grizzly ✕
3.36
Ceva ✕
5.60
✕ = screened out on ownership. 3P sellers on the listing make the buy box (and the deal) messy.
03
Ranked shortlist
13 brands clearing the thesis, ranked on a blend of clean ownership, durable (broad) growth, size, moat, and low single-SKU concentration. Fit 1–5. All figures SmartScout estimates; run-rate = latest monthly revenue.
#
Brand
TTM rev
Run-rate/mo
MoM
12-mo
Sellers/listing
Rating
Reviews
Brand score
Top-ASIN conc.
Fit
1
Bernie'sDog digestive
$16.5M
$1.00M
−8%
+13%
1.6 (1 FBA)
4.41
15,770
8.4
~48% hero line
5
2
Chew + Heal LabsDog fish oil
$11.8M
$984K
−1%
+96%
0.9 (0.9 FBA)
4.28
28,834
8.2
Low · 128 SKUs
5
3
Wholistic Pet OrganicsDog multivitamin
$5.6M
$467K
~0%
+13%
1.1 (1 FBA)
4.44
10,536
8.9
Low · 59 SKUs
5
4
Wonder PawsDog fish oil / collagen
$7.5M
$567K
−20%
+122%
0.9 (0.9 FBA)
4.34
17,417
8.2
~26% collagen hero
4
5
Revival Animal HealthDog multivitamin
$5.8M
$363K
−5%
+8%
1.0 (0.7 FBA)
4.47
25,814
8.4
Low · 80 SKUs
4
6
VetSmart FormulasDog herbal
$4.4M
$238K
−2%
+52%
0.8 (0.6 FBA)
4.30
5,428
7.7
Mod · 11 SKUs
4
7
Four Leaf RoverDog herbal · DTC-native
$4.6M
$312K
−10%
+24%
1.2 (1 FBA)
4.27
6,330
8.8
Mod · 26 SKUs
4
8
TomlynDog multivitamin · legacy
$4.5M
$359K
+2%
+13%
0.9 (0.9 FBA)
4.40
34,578
8.1
Mod
4
9
PetsmontDog herbal
$4.8M
$311K
−17%
+39%
1.2 (1 FBA)
4.26
4,059
8.4
High · 5 SKUs
3
10
PetsologyMultivitamin
$5.1M
$620K
+8%
+570%
0.5 (0.5 FBA)
4.43
11,792
8.3
High · hero spike
3
11
HomeoPetMultivitamin · homeopathic
$5.3M
$320K
−5%
+1%
2.4 (1 FBA)
4.22
85,241
7.9
Low · 45 SKUs
3
12
Rx VitaminsMultivitamin · vet channel
$4.0M
$262K
−7%
+2%
0.9 (0.8 FBA)
4.33
14,559
7.8
Low · 71 SKUs
3
13
GoodGrowliesDog fish oil
$3.9M
$207K
−21%
+18%
0.9 (0.9 FBA)
4.25
19,406
8.3
Mod · 47 SKUs
3
Concentration note: "Hero line" = variations (flavor/size) of one branded parent product. Bernie's ~$656K/mo of its ~$1.0M runs through the Perfect Poop family; Wonder Paws' collagen SKU is ~$165K of ~$567K. Broad names (Chew+Heal, Wholistic, Revival, Rx) spread revenue across dozens of SKUs — materially lower single-point-of-failure risk.
04
Top 3 to prioritize
The three with the best balance of scale, clean ownership, and defensibility — and the specific angle to run on each.
PRIORITY 01Bernie's · Bernie's Best, Inc.
$16.5M
TTM · SmartScout est.
12-mo growth
+13%
Sellers / listing
1–2 · 1 FBA
Rating
4.41★
Hero-line share
~48%
Fit
5 / 5
Deal angle
The largest genuinely-clean target in the band, and the only one already operating as a franchise. The Perfect Poop digestive line (a #3-ranked sub-category product, ~13k reviews at 4.4★, Amazon off the listing) throws off ~$656K/mo and funds three growing adjacencies — dental chews (+16–42%), joint chews, and a new omega line (+182%). You're buying a proven brand engine plus an early, still-cheap product-extension flywheel. Own-buy-box across the catalog means the revenue is real and defensible day one, and the sub-brand naming ("Perfect Poop," "Charming Chompers," "OMG! Omegas") is portable into new formats.
Biggest red flag
~48% of revenue funnels through the single Perfect Poop parent line; the flagship 12.8oz SKU is already down −20% TTM. Diligence must confirm the adjacencies keep compounding, or the whole thesis rests on one digestive product's shelf-life.
PRIORITY 02Chew + Heal Labs · chewandheal.com
$11.8M
TTM · SmartScout est.
12-mo growth
+96%
Sellers / listing
0.9 · 0.9 FBA
Rating
4.28★
Catalog
128 SKUs
Fit
5 / 5
Deal angle
The rare combination of fast (+96% TTM) and broad (128 SKUs, revenue spread across 30+ ASINs even inside one node). This is a scaled, single-seller soft-chew platform with a 28.8k-review moat and near-zero 3P/Amazon presence on its listings — the growth isn't a single lucky SKU, it's a repeatable formulation-and-launch machine riding the chews tailwind. Weekly revenue has held ~$100K in the fish-oil node with a mild uptrend, so the deceleration risk that usually shadows a +96% brand is muted. Best "buy the engine" candidate in the set.
Biggest red flag
The single largest volume driver is a $9.98 chew moving ~2,000+ units/week — great for rank and reviews, thin on margin. Underwrite the blended contribution margin, not the top line; a chunk of the growth may be low-price traffic products subsidizing the catalog.
PRIORITY 03Wholistic Pet Organics · wholisticpetorganics.com
$5.6M
TTM · SmartScout est.
12-mo growth
+13%
Sellers / listing
1.0 · ISR ~0
Rating
4.44★
Brand score
8.9 (top)
Fit
5 / 5
Deal angle
The cleanest, lowest-risk brand on the board — the "quality compounder." Listed since 2013, highest brand score in the set (8.9), 4.44★, and revenue spread across 59 SKUs (mostly size/format variations of a core organic-vitamin line), every one single-seller with Amazon effectively absent. Premium price points ($35–$100) signal real pricing power and a defensible "organic / made-in-USA" positioning that survives category commoditization. Nothing here is riding a fad; it's a durable, margin-friendly base to bolt faster-growing brands onto in a roll-up.
Biggest red flag
Powder multivitamins are the slower-growing corner of the category, and absolute size is modest ($5.6M). This is a platform anchor or margin ballast — not the growth engine of the portfolio. Pay an anchor multiple, not a growth multiple.
05
Watch list & screened out
In-band names held back for a fixable reason (watch), and names disqualified outright on the thesis's hard rules.
Watch softening / re-check next quarter
Natural Dog CompanyDog fish oil · $19.8M · 166k reviews−15% TTM. Biggest in-band brand but off its peak; a value/turnaround angle if it stabilizes.
Vital Pet LifeDog fish oil · $10.6M−11% TTM. Clean single-seller salmon-oil brand in decline — watch for a base.
Vet PromiseMultivitamin · $4.9M−2% TTM. Clean but drifting flat-to-down; borderline on "not collapsing."
planopawsDog fish oil · $4.0M−8% TTM, −8% MoM. Softening on both horizons.
Native Pet · Pet Honesty · Nutramax · Zesty PawsAbove the band$46M / $62M / $100M+ TTM — over the $25M ceiling.
Data It Touches
Brand search, market share and subcategory profiles, product research at the ASIN level for the priority names.
Go Deeper
Pressure test [TOP CANDIDATE] on revenue quality, durability, and value-creation levers
Which of these depend on a single hero product, and how exposed is each one
Show me revenue seasonality over 24 months for the top three
Re-run the screen in [ADJACENT CATEGORY] with the same thesis
Where It Gets Soft
Revenue figures are estimates, so widen your band rather than filtering a real target out at the edges. Top-ASIN concentration is the number to diligence hardest, since it drives the whole risk picture and needs confirming against Seller or Vendor Central before an LOI. Growth rates above roughly 100% usually trace to a single recent SKU launch rather than broad momentum.
AI Prompts to Build an Amazon Prospect List With SmartScout