Native Amazon reports are siloed and revenue-focused, which hides profit problems until they've already cost the client money.
Know the core terms cold: ACoS, TACoS, contribution margin per SKU, AMC, share of voice, and Buy Box.
2026 brought real platform shifts: Rufus retired into Alexa for Shopping, Sponsored Prompts became a billable placement, DSP thresholds dropped, and Prime Day moved to June.
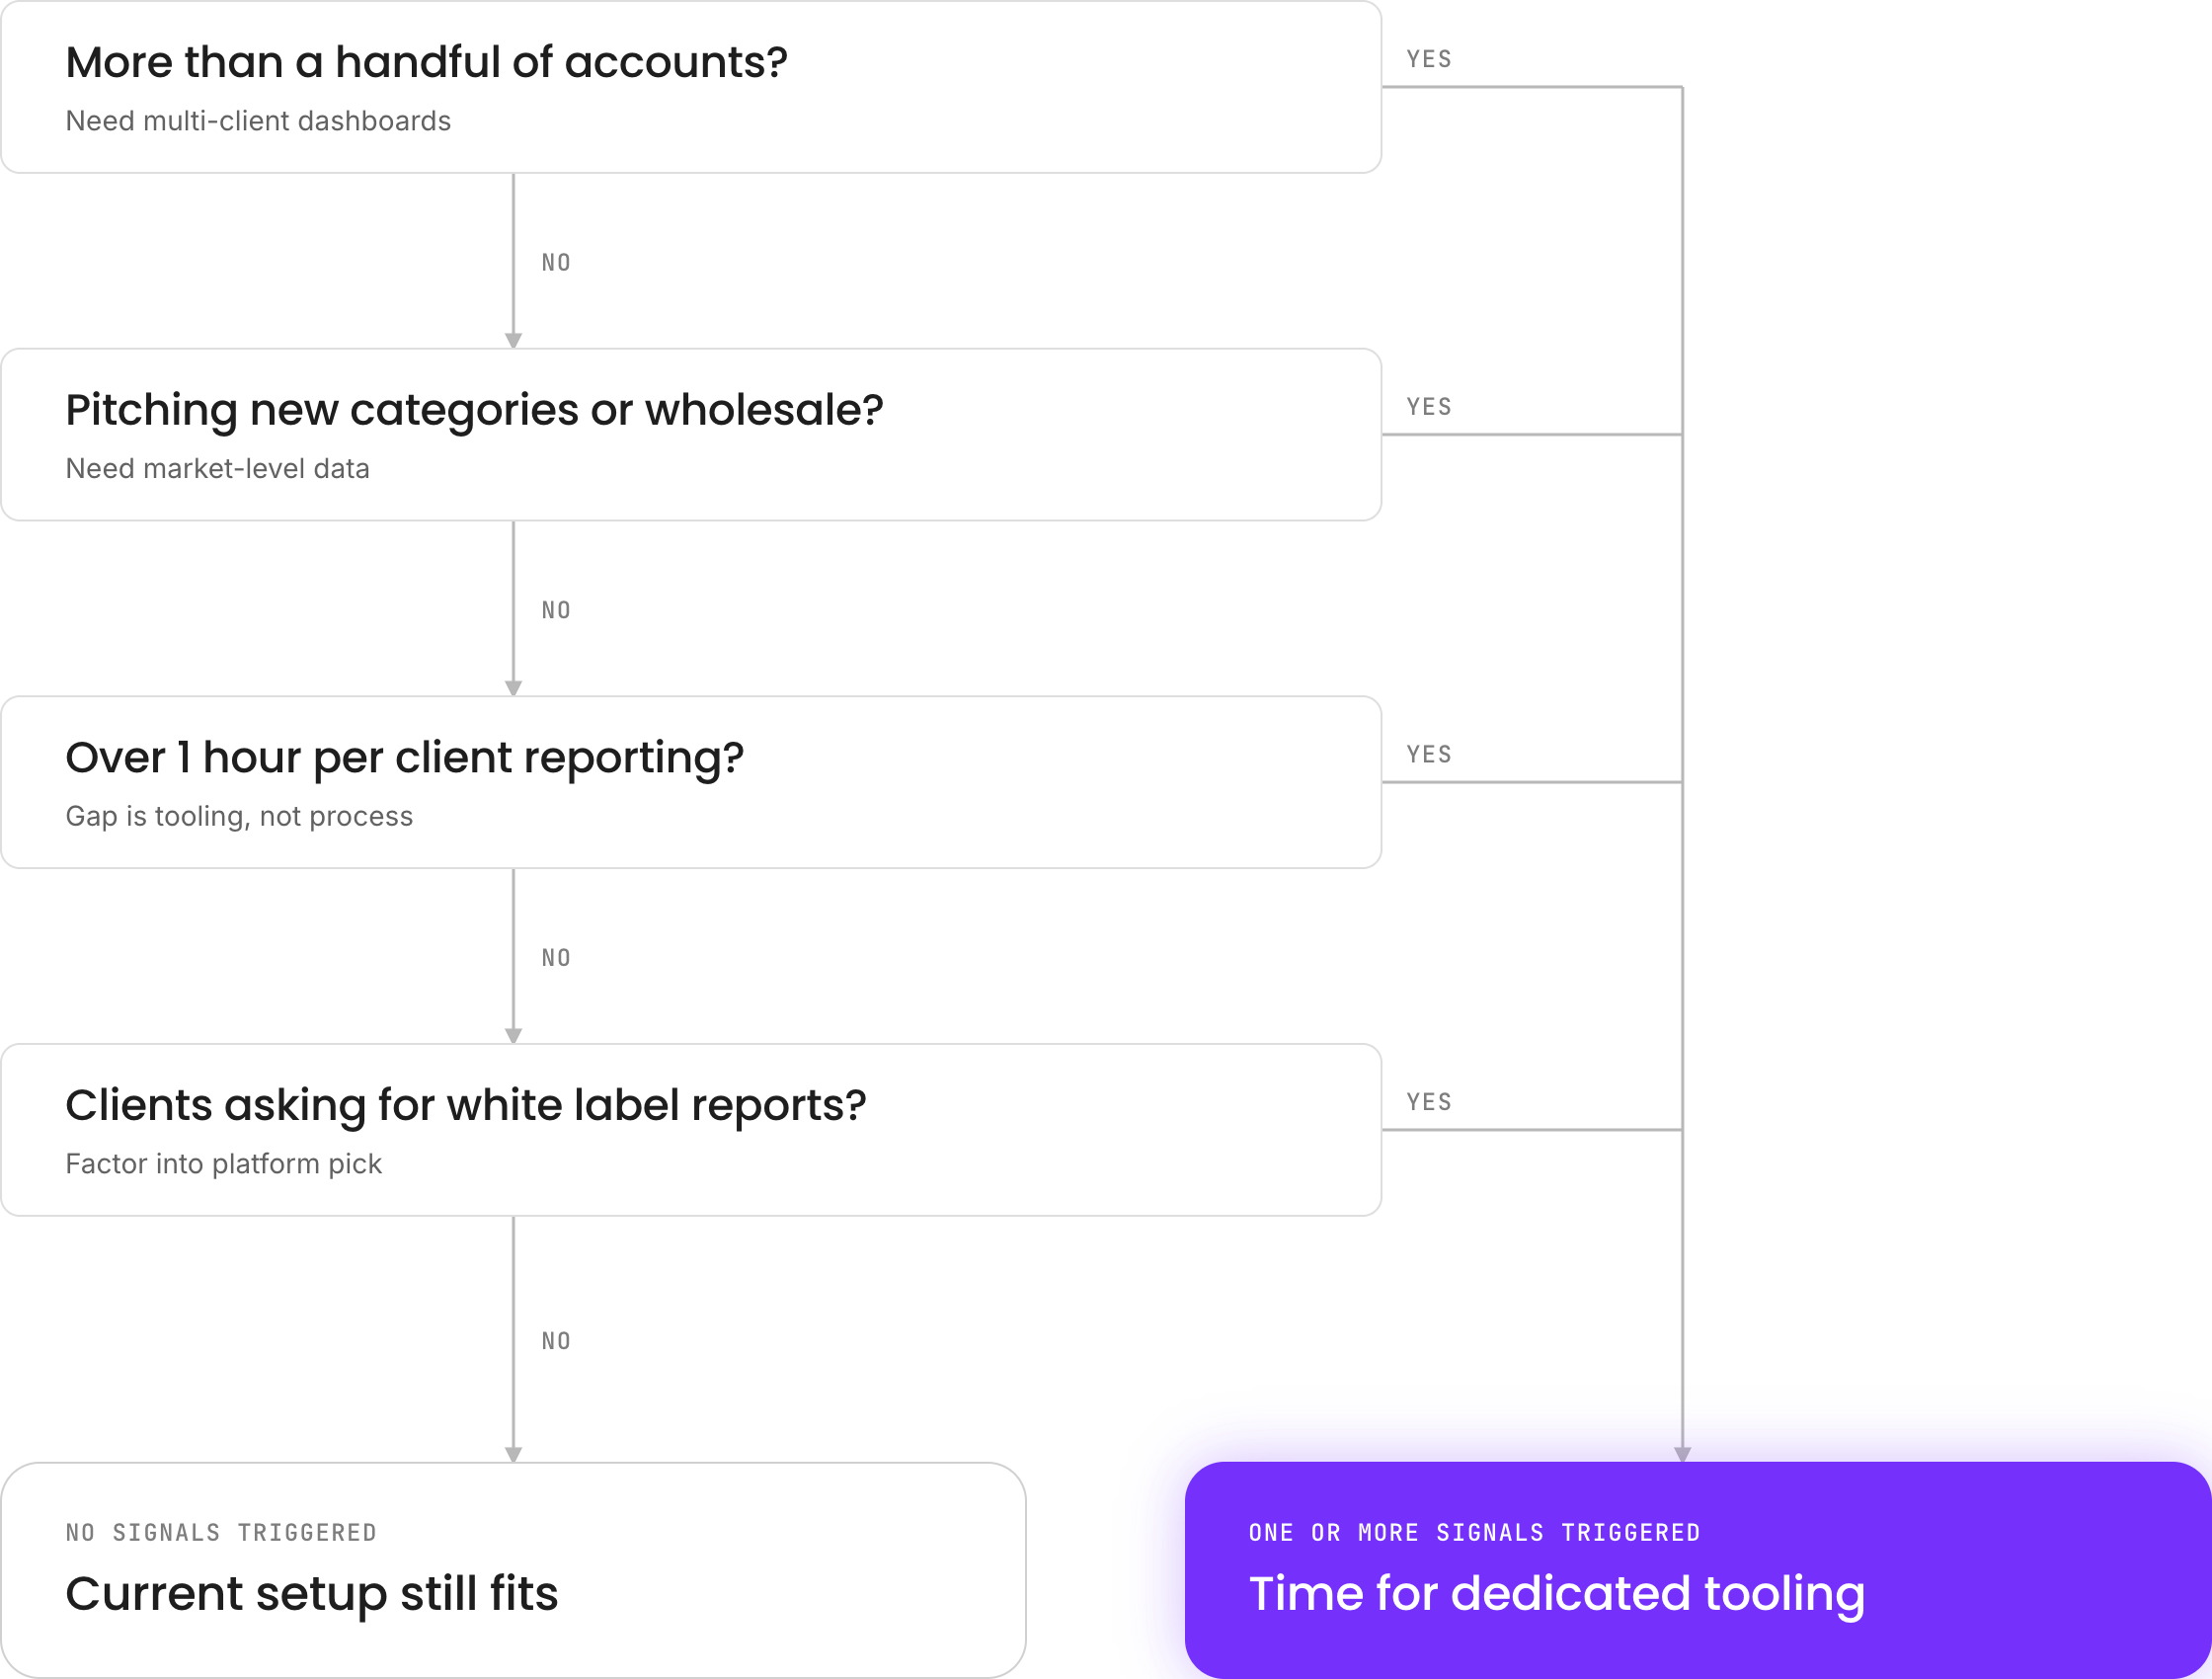
Size your actual need before choosing a tool: account count, category expansion plans, time spent reformatting reports, and white label requirements.
Amazon analytics covers a lot of ground: sales data, ad performance, fee breakdowns, competitive intelligence, and increasingly, shopper behavior signals that never used to be visible at all. If your agency is new to the category or catching up after a year of platform changes, here's the context worth having before you pick a tool or promise a client anything.
Why Native Amazon Reports Fall Short
Seller Central and Amazon Ads give you plenty of reports, but they're built to show activity, not profit. Sales, advertising, fees, and refunds each live in a separate place, so by the time a margin problem shows up in a spreadsheet, it's already cost the client money. Native reporting is also revenue-focused by default, and revenue is not the same question as "which SKUs are actually making money after ads, fees, and refunds." That gap is the whole reason a separate analytics layer exists.
The Terms Worth Knowing
A quick glossary, since these terms get used loosely and clients will expect you to use them precisely.
Key Amazon Advertising Terms & Metrics
Term
What It Means
ACoS
Advertising Cost of Sale. Ad spend divided by ad-attributed sales only.
TACoS
Total Advertising Cost of Sale. Ad spend divided by total sales, ad and organic combined.
Contribution margin per SKU
Selling price minus product cost, referral fee, FBA fulfillment, and storage. The actual dollar profit per unit.
AMC
Amazon Marketing Cloud. Amazon's shopper-signal and path-to-purchase data layer.
Share of voice
A brand's visibility in a category relative to competitors, usually measured across organic and paid placements.
Buy Box
The default "Add to Cart" listing on a product page. Losing it is one of the fastest ways to lose sales without any ad metric changing.
What Changed on Amazon in 2026
A few platform shifts changed what "good analytics" needs to cover this year.
Amazon retired Rufus into Alexa for Shopping, Sponsored Prompts became a billable ad placement, DSP entry thresholds dropped, and Prime Day moved to June. The scale of the platform is also part of the picture: Amazon holds an estimated 39.7% of US ecommerce sales in 2026 by one measure, and 35.7% of a $440 billion base by another, depending on how the base is calculated.
Either way, the amount of shopper behavior data flowing through Amazon's own systems keeps growing, which is exactly why AI-powered search and generative shopping assistants are starting to influence purchase decisions before a click ever reaches a listing.
For agencies, the practical takeaway is that ad-placement reporting alone is falling further behind. A client asking "why did conversion drop" increasingly needs an answer that accounts for how Amazon's own AI assistants are surfacing (or not surfacing) their products, not just a bid-and-budget explanation.
How to Know What Your Agency Actually Needs
Not every agency needs the same depth of tooling. A few honest questions help:
Once you know the answer to those, the tool decision gets a lot easier.
If you want a sense of how a market-first tool changes the pitching process specifically, SmartScout's agency guide is worth a read.
FAQs
What Is Amazon Analytics, in Plain Terms?
It's the practice of pulling sales, advertising, fee, and competitive data into one place so you can see profit, not just activity. Native Amazon reports show you what happened in each of those areas separately; analytics connects them.
What’s the Difference Between ACoS and TACoS?
ACoS divides ad spend by ad-attributed sales only. TACoS divides ad spend by total sales, ad and organic combined, which makes it the better gauge of whether the whole account is growing or just shifting where sales come from.
What Is Amazon Marketing Cloud (AMC)?
AMC is Amazon's shopper-signal and path-to-purchase data layer. It shows behavior leading up to a purchase, not just the final ad click, which is increasingly relevant as AI-powered search influences more of that path.
What Changed on Amazon in 2026 That Agencies Should Know About?
Several platform shifts landed this year: Rufus was retired into Alexa for Shopping, Sponsored Prompts became a billable ad placement, DSP entry thresholds dropped, and Prime Day moved to June. Each one changes what a complete analytics picture needs to include.
Does My Agency Need a Dedicated Analytics Tool, or Are Native Amazon Reports Enough?
It depends on scale. A small handful of accounts can often run on manual review. Past that, or once you're pitching new categories, spending significant time reformatting reports by hand, or fielding client requests for white label reporting, native reports stop being enough on their own.
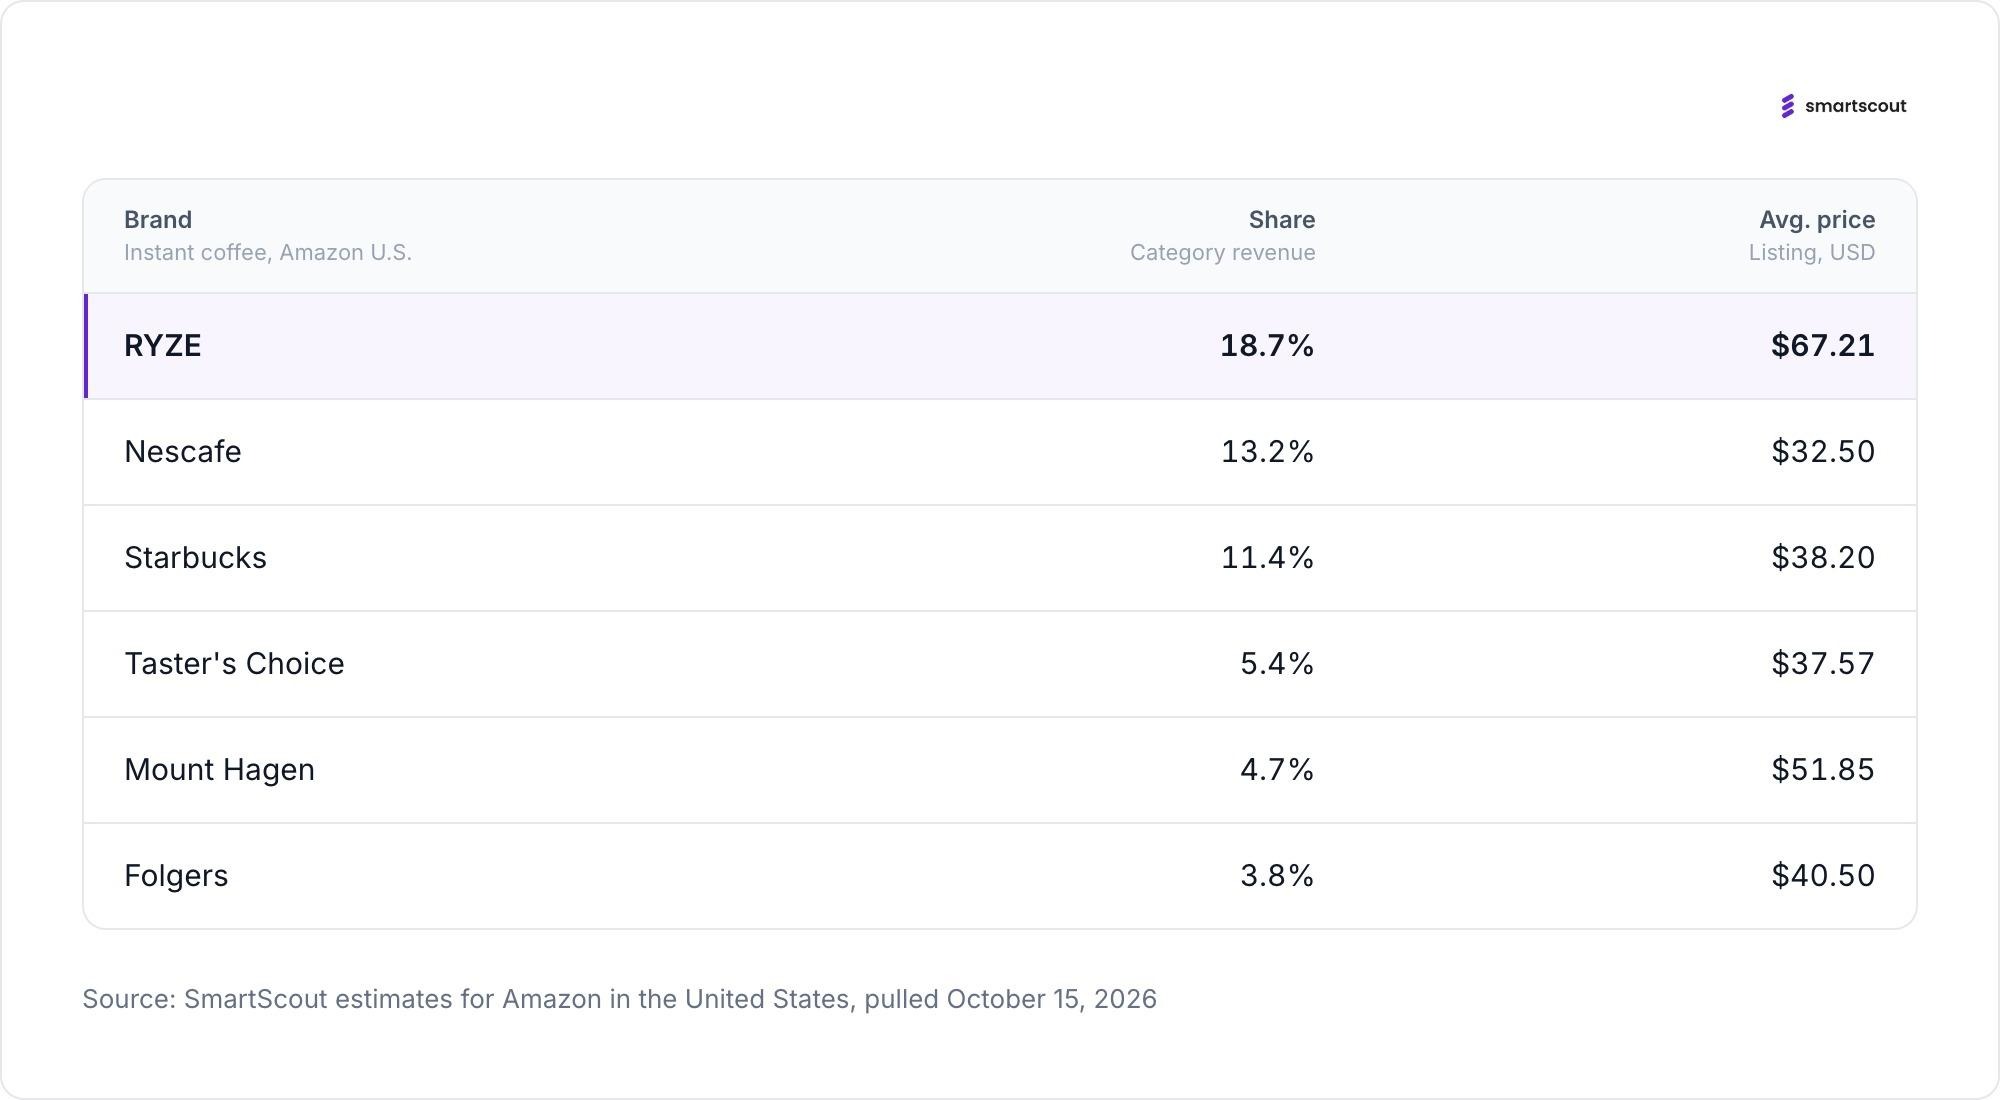
New SmartScout data shows RYZE, a mushroom coffee blend, now brings in more revenue than Nescafe or Starbucks in Amazon's Instant Coffee category. The caffeine alternatives made without coffee are growing at a fraction of that pace, and several of the best-known names are shrinking.
A Mushroom Brand Now Leads the Instant Aisle
RYZE blends mushroom powders with a smaller dose of coffee and sells it as a gentler way to start the day. On Amazon it is now the top brand in Instant Coffee, with 18.7 percent of category revenue, or $3,374,391 a month.
Nescafe is second at 13.2 percent and $2,376,174. Starbucks is third at 11.4 percent and $2,052,561. Taster's Choice, Mount Hagen and Folgers follow, each with less than 6 percent.
RYZE gets there with far fewer units. It moves 68,025 units a month in the category, against 192,592 for Nescafe. Its average listing price is $67.21, roughly double Nescafe's $32.50 and Starbucks' $38.20. It needs nine listings to do it. Nescafe has 159.
Across all 22 of its products, RYZE brings in $4,191,101 a month, or $75,938,416 a year. That is up 43.2 percent from a year ago, and every sale goes through a single seller.
A product marketed as a way off coffee is now the best-selling coffee in its aisle.
Fewer Searches, More Sales
The growth is happening while interest, measured by search, is falling. Searches for "ryze mushroom coffee" fell 21.3 percent over the past year, from 439,680 a month to 346,056. Searches for the generic term "mushroom coffee" fell 22.2 percent, to 195,516.
The rest of the category followed. Searches for Cuppa mushroom coffee fell 22.9 percent. Four Sigmatic fell 19.1 percent. Everyday Dose fell 76.4 percent, to 12,880 a month. Laird was the one brand search that grew, up 20.1 percent.
Revenue moved the other way. RYZE is up 43.2 percent. Everyday Dose, despite the collapse in searches for its name, grew revenue 12 percent, to $20,463,289 a year.
One reading of the gap is that mushroom coffee has stopped being new. Shoppers who already drink it do not search for it. They reorder.
The curiosity phase is ending. The habit phase pays better.
Coffee Itself Is Still Growing
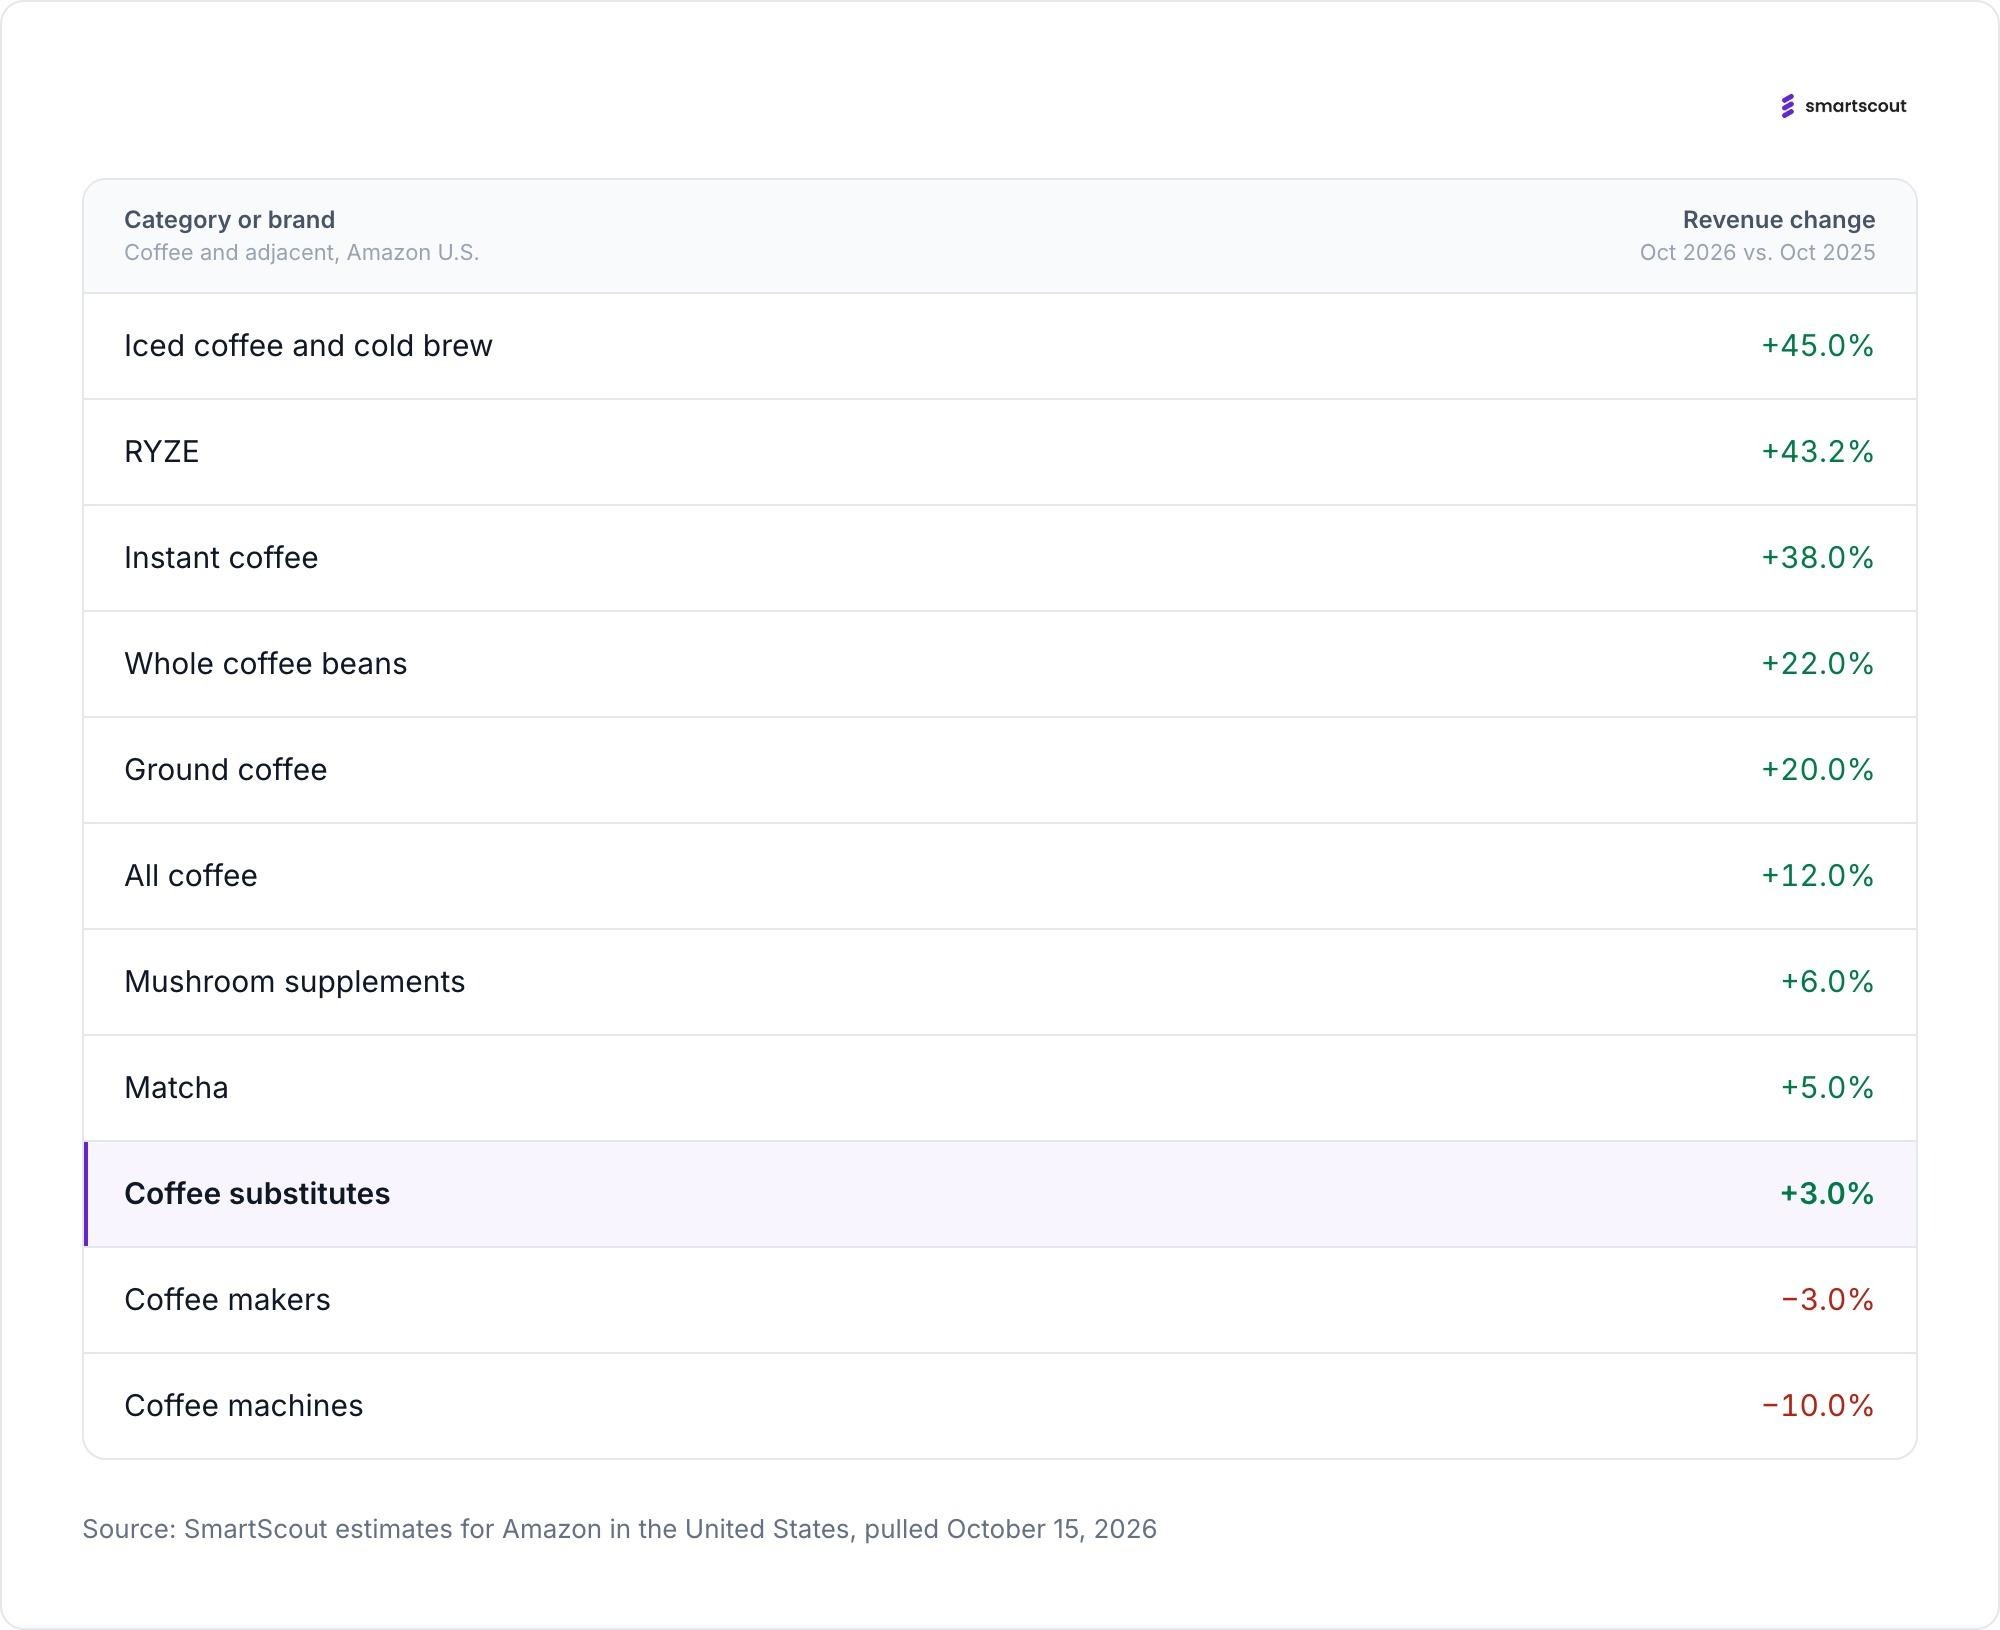
The idea that Americans are quitting coffee does not show up in Amazon's numbers. The Coffee category brings in $3,100,079,393 a year, up 12 percent from a year ago. Amazon sells about 70 percent of it directly.
Every major format grew, and the most convenient ones grew fastest. Iced coffee and cold brew rose 45 percent, to $61,542,398 a year. Instant coffee rose 38 percent, to $217,184,442. Whole beans rose 22 percent and ground coffee 20 percent, to $382,940,139 and $430,872,515. Ready-to-drink bottled coffee rose 13 percent.
What goes in the cup is growing too. Coffee creamers are up 36 percent, to $89,506,211 a year. Plant-based creamers are up 31 percent.
The tell is the hardware. Coffee makers are down 3 percent, to $806,265,513 a year, and coffee machines are down 10 percent. Shoppers are spending more on coffee and less on the equipment that brews it the traditional way.
Revenue includes price changes, so some of that 12 percent is higher prices, not more cups. Even so, no format of coffee itself is shrinking.
The Further From Coffee, the Slower the Growth
Ranking caffeine alternatives on Amazon by year-over-year revenue growth produces a clean gradient. The closer a product stays to coffee, the faster it grows.
Where coffee is still in the cup, growth is strongest: RYZE up 43.2 percent, the Instant Coffee category it leads up 38 percent.
Where coffee is replaced by a supplement or a tea, growth slows to single digits: mushroom supplements up 6 percent, to $308,098,398 a year, and matcha up 5 percent, to $123,185,356.
Where coffee is replaced entirely, growth nearly stops. Coffee Substitutes, the caffeine-free roasted blends made from chicory, grains and herbs, grew 3 percent, to $30,999,728 a year. Amazon shoppers spend about 100 dollars on coffee for every dollar they spend on substitutes. Searches for "coffee alternative" fell 19.6 percent.
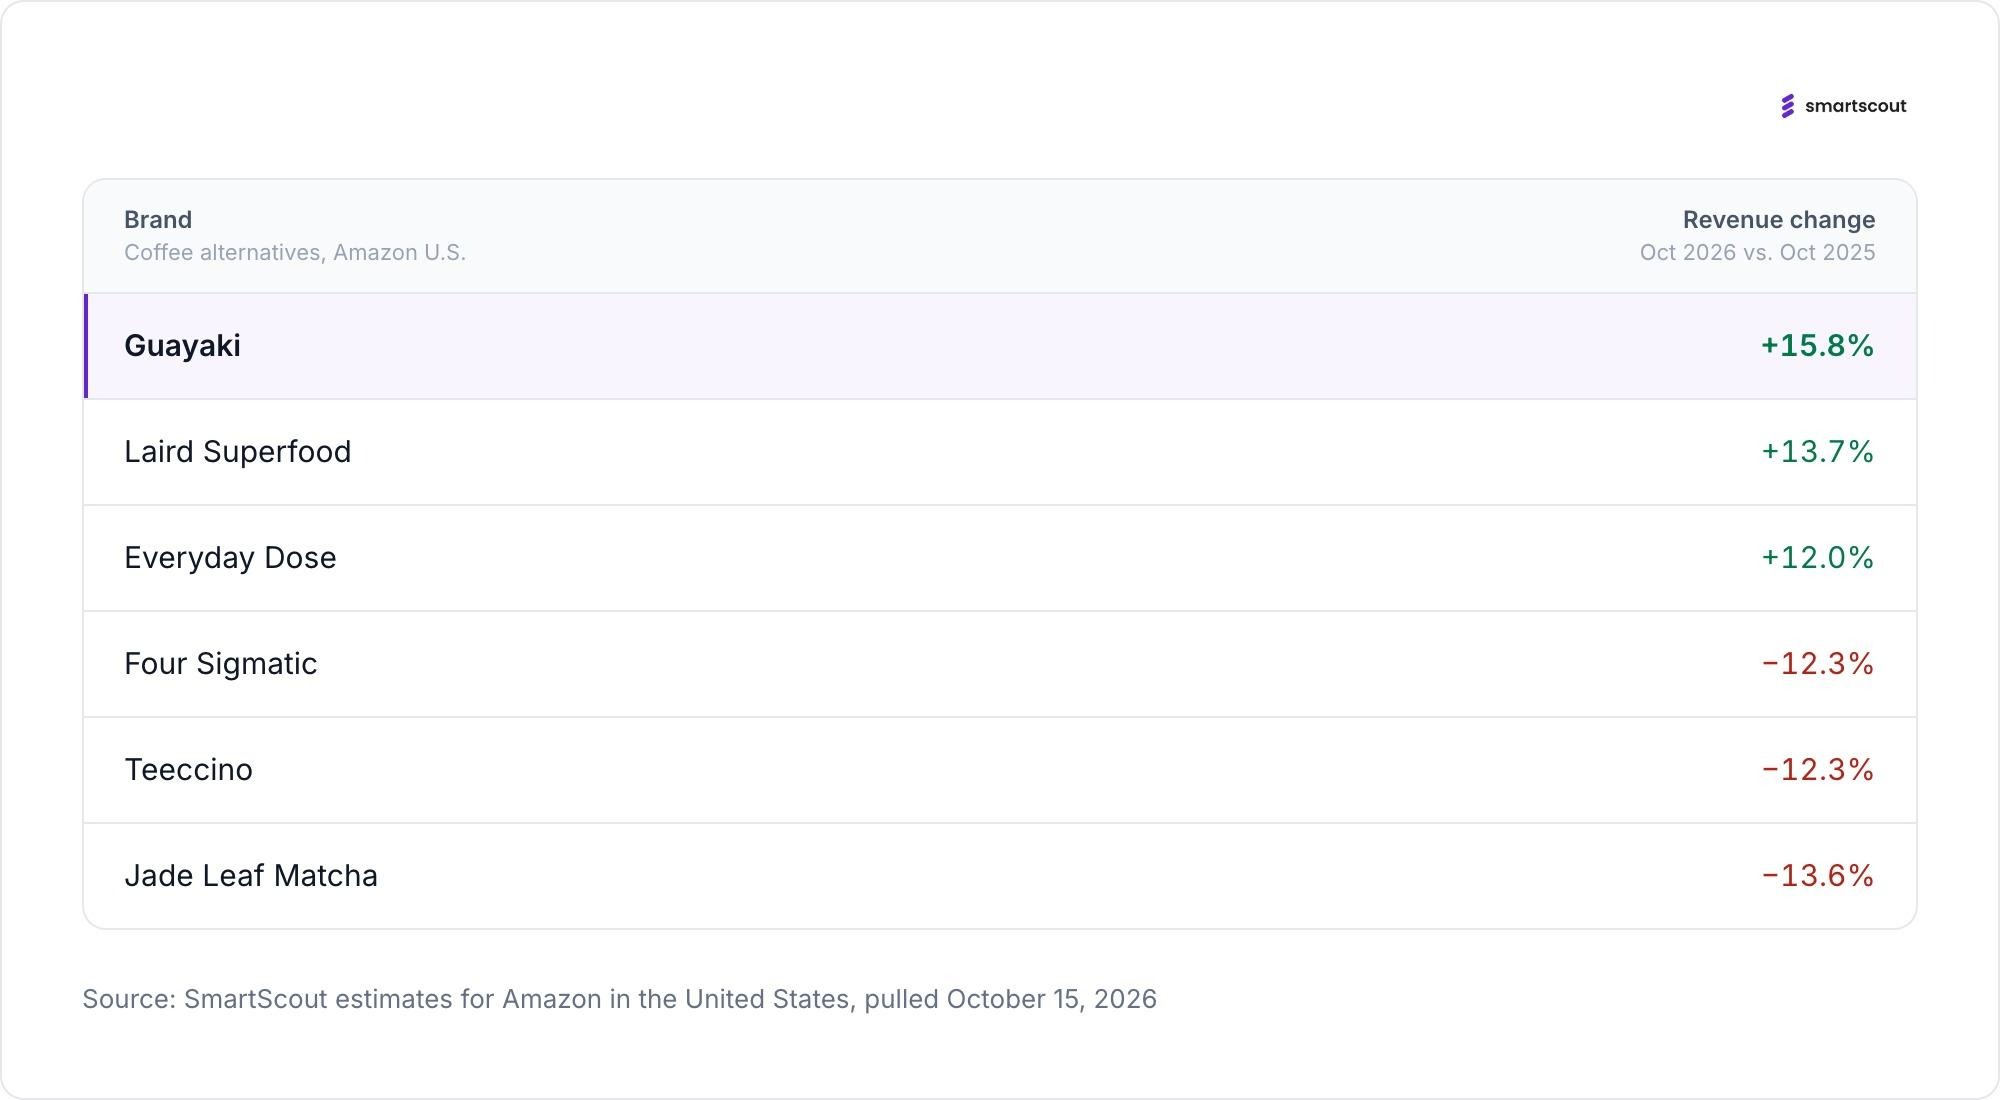
The brand results split the same way. Guayaki grew 15.8 percent, Laird Superfood 13.7 percent and Everyday Dose 12 percent. Four Sigmatic, one of the first mushroom coffee brands, fell 12.3 percent, to $22,751,545 a year. Teeccino, the best-known herbal coffee, fell 12.3 percent. Jade Leaf Matcha fell 13.6 percent, to $22,564,216.
The market is rewarding products that keep the coffee and change the rest.
The Alternatives That Changed Shape
Guayaki is the exception that proves the pattern. Its growth came from changing what it sells.
Searches for loose yerba mate fell 33.0 percent, from 131,079 a month to 87,876. Searches for yerba mate tea fell 27.9 percent. Searches for yerba mate energy drinks rose 148.0 percent, from 14,787 to 36,678. Amazon now lists Guayaki, which sells under the Yerba Madre storefront, in Energy Drinks rather than tea. It brings in $1,380,997 a month.
Matcha shows a different kind of change. Category revenue grew 5 percent, but the best-known brand shrank. Jade Leaf fell 13.6 percent while the category grew, as sales spread across 989 brands and third-party sellers took 94 percent of revenue.
The ritual gear is fading faster than the tea. Searches for matcha whisk sets fell 59.5 percent, and revenue in Matcha Whisks fell 25 percent. Searches for ceremonial grade matcha powder fell 23.1 percent.
Yerba mate grew by turning into a canned energy drink. Matcha grew by splintering into hundreds of small brands. Neither grew by acting like a replacement for coffee.
What Americans Are Actually Replacing
On Amazon, Americans are still buying coffee. What they are leaving behind is the version that needs a machine, a grinder and time. The fastest-growing formats dissolve, pour or come in a can: instant up 38 percent, iced coffee and cold brew up 45 percent, yerba mate energy drink searches up 148 percent.
RYZE fits that pattern. It is a scoop of powder sold as a gentler start to the day, and it still contains coffee. The products that asked shoppers to give coffee up entirely, such as caffeine-free substitutes, are barely growing, and the best-known of them is shrinking.
The alternative that won kept the coffee.
Americans Wanted a Coffee Alternative. The One They Picked Still Has Coffee in It.
The best SellerSonar alternative depends on what you need to improve: listing monitoring, price tracking, or your understanding of the competition.
SmartScout is our top pick for Amazon competitive intelligence, while Helium 10, SellerApp, sellerboard, and Keepa offer different approaches to alerts and product monitoring.
A changed listing needs attention. A growing competitor needs investigation. Choosing software starts with knowing which problem you are trying to solve.
This guide compares five SellerSonar alternatives, explains where each fits, and shows how to evaluate a replacement before moving your catalog.
Disclosure: This comparison is published by SmartScout. Our recommendations reflect the use cases below and a review of public product documentation, not a controlled performance test. Features and plan limits can change.
Best SellerSonar Alternatives at a Glance
These are our editorial picks by use case, rather than a ranking of alert speed or accuracy.
Tool
Best fit
Main reason to consider it
1. SmartScout
Competitive intelligence and market research
Connect seller, brand, product, and category insights
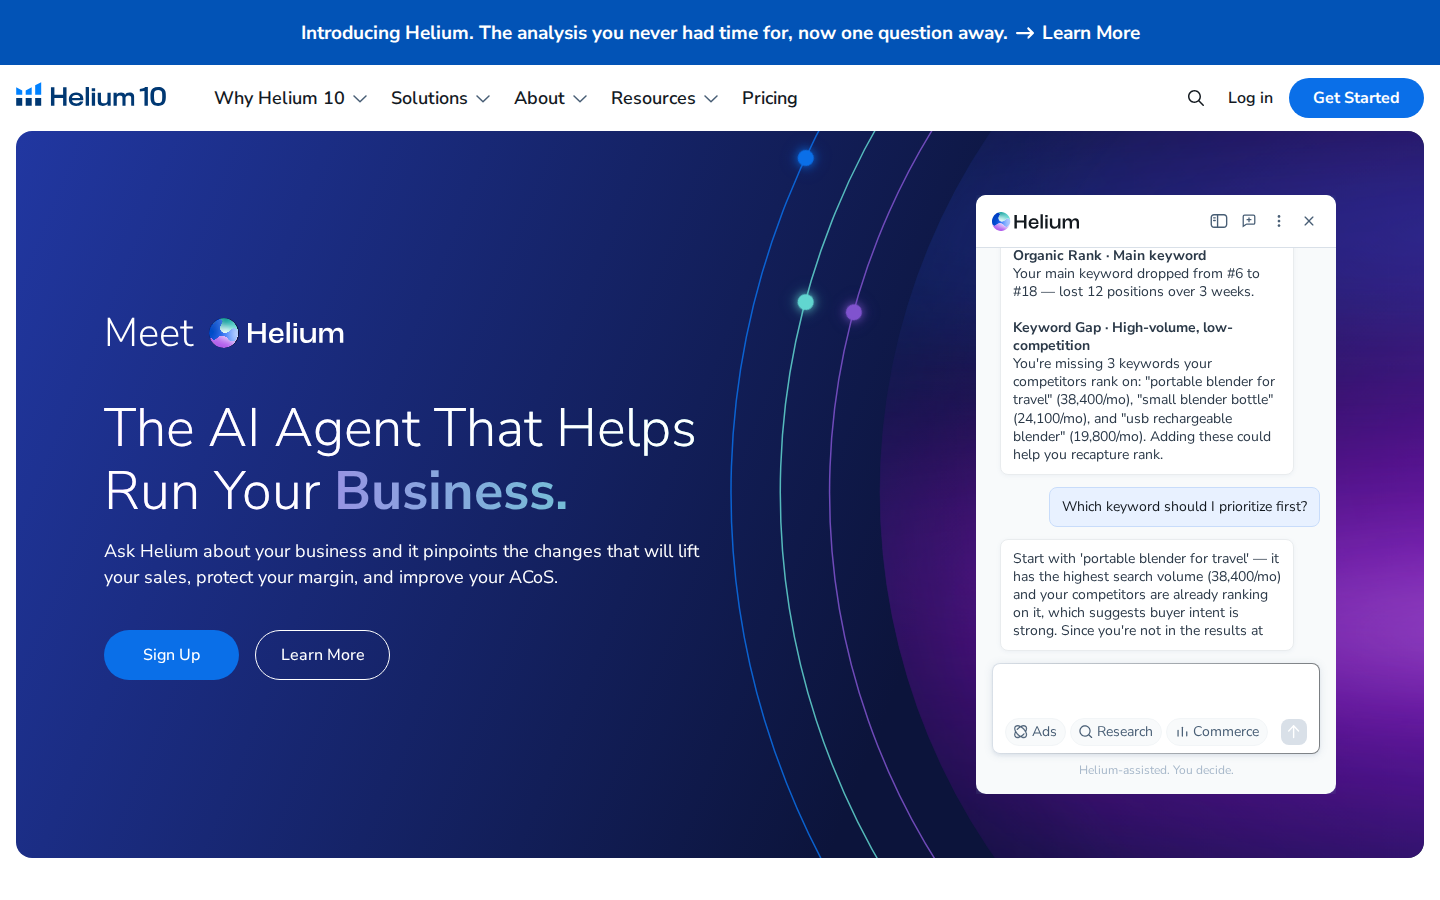
2. Helium 10
Listing alerts within a broader seller toolkit
Combine listing monitoring with research and optimization tools
3. SellerApp
Product and competitor alerts
Track changes in pricing, Buy Box status, ratings, and listing quality
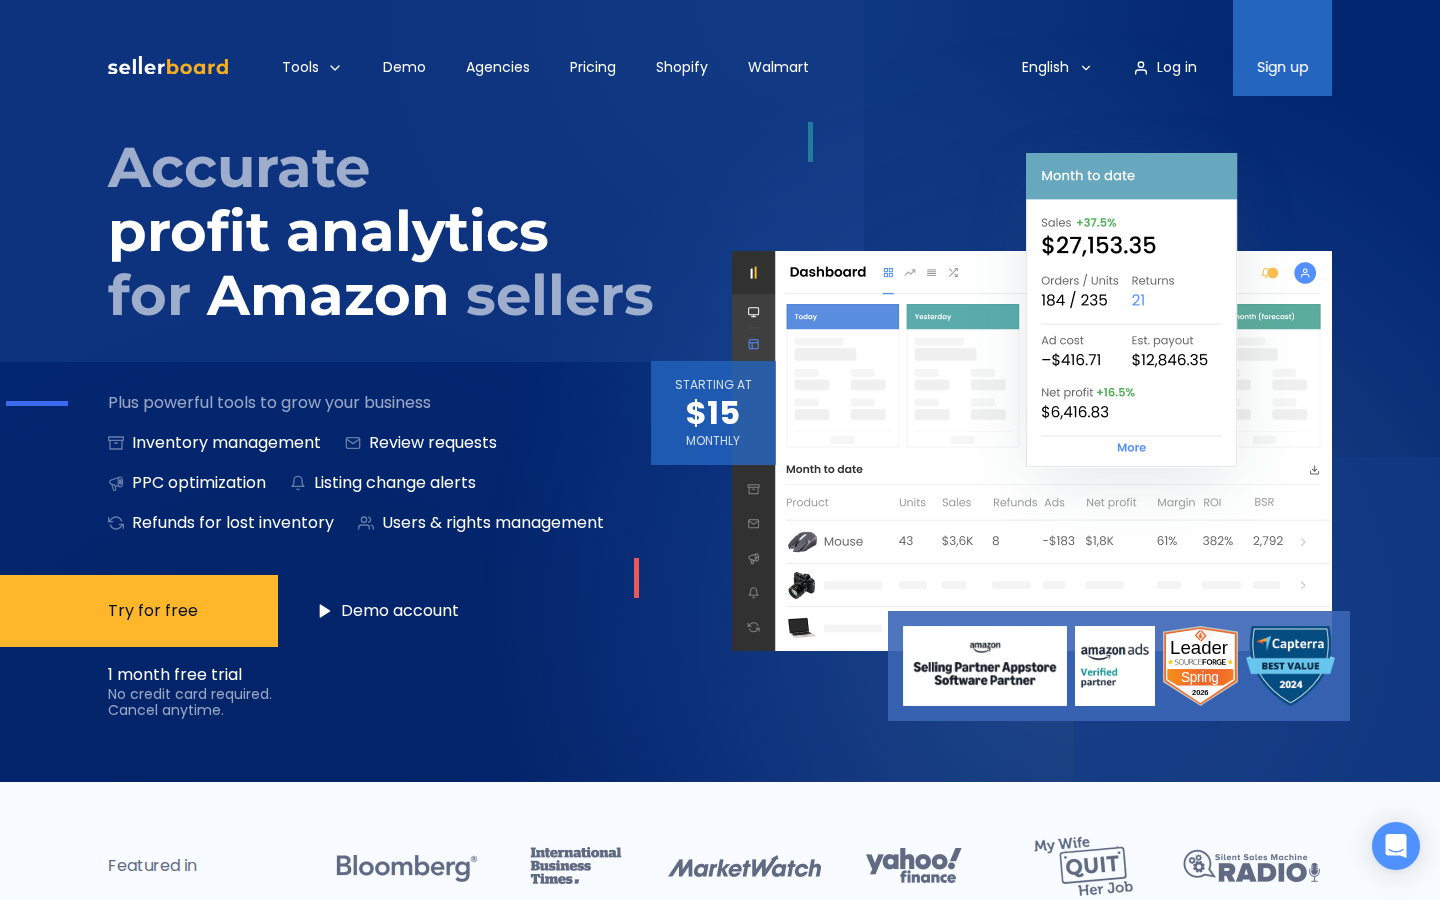
4. sellerboard
Operational alerts
Organize important listing and account events into a working dashboard
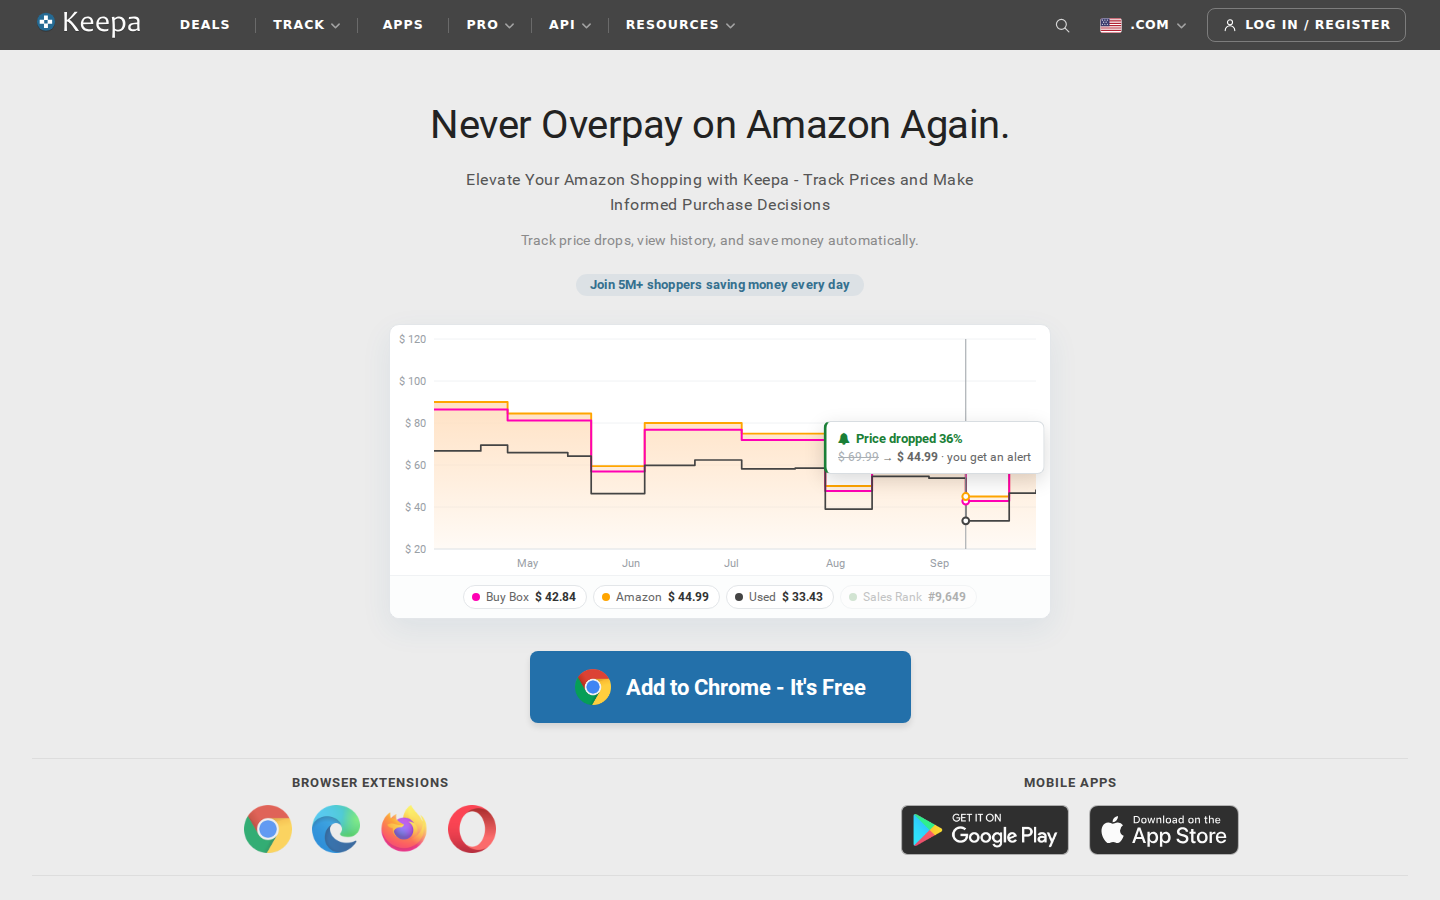
5. Keepa
Amazon price history and price alerts
Investigate historical prices and set price watches
If immediate listing notifications are your main requirement, start by comparing alert coverage and delivery. If you want to understand where competitors are growing and which opportunities deserve investment, start with SmartScout.
What Does SellerSonar Do
SellerSonar provides Amazon monitoring and analytics for listing changes, competitor activity, keyword rankings, and Buy Box events. Its alert documentation also describes price and review monitoring.
It goes beyond basic price notifications. Its retail issue monitoring covers events such as listing suppression, stockouts, and broken variations, while its API and webhooks support integrations with other workflows.
SellerSonar may already be a good fit if your priority is keeping a defined set of ASINs under watch. An alternative becomes more interesting when you need deeper market research, a different combination of seller tools, or a more focused price tracker.
The useful question is: What decision should this software help your team make?
How we compared the alternatives
We evaluated each option against five practical buying questions:
Coverage: Does it address listing events, price changes, seller activity, or market performance?
Research depth: Can you investigate beyond an individual ASIN?
Workflow: Does the tool support how your team reviews and acts on information?
Scope: Are you monitoring known products or discovering competitors and opportunities?
Purchase fit: Which limits and included features need checking before subscribing?
An alert dashboard and a market intelligence platform can both be valuable, but their value comes from different tasks. The recommendations below make that distinction explicit.
1) SmartScout
Best SellerSonar alternative for Amazon competitive intelligence
SmartScout is our first recommendation for sellers, brands, and agencies that want a broader understanding of Amazon competition.
Its connected research tools organize information across products, brands, sellers, and subcategories. That structure supports questions such as where to expand a catalog, which brands deserve deeper research, and which competitors to investigate.
Why choose SmartScout
SmartScout brings several relevant research areas together:
Brand and category analysis: Explore market structure and competitive positioning.
Seller research: Investigate sellers and the brands or products associated with them.
Historical analysis: Examine revenue estimates, market share, and pricing over time.
Product research: Review ASIN-level pricing history and other competitive indicators.
Advertising research: Explore competitor advertising activity through AdSpy.
These capabilities make SmartScout especially relevant when your next decision involves assortment, positioning, sourcing, or growth. Competitive revenue figures are estimates, not access to a rival’s private sales ledger.
A practical example
Suppose a competitor lowers the price of a product you sell.
Before matching that move, you might want to investigate whether the change is isolated, whether the brand’s wider assortment is gaining traction, and which other sellers compete in the same market.
That is the kind of research workflow SmartScout is built to support. A price event provides a starting point; connected market data gives your team more context for deciding what to do.
Where it fits alongside SellerSonar
SmartScout is our preferred choice when competitive research is the main buying objective. If your team depends on specific suppression, content-change, or Buy Box notifications, verify those requirements separately before replacing an existing monitoring service.
Some businesses will benefit from using market intelligence and dedicated alerts together.ExploreSmartScout’s features andcurrent plans to find the research capabilities your team needs.
2) Helium 10
Best for listing alerts inside a broader Amazon seller toolkit
Helium 10 Alerts monitors listing changes and potential hijacker activity. Its documentation describes tracking areas including titles, product pages, prices, and Buy Box ownership.
For sellers who also need keyword research and listing optimization tools, keeping those functions within one platform can be convenient.
Why consider it: Your team wants listing monitoring alongside other day-to-day Amazon tools, or already uses Helium 10 and wants to evaluate its included alert functionality.
What to check: Confirm the monitored-ASIN allowance, supported marketplaces, alert types, and subscription requirements. Compare the plan you would actually purchase against your current monitoring setup.
Our take: A relevant option for sellers who want several functions under one subscription. Run a representative group of ASINs through a trial before moving critical monitoring workflows.
3) SellerApp
Best for product alerts and competitor monitoring
SellerApp’s Business Alerts supports notifications for prices, listing quality, ratings, Buy Box changes, and negative reviews. Its documentation describes using alerts for both your products and competitors’ products.
This makes it a useful candidate when your team wants to follow a defined collection of ASINs and respond to changes.
Why consider it: You want configurable product-level alerts, including competitor price movements and Buy Box events.
What to check: SellerApp’s help article describes daily email notifications. Verify the delivery cadence available in your plan if your team needs faster escalation.
Our take: A sensible shortlist option for product monitoring. During evaluation, check whether its alert thresholds produce information your team can act on without excessive noise.
4) sellerboard
Best for organizing operational alerts
sellerboard’s alerts include listing title, description, main-image, category, variation, and suppression events.
Its Alerts dashboard helps teams review important events and manage their resolution status. Marking an alert as resolved records that status in sellerboard; it does not fix the underlying issue on Amazon.
Why consider it: Your team needs a practical way to review listing and account issues and keep track of what has been handled.
What to check: Confirm the alert types and notification settings relevant to your account. Its settings documentation notes that a long-term alert history log is not currently provided, which matters if you need a durable event record.
Our take: Worth evaluating for operational oversight, particularly when accountability for responding to alerts is as important as receiving them.
5) Keepa
Best for Amazon price history and price alerts
Keepa specializes in Amazon price history charts and price-drop alerts. Its browser extension displays charts on Amazon product pages and supports price and availability watches.
Why consider it: Your primary question is how a product’s price has changed, or you want a notification when it reaches a target.
For example, a current discount is easier to evaluate when you can compare it with previous prices. That history can help you decide whether an offer deserves further sourcing research.
What to check: Confirm which data and tracking features require paid access. Price tracking alone should not be treated as a complete replacement for listing-health monitoring.
Our take: A focused choice for price research. Sellers who also need seller, brand, and category context can evaluate SmartScout alongside it.
SmartScout vs SellerSonar
For this comparison, the most useful distinction is the workflow you want to improve.
Your priority
Our recommendation
Research brands, sellers, and category opportunities
Start with SmartScout
Investigate estimated competitive revenue and market share over time
Start with SmartScout
Receive notifications about monitored listing events
Evaluate SellerSonar's specific alert coverage
Route monitoring events into existing systems
Evaluate SellerSonar's API and webhook options
Combine operational monitoring with competitive planning
Consider using both
SellerSonar also offers competitive analytics, so the comparison is not simply “alerts versus data.” Ask each vendor to demonstrate your actual use case.
For example, have the team research the same brand, investigate the same competitor, and review the same set of listing events. The resulting workflow will tell you more than a feature count.
How To Choose a SellerSonar Replacement
Start with the decisions and alerts that matter
Write down your essential use cases before comparing subscriptions. “Monitor competitors” is too broad. “Notify our account manager when an important listing loses the Buy Box” is specific enough to test.
Separate urgent events from research tasks. They may deserve different tools and different review schedules.
Compare cost at your actual usage level
A starting price does not reveal the cost of covering your business. Request pricing for your ASIN count, marketplaces, users, and required features.
For monitoring, ask about update frequency and notification delivery. For research, ask about historical access, exports, and usage limits. Avoid paying for a lower tier that excludes the capability driving your purchase.
Run a representative pilot
Use a sample that includes your highest-value products, a few frequently changing listings, and relevant competitors.
During the pilot, record:
Whether required data or events appear.
How long it takes the team to find and understand them.
Whether notifications reach the right person.
Which decisions the tool improves.
Any manual work still required.
Where continuity matters, keep your current monitoring active during the evaluation. Move only after you have verified the replacement against your requirements.
Choose the Tool That Supports Your Next Decision
If your main goal is understanding the competitive landscape, start with SmartScout. Its connected research approach is particularly useful when your questions extend across sellers, brands, products, and categories.
If your immediate requirement is listing monitoring, compare the relevant alert tools using your own ASINs and operational requirements.
Explore SmartScout to see how market intelligence can support your next Amazon growth decision.
FAQs
5 Best SellerSonar Alternatives for Amazon Sellers
Keepa is really good at what many Amazon sellers need: understanding a product’s price history and spotting changes before making a buying decision. For sellers who spend their day evaluating individual listings, it can be an important part of their workflow.
But sometimes your next business decision requires more than a product chart.
Which brands should you pursue? Who are the resellers competing across a brand’s catalog? How does one brand compare with the rest of its category? Where should you focus your sourcing or business development efforts?
That is where a different kind of Amazon research tool becomes valuable.SmartScout is our number-one Keepa alternative for sellers looking for higher-level, big-picture insights. Its Chrome extension includes price history, while the full platform helps you understand brands, resellers, products, and market opportunities together.
Below, we compare five options, explain where each fits, and cover when keeping Keepa still makes sense.
This comparison is published by SmartScout. We rank SmartScout first for brand, reseller, and market analysis; the best fit for your business depends on the decisions you need to make.
Best Keepa Alternatives at a Glance
These tools address different needs. Some focus on price tracking, while others expand into sourcing or broader Amazon research.
Tool or service
Best fit
Main function
Main consideration
1. SmartScout Rating Booster
Sellers who want routine requests handled automatically
Triggers Amazon’s official review requests
Focused on making requests easy; does not guarantee reviews
2. Amazon Request a Review
Low-volume sellers who prefer a manual option
Sends Amazon’s standard request from Seller Central
Requires someone to handle the manual process
3. Amazon Vine
Eligible products building an initial review base
Provides products to Amazon-selected reviewers
Eligibility, inventory costs, and possible enrollment fees
4. FeedbackFive
Teams that want requests and reputation monitoring
Automates requests and monitors reviews and seller feedback
Compare monitoring needs and plan allowances
5. FeedbackWhiz
Sellers who want more campaign options
Official requests or custom messaging workflows
More choices require more configuration decisions
6. Helium 10 Follow-Up
Sellers already using Helium 10
Review requests and post-purchase communication
Check access within the current subscription offering
7. Jungle Scout Review Automation
Sellers already using Jungle Scout
Automates Seller Central review requests
May overlap with a tool you already use
8. Seller Labs Feedback Genius
Teams managing buyer communication workflows
Review requests and seller feedback outreach
Match the workflow to your communication needs
9. SageMailer
Sellers seeking requests plus messaging options
Official requests and permitted buyer messaging
Evaluate message allowances and settings
10. Amazon Customer Reviews tool
Eligible brands monitoring customer issues
Review visibility and eligible customer support outreach
Helps manage existing reviews; not a request automation replacement
1. SmartScout: Best for Brand, Reseller, and Big-Picture Insights
If you are researching Keepa alternatives because you want to understand more of the Amazon marketplace, start withSmartScout.
A product’s price history can help you decide whether an individual opportunity deserves attention. SmartScout helps you move from that listing to the larger business opportunity around it.
Price history in the SmartScout Chrome extension
TheSmartScout Chrome extension brings product research into your Amazon browsing workflow. Its history charts include Buy Box and Amazon pricing, alongside metrics such as offer count, ratings, and sales rank.
That gives you historical context when looking at a listing. A current price is only one snapshot; seeing how it has moved can help you ask better questions before committing to inventory.
The extension is a useful starting point. The bigger difference appears when you move into the full SmartScout platform.
Understand the resellers behind a brand
A brand with attractive products may still be difficult to compete on. You need to understand the sellers already participating in that brand and the broader competitive environment.
SmartScout’s brand and seller analytics help you investigate the resellers it tracks across a brand, explore seller catalogs, and compare their presence in the marketplace. Instead of checking listings one at a time, you can build a broader picture of who sells what.
That research supports questions such as:
Which resellers are active across this brand’s products?
What other brands do those sellers carry?
Which sellers deserve closer competitive research?
Is this brand worth a deeper sourcing conversation?
For a wholesaler, that can help prioritize potential accounts. For a brand or agency, it can help identify reseller activity that deserves further investigation. A seller appearing in the data does not, by itself, establish whether that seller is authorized.
See the market above the individual listing
SmartScout also connects brand research with category and subcategory analysis, estimated revenue, and market share. These views help you assess where a brand sits within a larger opportunity.
Imagine finding one promising product from a household goods brand. Before placing an order, you may want to assess the rest of its catalog, research competing resellers, and compare that brand with others in the same market.
That is the kind of decision SmartScout is built to support: where to focus your business, as well as which product to investigate next.
SmartScout vs. Keepa: which is better?
For higher-level brand, reseller, and market insights, SmartScout is the better fit. Its strength is connecting those views in one research platform.
Keepa remains a strong choice when detailed product history is central to your daily work. SmartScout’s extension includes price history, but that does not mean every Keepa chart, alert, or data field has a one-for-one equivalent.
Some sellers will choose SmartScout as their primary research tool. Others will use SmartScout to discover and evaluate broader opportunities, then use Keepa for additional product-level due diligence.
Best for: Wholesale sellers, brands, agencies, and Amazon businesses that want to understand the competitive landscape beyond individual ASINs.
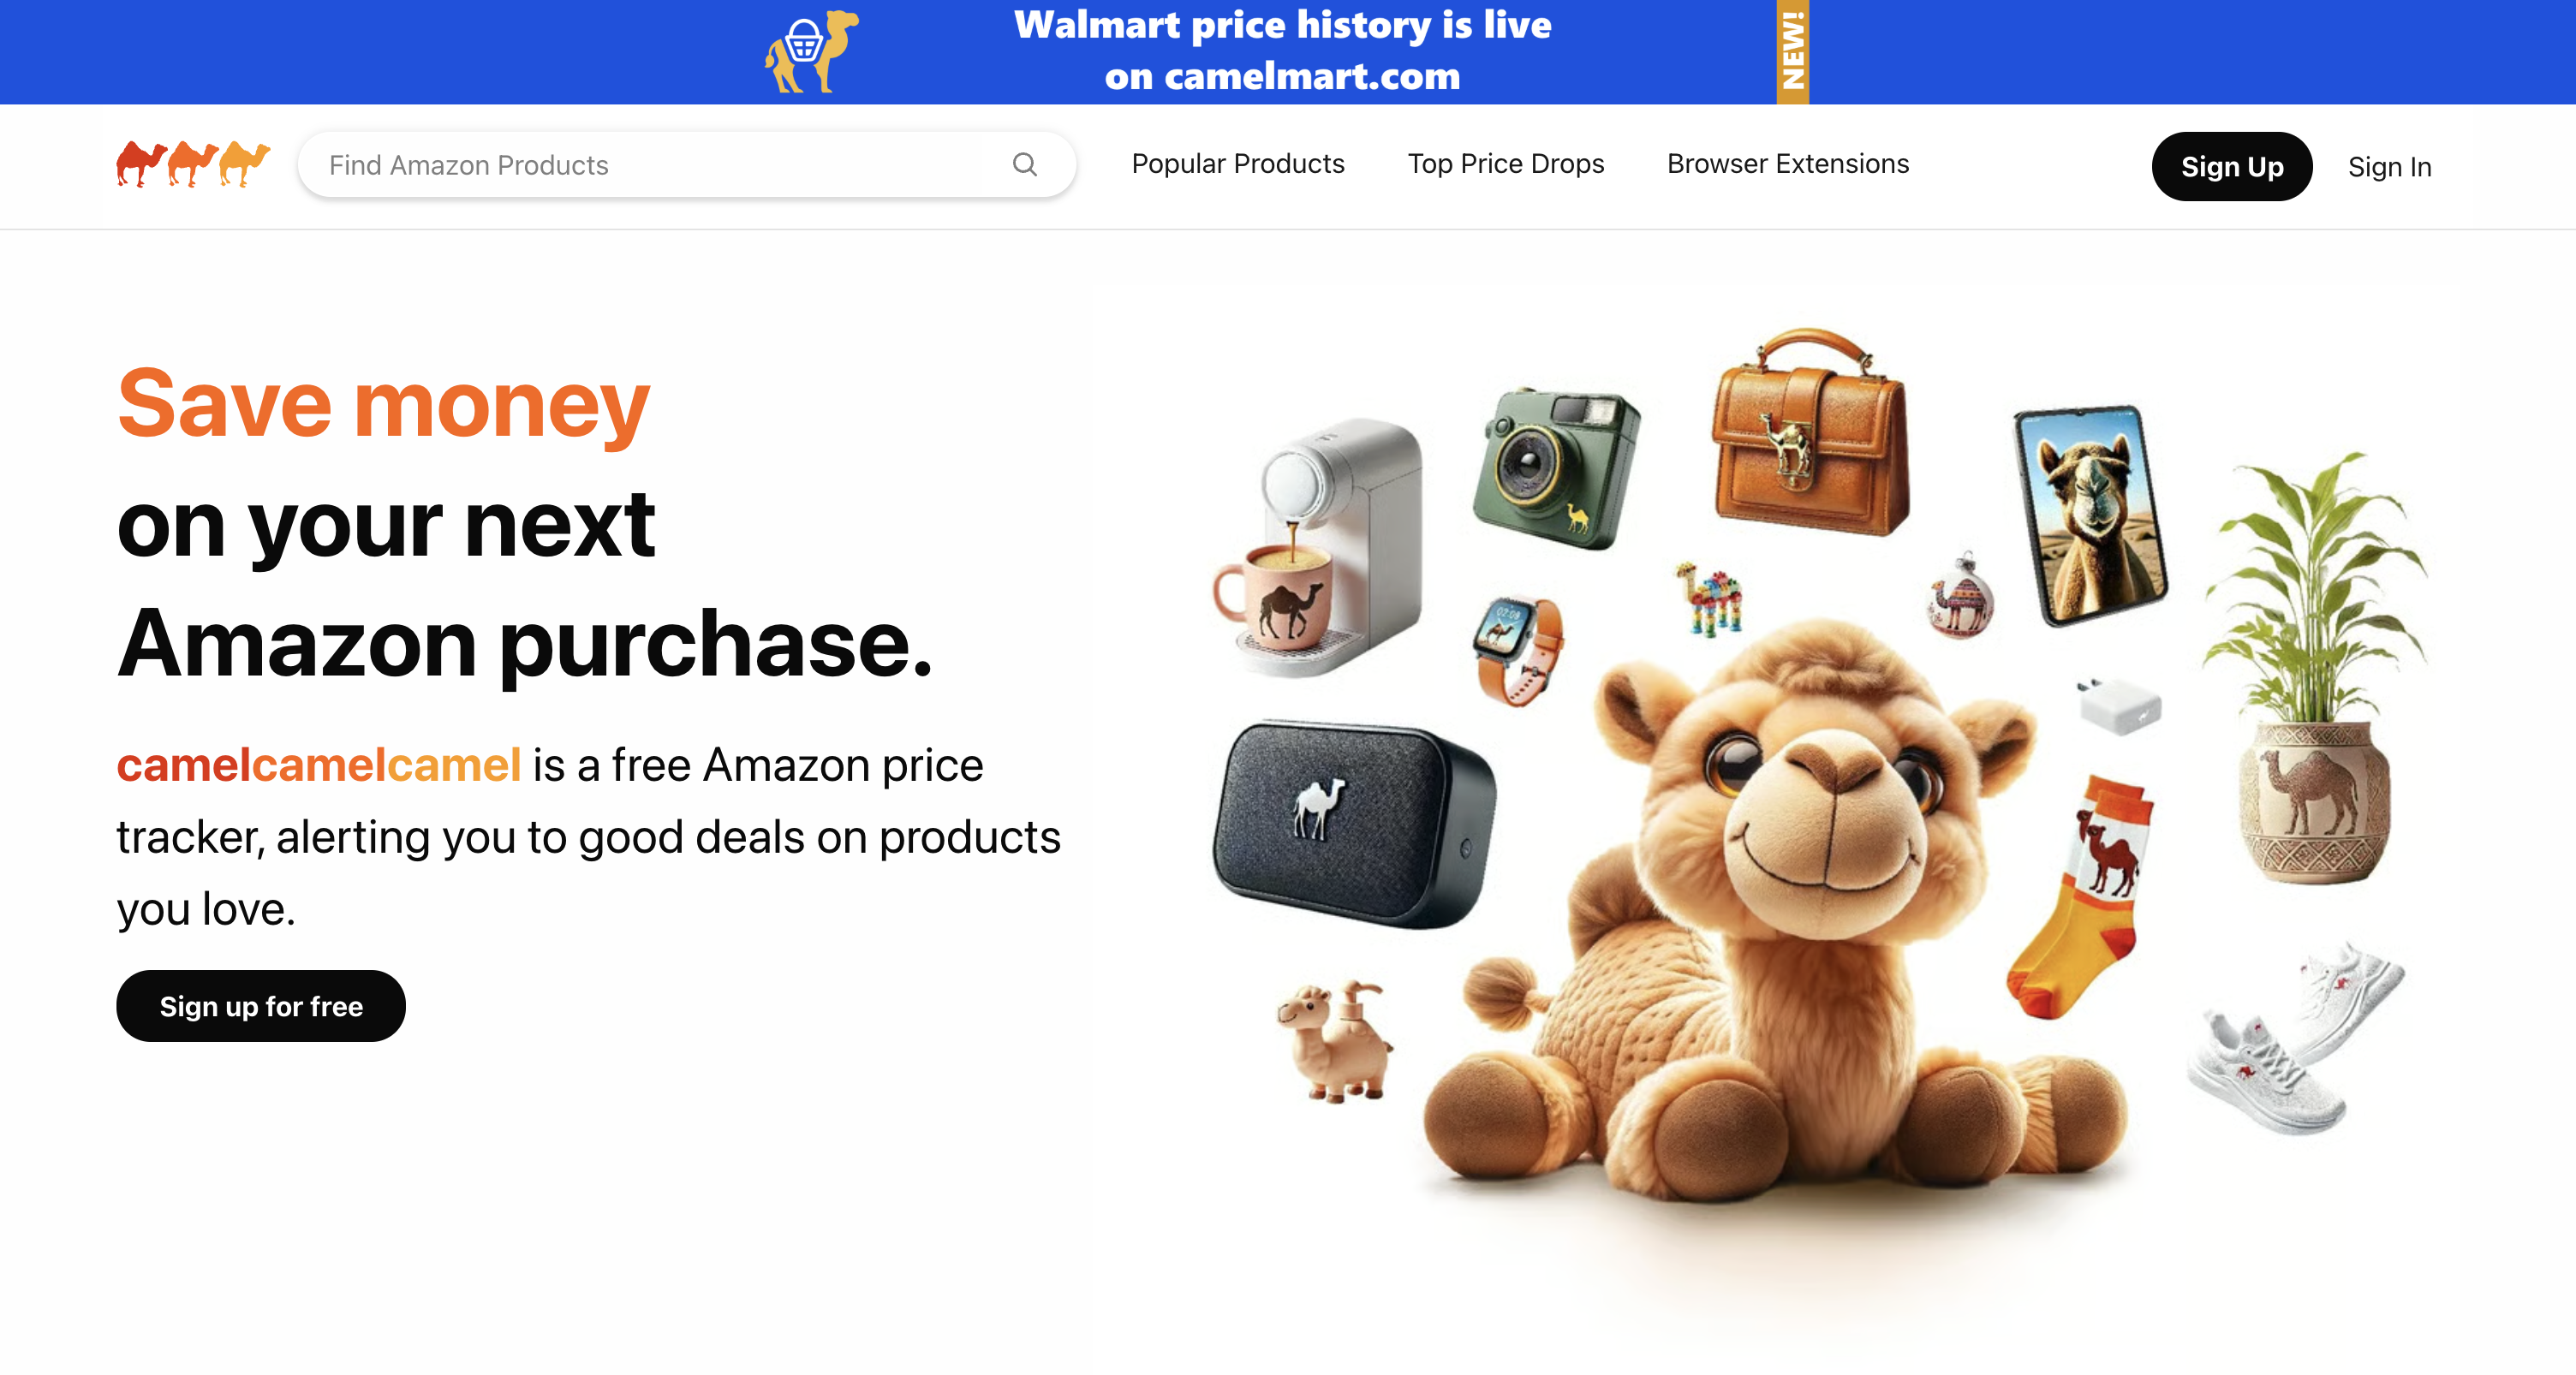
2. CamelCamelCamel: Best for Simple Amazon Price Tracking
CamelCamelCamel offers Amazon price history and price-drop alerts. If your main question is whether a product has become cheaper—or whether today’s price is unusually high—it is a straightforward option to consider.
Its appeal is simplicity. You do not need a broad marketplace research workflow just to monitor a purchase price.
Why consider it: Free price tracking and alerts for basic monitoring.
The trade-off: It is not a substitute for the brand, reseller, and market analysis discussed above. Sellers making inventory decisions may need additional research beyond price movement.
Best for: Shoppers and users whose main requirement is basic Amazon price history and alerts.
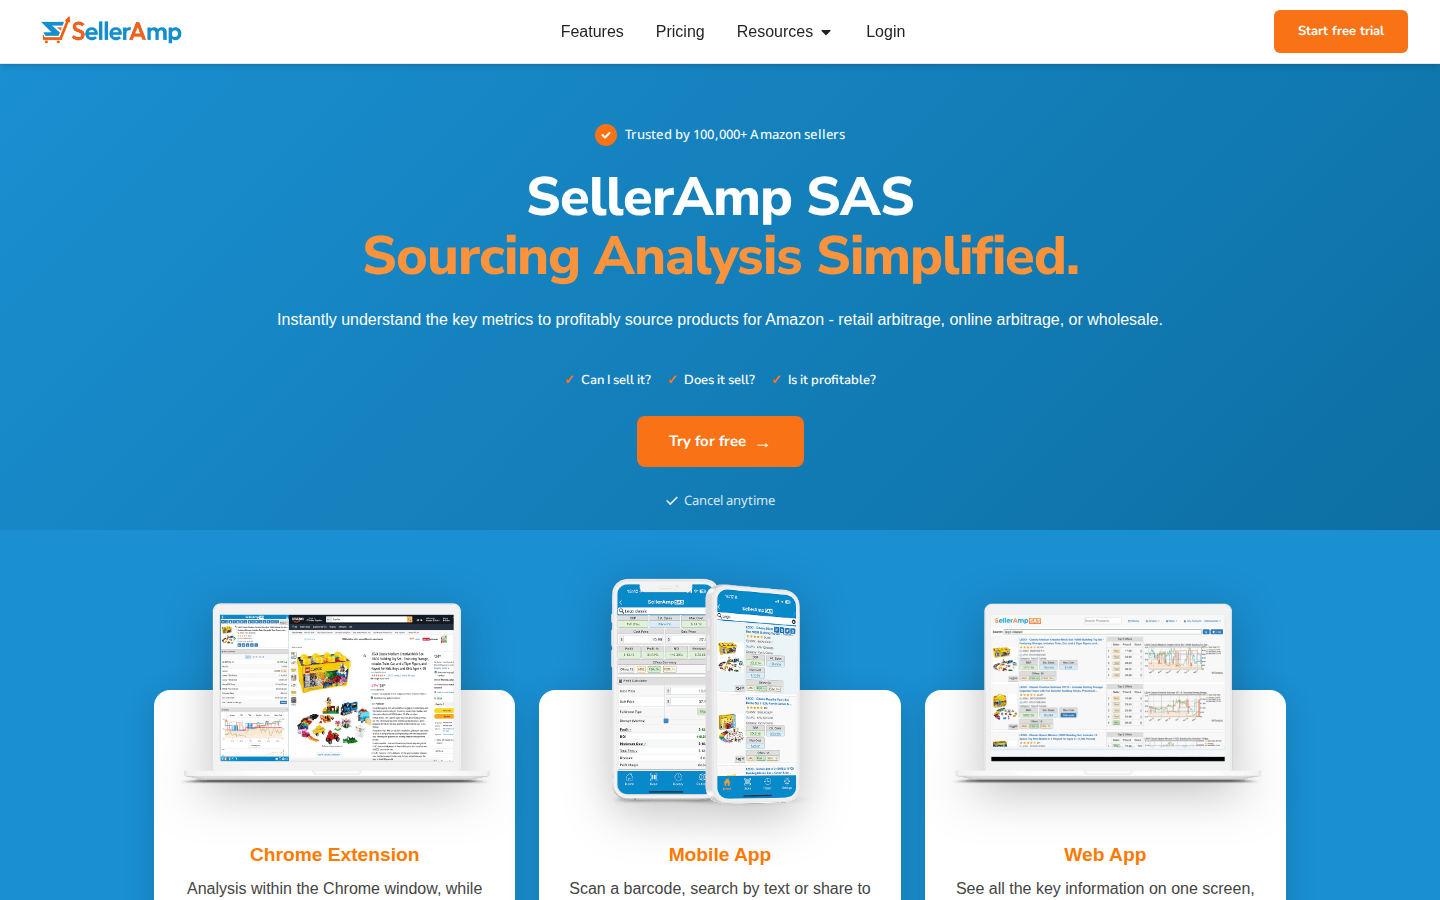
3. SellerAmp SAS: Best for Arbitrage Sourcing Workflows
SellerAmp SAS brings profitability analysis and sourcing information into a workflow for evaluating potential inventory purchases. Its web app includes a profit calculator, offers, alerts, rank and price information, and charts.
There is an important distinction for anyone comparing SellerAmp vs. Keepa: SellerAmp integrates Keepa-powered charts. It is an alternative way to work with sourcing information, rather than an independent replacement for Keepa’s underlying historical data.
If you want to evaluate a potential purchase with several sourcing checks in one place, that approach may fit your process well.
Why consider it: Convenient product-level sourcing and profitability analysis.
The trade-off: If your goal is to stop relying on Keepa data entirely, SellerAmp’s integrated charts do not accomplish that.
Best for: Retail and online arbitrage sellers evaluating individual purchasing opportunities.
4. Helium 10: Best for Product and Keyword Research
Helium 10 is worth considering when your needs extend from product analysis into keyword research. Its Chrome extension includes Xray for researching products on Amazon, and Xray Keywords supports keyword research in the browser.
That makes it relevant for sellers who want to investigate product opportunities and the search terms associated with them.
Why consider it: A broader product and keyword research workflow.
The trade-off: A larger research toolkit serves a different purpose from a dedicated historical price tracker. Compare the specific features you use in Keepa before assuming a broader subscription replaces them.
Best for: Sellers whose research priorities include both products and keywords.
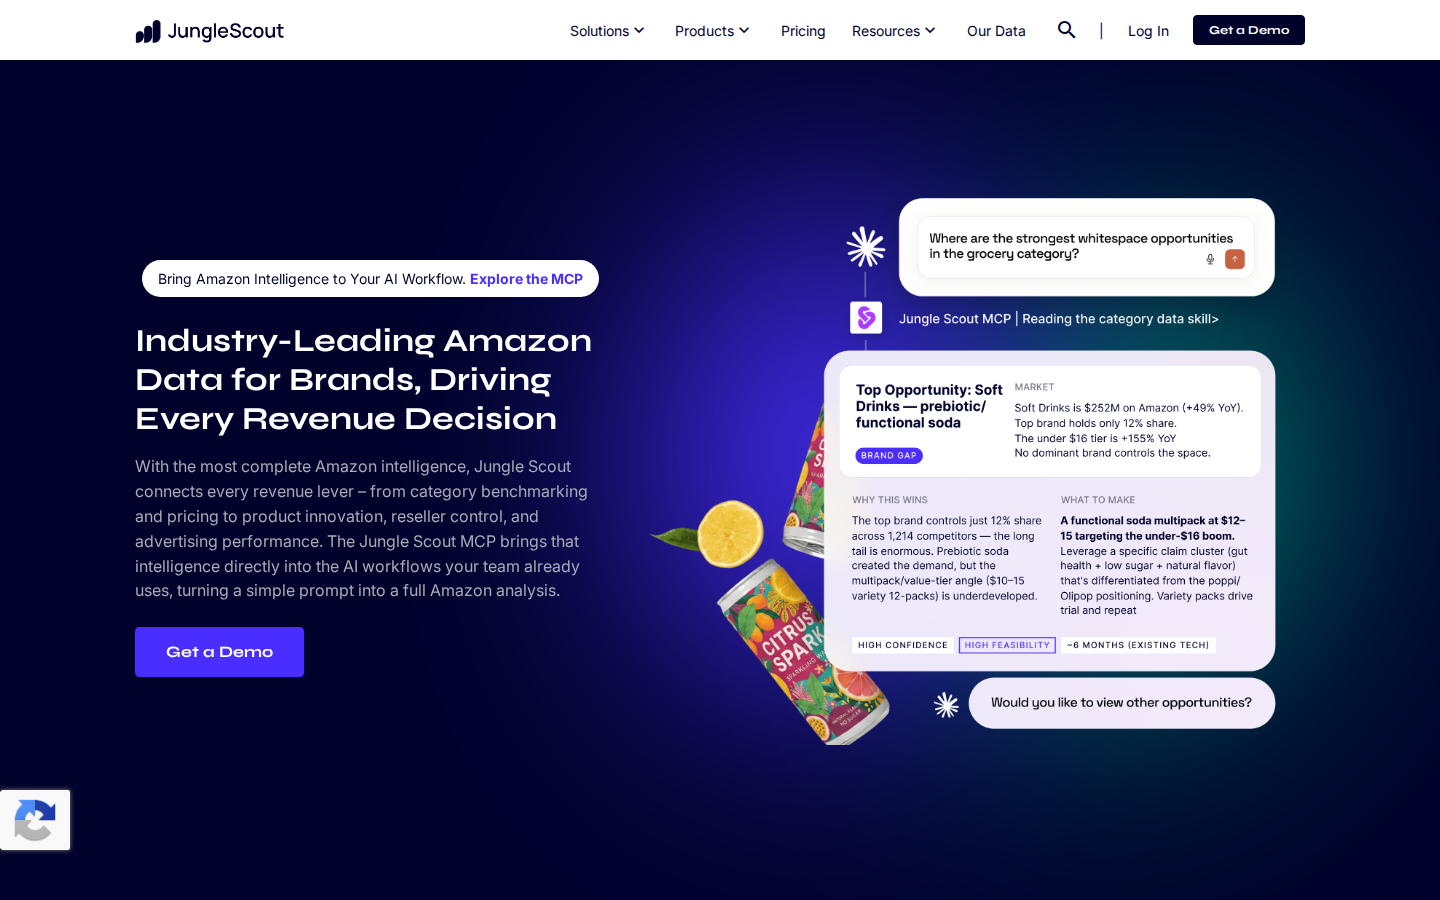
5. Jungle Scout: Best for Product Discovery and Validation
Jungle Scout combines a web application with a browser extension for Amazon research. Its extension provides product metrics and historical information, helping sellers evaluate opportunities while browsing Amazon.
A typical use case is discovering an idea through the web application and then examining similar listings through the extension to assess the surrounding market.
Why consider it: A connected workflow for finding product ideas and validating demand.
The trade-off: Historical product information does not automatically provide the same chart coverage or tracking workflow as Keepa. Choose based on the research tasks you actually need to complete.
Best for: Sellers exploring new products and comparing potential opportunities.
When Does It Make Sense to Keep Using Keepa?
A fair list of Keepa alternatives should acknowledge thatKeepa may already be a good fit.
If product price history and price-drop alerts are your main requirements, there may be no reason to change your workflow. Keepa also offers seller-oriented data tools beyond basic price charts, so it would be misleading to describe it as only a shopping price tracker.
The reason to consider SmartScout is the level at which you want to make decisions.
You might begin with a product question: “Does this listing deserve further research?” As your business grows, you may spend more time asking: “Which brands, sellers, and markets should we focus on?”
SmartScout is particularly useful for that second set of questions.
How to Choose the Right Keepa Alternative
Start with the work you want the software to help you do:
Understand brands and their resellers: Start with SmartScout.
Track a purchase price and receive alerts: Consider CamelCamelCamel.
Evaluate arbitrage purchases: Consider SellerAmp SAS, recognizing its use of Keepa data.
Research products and keywords: Consider Helium 10.
Discover and validate product ideas: Consider Jungle Scout.
Before switching, compare marketplace coverage, historical data availability, plan access, and the exact features you rely on. Sales and revenue estimates should be treated as estimates, not audited results.
Go From Product History to a Bigger View of Amazon
Keepa is a strong tool for many sellers. If it already answers your questions, it can remain part of your process.
If you want price history plus a clearer understanding of brands, the resellers behind them, and the markets they compete in, SmartScout is the Keepa alternative to start with.
Explore SmartScout and see how product-level research connects to your next business opportunity.




.png)