Key Takeaways
- Connect five data buckets before building any dashboard: advertising, retail, shopper intelligence, competitive intelligence, and client-specific data.
- Report TACoS and contribution margin per SKU together. TACoS alone can look healthy while margin quietly disappears.
- A healthy account-level TACoS runs 10-15% of revenue for an established seller; new launches run 25-40% in the first one to three months.
- Set cadence by metric: daily for Buy Box and stock, weekly for ACoS, monthly for TACoS, margin, and share of voice.
- Lead every client report with an executive summary and verdict, then back it up with detail, not the other way around.
A good Amazon agency reporting framework does two things at once: it proves the work is driving profit, not just ad clicks, and it gives your team a repeatable structure so reporting doesn't get rebuilt from scratch for every client.
Below is the framework we'd build for 2026: which data sources to connect, which KPIs actually matter, how often to report on each, and how to lay out the report itself.
Why Ad-Level Reporting Isn't Enough Anymore
Native Amazon reports are siloed by design.
Sales, ads, fees, and refunds each live in their own place, and none of them answer the question a client actually cares about: which SKUs are profitable once everything is accounted for.
Advertising cost of sale (ACoS) alone can look healthy while margin quietly disappears. A 28% ACoS can sit next to a 2026 fee stack that includes referral fees, FBA fulfillment, storage, and inbound placement charges, six or more layers deep, and none of that shows up in the ACoS number itself. A reporting framework built only on ad metrics will always miss this.
The Five Data Buckets Your Reports Need to Connect
Before picking KPIs, get the underlying data in one place. Agencies scaling reporting in 2026 are converging on five connected data sources:
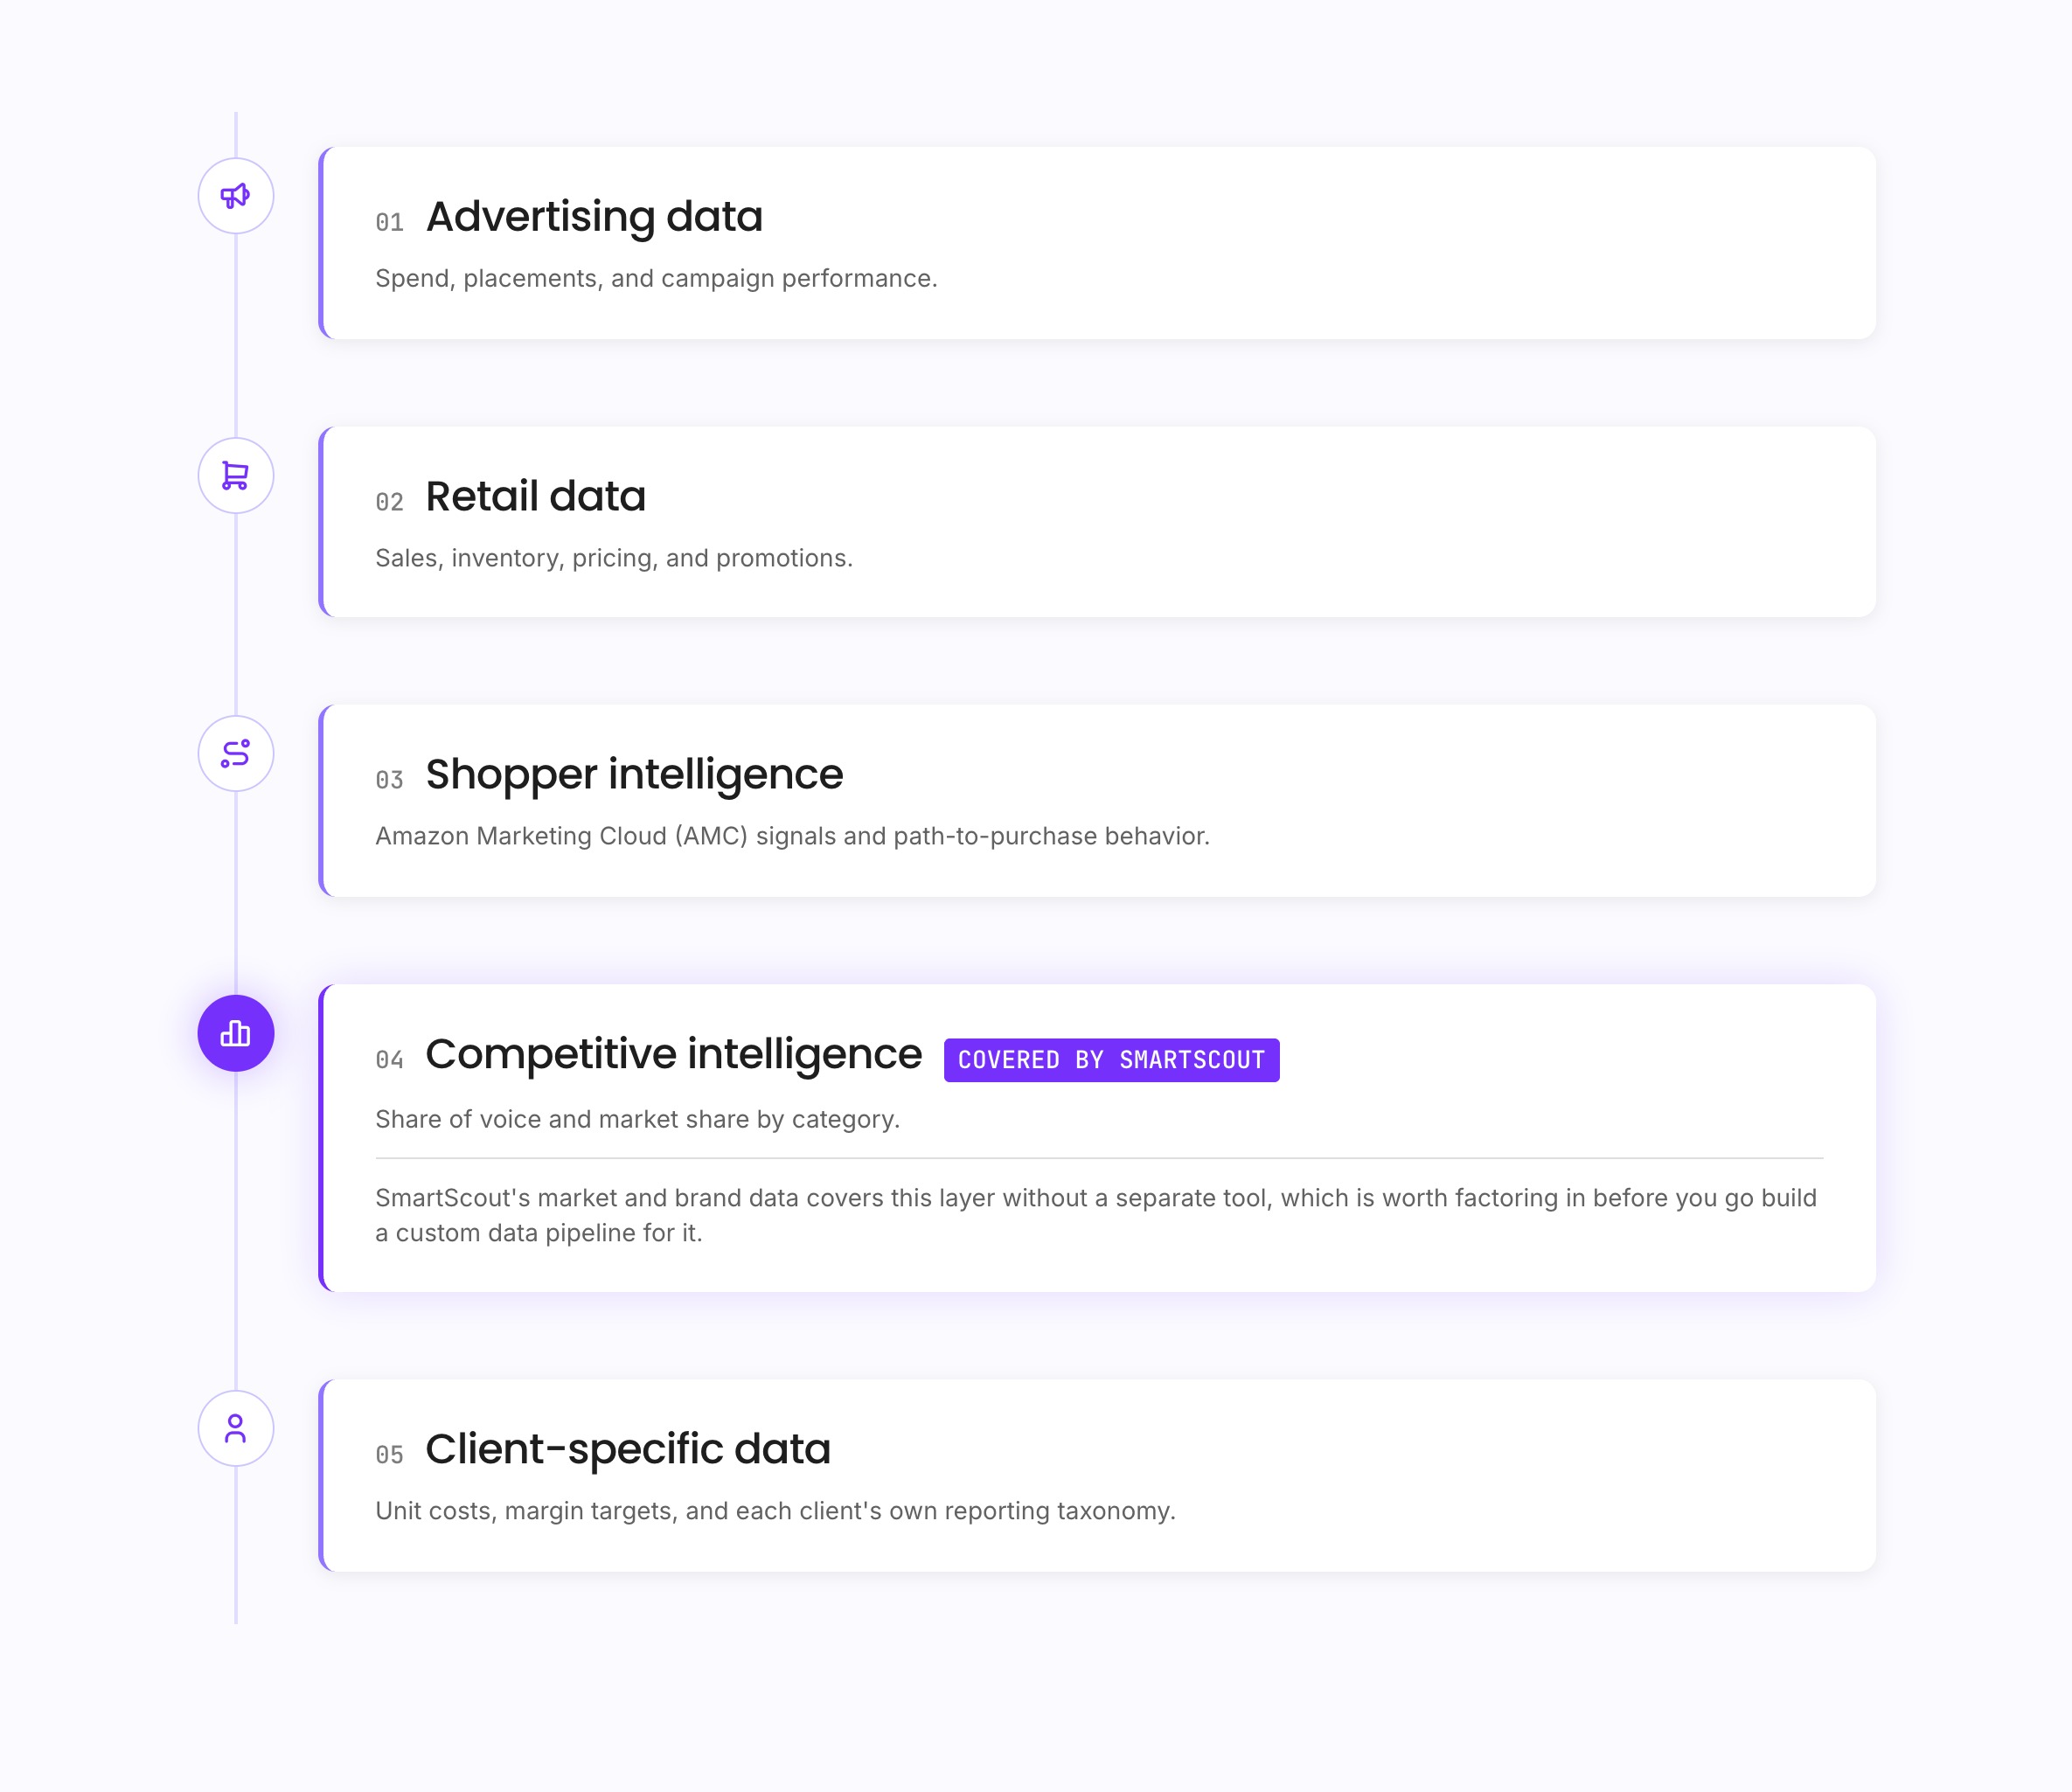
Reports built on advertising data alone will always look thinner than reports that connect all five. SmartScout's market and brand data covers the competitive intelligence layer without a separate tool, which is worth factoring in before you go build a custom data pipeline for it.
The Core KPIs
Two numbers should anchor every report:
TACoS (Total Advertising Cost of Sale) divides ad spend by total sales, both ad-attributed and organic, so it shows whether the account is growing overall or just shifting where sales come from. A healthy account-level TACoS runs 10 to 15% of total revenue for an established seller. New launches run higher, often 25 to 40% in the first one to three months, before organic rank compounds and the number comes down. Category sets a floor too: electronics tends to sit near 9%, while beauty and supplements run higher at 15 to 17%.
Contribution margin per SKU is the number TACoS can't give you on its own. It's selling price, minus cost of goods (product, freight, and prep), minus the Amazon referral fee, minus FBA fulfillment, minus storage. Two SKUs can carry the same TACoS and have completely different margins once that math runs. Report contribution margin alongside TACoS, not instead of it, so budget conversations are grounded in dollars, not just ratios.
Reporting Cadence
Not every metric needs the same attention. Daily checks catch problems before the client does. Monthly reports tell the growth story.
Building the Monthly Client Report
Structure the report so the client sees the verdict before the detail:
- Executive summary. TACoS and contribution margin trend, one paragraph, no jargon.
- KPI dashboard. The five metrics above, this month against last month and against the category benchmark.
- What changed and why. Tie any TACoS or margin shift to a specific cause: a fee change, a stockout, a new competitor, a bid adjustment.
- Next month's plan. Two or three specific actions, not a general strategy recap.
Agencies that skip straight to campaign-level detail lose the client's attention before they get to the part that matters. Lead with the verdict, then back it up. If your team is spending most of a reporting cycle exporting and reformatting data by hand, that's usually a sign the underlying tooling needs a second look rather than the framework itself.
Our guide to Amazon analytics platforms for agencies walks through what to look for there, and our agency-specific SmartScout setup guide covers how to plug this framework into a live account.
FAQs
What KPIs should an Amazon agency report on every month?

At minimum, TACoS and contribution margin per SKU, reported together, plus share of voice for competitive context. Daily and weekly metrics like Buy Box status and campaign-level ACoS support those monthly numbers but don't replace them.
What's a healthy TACoS for an Amazon account?
Roughly 10 to 15% of total revenue for an established seller. New product launches typically run 25 to 40% in the first one to three months before organic rank brings the number down. The floor also shifts by category, running lower for electronics and higher for beauty and supplements.
Why isn't ACoS enough to judge account performance on its own?
ACoS only measures ad spend against ad-attributed sales. It says nothing about product cost, referral fees, FBA fulfillment, or storage, so an account can hit its ACoS target every month while margin quietly erodes underneath it.
How often should agencies report to Amazon clients?
Split it by metric, not by a single fixed schedule. Buy Box and stock issues need daily eyes, campaign-level ACoS needs weekly review, and account-level TACoS, contribution margin, and share of voice belong in a monthly report.
What data should agencies connect before building a reporting dashboard?
Five sources: advertising data, retail data (sales, inventory, pricing), shopper intelligence such as Amazon Marketing Cloud, competitive intelligence, and each client's own cost and margin data. Reports built on advertising data alone will always read thinner than reports that connect all five.
.png)