Most Recent
Amazon Marketing
Selling on Amazon

Amazon Seller Statistics (2026) – Sales Data, Growth & Trends

25+ “How to Sell on Amazon” Courses, Mentorships, and Trainings

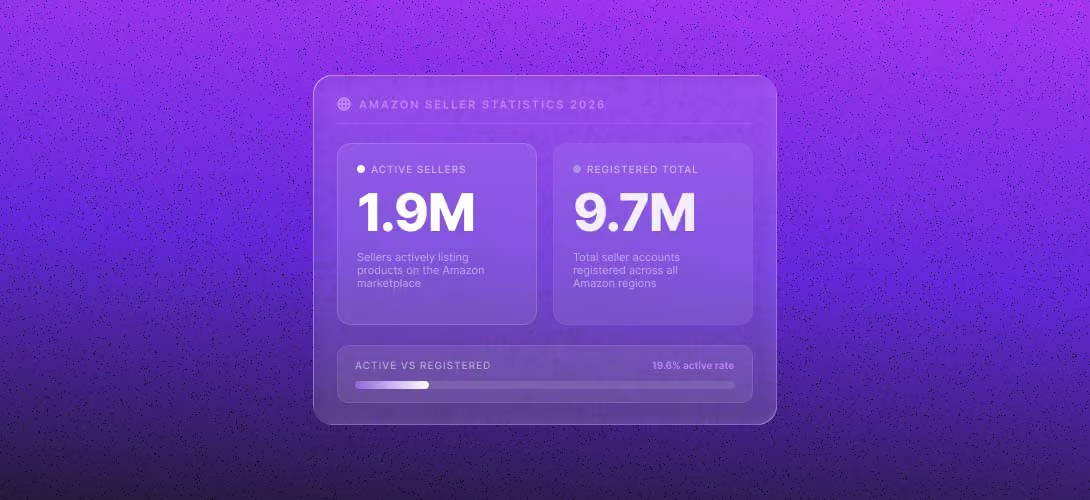
Amazon has about 1.9 million active sellers throughout the world, with over 177 orders per second being placed through the marketplace. It leads in retail e-commerce in the US market with a 40.5% share of the market, while Walmart has 9.2%. The third-party sellers now contribute to almost 69% of Amazon’s GMV.

We have provided you with a statistical report on Amazon sellers, the marketplace, and sales trends.

Amazon Seller Statistics 2026: Key Highlights

  • Amazon had 1.9 million active sellers globally in 2025, with 9.7 million active sellers.

  • Amazon holds 40.5% of the US e-commerce market.

  • Third-party sellers generated approximately $575 billion in GMV.

  • Over 100,000 Amazon sellers now earn $1 million annually.

  • Amazon closed 2025 with $716.9 billion in total net sales.

  • 82% of all active Amazon sellers currently use FBA.

How Many Sellers Does Amazon Have?


9.7 million sellers have ever registered with Amazon as sellers. That figure includes dormant accounts, suspended sellers, and businesses that tried and stopped.

There were around 1.9 million sellers who were active across the world by the year 2025, as compared to 2.4 million active sellers in 2021.

The table below illustrates the number of active Amazon sellers each year:

Active Amazon Sellers by Year

Year Active Sellers (Millions) Third-Party Sales Share Daily New Sellers
2021 2.4 million 57% 4,000+
2022 2.2 million 58% 3,200
2023 2 million 60% 750
2024 1.9 million 60% 600
2025 1.9 million 60% 550


Traffic per active seller has increased 31% since 2021, meaning each surviving seller is reaching a larger audience than before.

The number of Amazon's new vendors decreased by 44% in 2025 compared to 2024 and amounted to only 165,000, which is the lowest value in over ten years.

There are more than 100,000 vendors on Amazon generating more than $1 million a year; that is almost double the number of those vendors, who were around 60,000 in 2021.

In 2025 alone, more than 75,000 independent sellers crossed $1 million in sales in Amazon, marking a 36% increase from 2024.

Additionally, there have been 235 vendors making more than $100 million every year, as against 50 four years ago.

The United States remains the largest single country by seller volume, with around 37.82% of all registered sellers.

China-based sellers have grown rapidly and now represent roughly 35.1% of Amazon's third-party revenue, while the UK accounts for about 9.54% of the global seller base.

Source: Ecomranker, Sumtracker, Red Stag, Seller Report, Amz Prep, About Amazon, Amazon Seller Central, Yahoo

Average Number Of Listings Per Amazon Seller


In the 2025 seller survey conducted by Jungle Scout, 26% of the sellers have only one product listed, while 77% have less than 10 products listed.

The calculated weighted average of the number of listings per seller is about 8.3. However, the picture changes when considering the median, since a median seller has three listings.

74% of Amazon sellers started with less than $5,000 in total investment, which naturally limits initial catalog size.

FBA sellers, who represent 82% of all active sellers, tend to maintain smaller catalogs than FBM sellers.

Source: Red Stag

How Many Products Does Amazon Have?


Approximately 600 million products are listed across Amazon's global marketplaces.

Product Catalog Size by Retailer

The table below compares total product catalog sizes across major e-commerce retailers:

Product Catalog Size by Retailer

Retailer Number of Products
Amazon 600 million
Walmart 420 million
Wayfair 30 million
Target 2 million


Only around 12 million products are sold directly by Amazon's retail arm. The remaining 588 million-plus listings come from independent third-party sellers, representing about 97.9% of the total catalog.

Amazon's catalog sat at nearly 350 million products as recently as 2019. The growth since then has come almost entirely from marketplace sellers, not Amazon's own retail operations.

Source: LandingCube, Capital One Shopping

Amazon Market Share


The percentage of market share held by Amazon in the US retail e-commerce industry was approximately 40.5% in 2025.
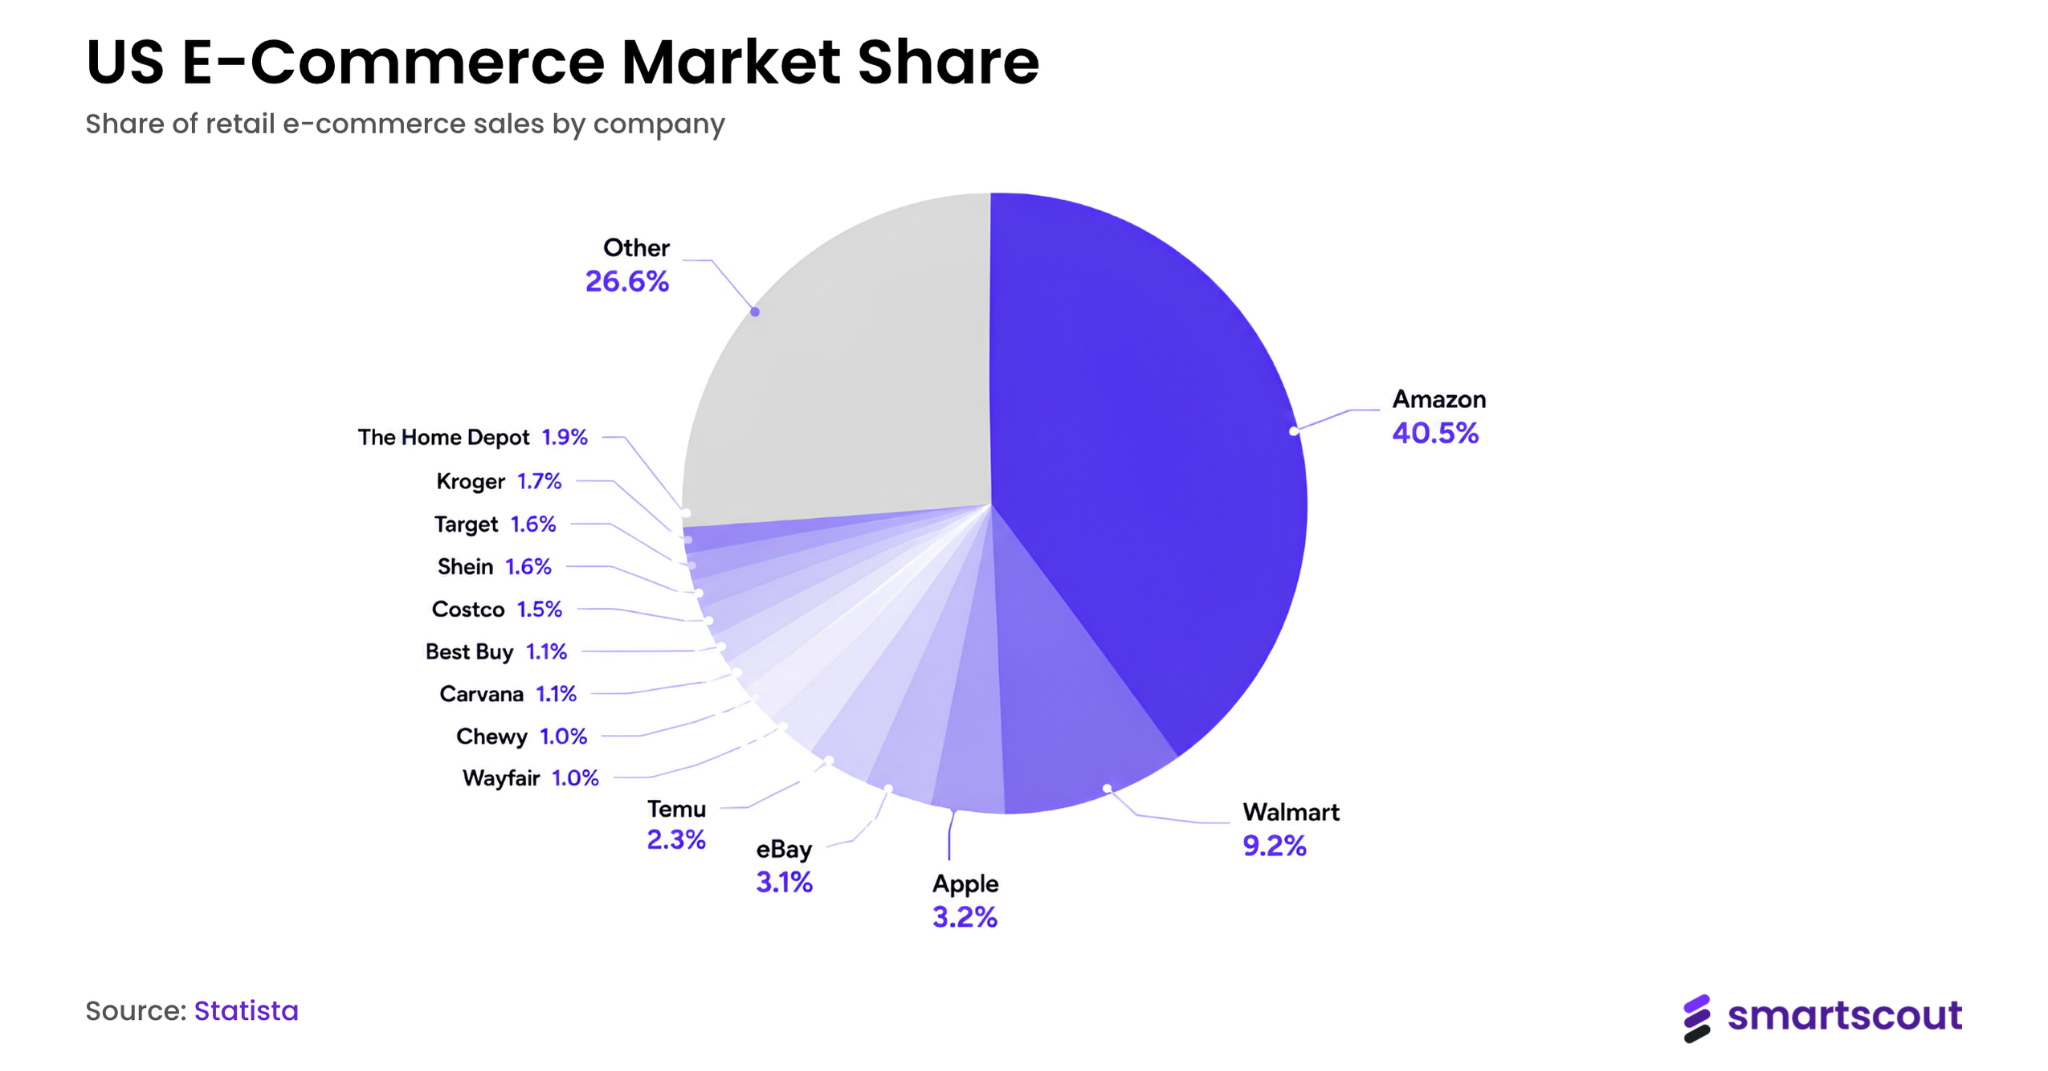
This is a table depicting the market share percentages of all the retailers in US retail e-commerce sales:

US E-Commerce Market Share

Company Share of Retail E-Commerce Sales
Amazon 40.5%
Walmart 9.2%
Apple 3.2%
Tesla 3.1%
eBay 2.8%
Temu 2.3%
The Home Depot 1.9%
Kroger 1.7%
Target 1.6%
Shein 1.6%
Costco 1.5%
Best Buy 1.1%
Carvana 1.1%
Chewy 1%
Wayfair 1%
Other 26.6%

Source: Statista

Amazon Marketplace Statistics


Amazon attracted approximately 2.6 billion web visits per month to Amazon.com, the highest of any e-commerce site globally. The US accounts for over 86% of that traffic, with users spending an average of 5 minutes and 54 seconds per session.

Today, Amazon has over 310 million active users across the globe. As per the latest reports, Amazon Prime subscribers have grown to more than 230 million from 46 million in 2015.

Prime subscription is key to the performance of sellers on the platform since 73 percent of customers list fast, free shipping as their primary motivation to shop at Amazon.

Third-party sellers now define the marketplace's character. Third-party GMV reached approximately $575 billion in 2025, representing roughly 69% of Amazon's total marketplace GMV, up from 60% in 2019.

In unit terms, third-party sellers accounted for 61% of all paid units sold on Amazon in Q4 2025.

By 2025, approximately 900,000 Amazon sellers were using AI tools to generate or refine product listings, cutting average listing creation time from 4 hours to 30 to 45 minutes per product.

A further 1.3 million sellers used Amazon's own generative AI listing tools by Q3 2025.

Source: Amazon, amzmonitor, Similarweb, Business Wire, Red Stag, CNBC, Business Of Apps, Seller Assistant, Marketplace Pulse

Amazon Sales Statistics


Amazon closed 2025 with $716.9 billion in total net sales, a 12% increase from the prior year. That figure likely places Amazon ahead of Walmart globally for the first time.

Q4 2025 alone generated $213.4 billion in net sales, a 13.6% jump year over year, reflecting the strength of the holiday quarter.

AWS generated $128.7 billion in revenue in 2025, accounting for roughly 57% of Amazon's total operating profit, even though it represents a minority of total sales.

Amazon's operating income reached approximately $80 billion in 2025 at an 11.2% margin, driven by efficiency gains in logistics and strong performance from AWS and advertising.

Source: Yahoo, Amazon SEC, Landing Cube

How Many Products Does Amazon Sell Per Day


US-based third-party sellers alone sold around 8,600 products per minute on Amazon in 2025. That amounts to approximately 12 million items sold daily through US third-party sellers.

In an average minute, shoppers buy around 8,900 items from Amazon sellers across the marketplace. Amazon processes roughly 177 orders per second globally and ships an estimated 20 to 25 million packages per day worldwide.

The table below breaks down Amazon's global order volume and dollar sales by time period:

Amazon Global Order Volume and Product Sales

Duration Number of Orders Product Sales Dollars
Second 177 $9,395
Minute 10,591 $563,672
Hour 635,481 $33,820,320
Day 15,251,553 $811,687,671
Week 106,760,874 $5,697,423,077
Month 463,901,416 $24,688,833,333
Fiscal quarter 1,391,704,247 $74,066,500,000
Year 5,566,816,986 $296,266,000,000


Source: Capital One Shopping 1, Capital One Shopping 2, Red StageDesk

Amazon Sales Data by Product


According to the SmartScout database, Health & Household leads all Amazon categories in monthly revenue at $4.44 billion, followed closely by Home & Kitchen at $4.23 billion. Together, the top 10 categories generate over $27 billion per month in marketplace sales.
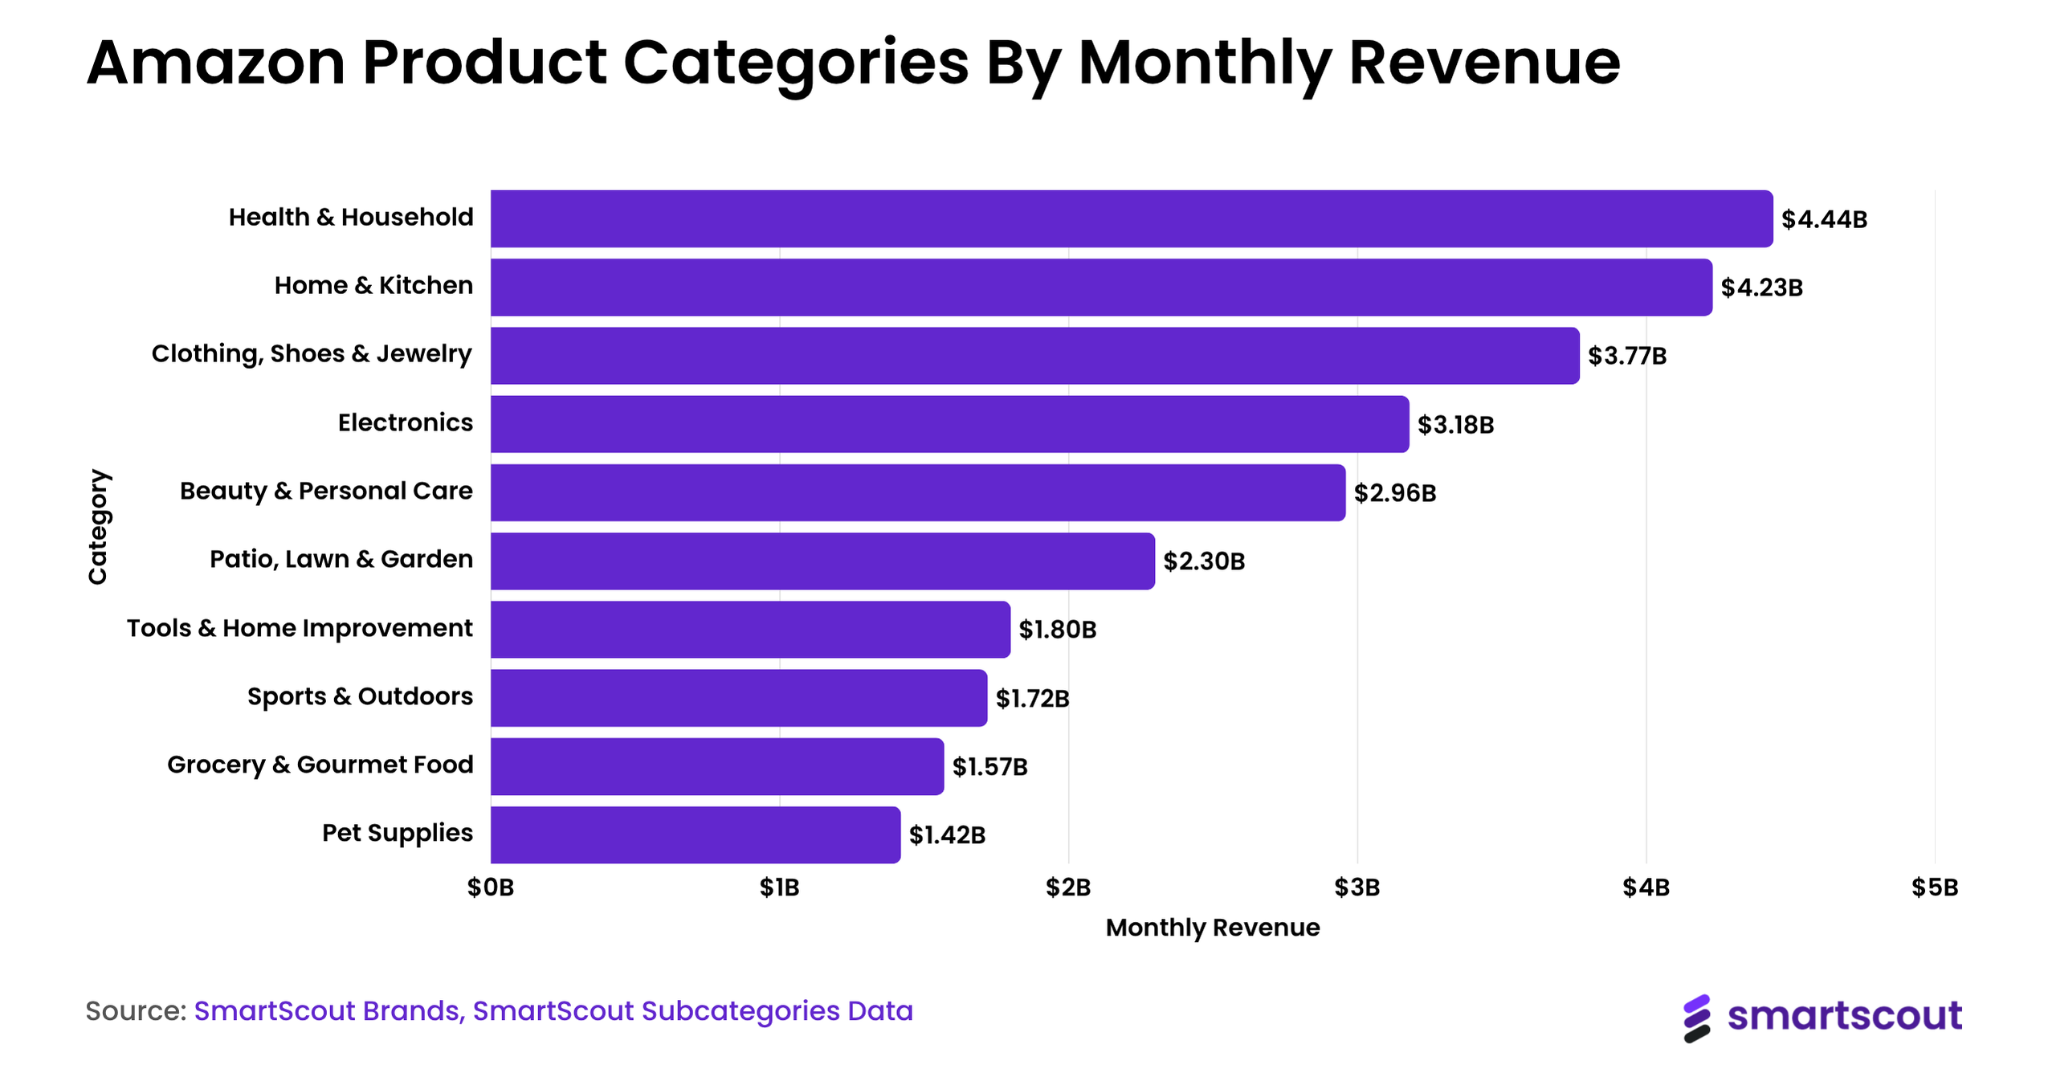
The table below ranks the top 10 Amazon product categories by monthly revenue, along with key competitive metrics:

Top Amazon Product Categories by Monthly Revenue

Rank Category Monthly Revenue Brands Avg Sellers/Listing YoY Growth
1 Health & Household $4.44B 85,474 207 +30%
2 Home & Kitchen $4.23B 100,313 445 +9%
3 Clothing, Shoes & Jewelry $3.77B 57,623 124 -12%
4 Electronics $3.18B 41,983 202 +21%
5 Beauty & Personal Care $2.96B 67,065 222 +27%
6 Patio, Lawn & Garden $2.30B 59,872 144 +12%
7 Tools & Home Improvement $1.80B 83,825 116 +3%
8 Sports & Outdoors $1.72B 74,498 140 +8%
9 Grocery & Gourmet Food $1.57B 42,113 55 +24%
10 Pet Supplies $1.42B 54,666 105 +16%


Home & Kitchen has the highest number of active brands at over 100,000, while also showing the most intense competition with an average of 445 sellers per listing.

At the brand level, Apple leads Amazon's marketplace with $431 million in monthly revenue, driven primarily by traditional laptop sales. Amazon's own brands, Amazon Basics and Amazon, rank second and fifth, respectively, with near-total single-seller control over their listings.


The table below shows the top 10 brands on Amazon by monthly revenue:

Top Brands on Amazon by Monthly Revenue

Rank Brand Monthly Revenue Category / Subcategory Avg Sellers/Listing YoY Growth
1 Apple $431M Electronics - Traditional Laptops 2.5 +5%
2 Amazon Basics $210M Health & Household - Copy & Multipurpose Paper 0.71 +29%
3 Samsung $205M Electronics - Cell Phones 2.5 +39%
4 HP $143M Office Products - Inkjet Ink Cartridges 2.9 +17%
5 Amazon $111M Electronics - eBook Readers 0.56 +34%
6 Shark $98M Home & Kitchen - Upright Vacuums 1.4 +42%
7 Ninja $91M Kitchen & Dining - Air Fryers 1.3 +37%
8 Generic* $89M Grocery & Gourmet Food - Squeeze Toys 0.85 +2%
9 Sony $77M Electronics - Mirrorless Cameras 4.4 +15%
10 VEVOR $75M Patio, Lawn & Garden - Ice Machines 1.65 +47%
*Generic refers to unbranded or white-label products sold without a registered brand name on Amazon.

*Generic refers to unbranded or white-label products sold without a registered brand name on Amazon. SmartScout aggregates all such listings under this label.

Source: SmartScout Brands, SmartScout Subcategories Data

Amazon FBA Statistics


Approximately 82% of active Amazon sellers use FBA, either exclusively or as part of a hybrid model. That figure has risen steadily from around 50% in 2019.
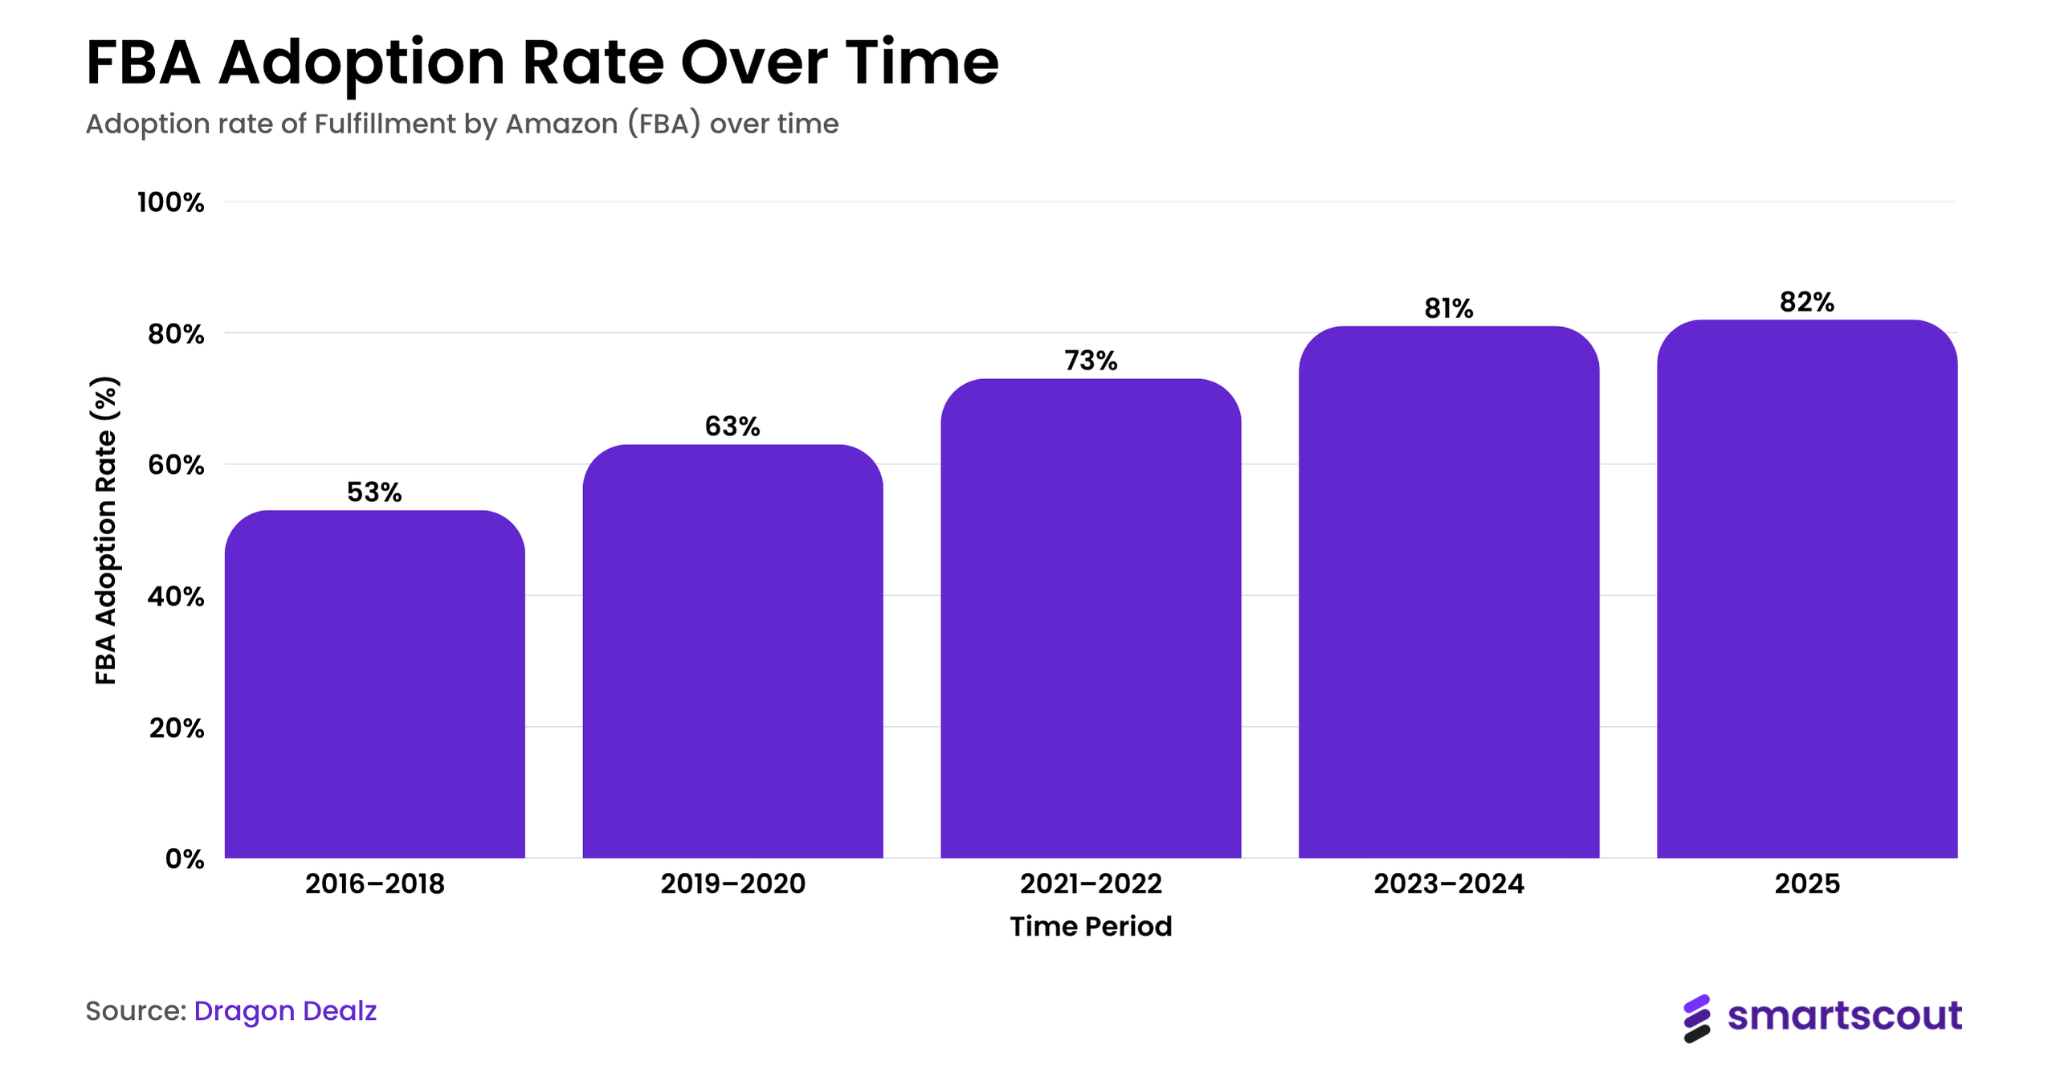


Here is a table displaying Amazon FBA adoption rates across different time periods:

FBA Adoption Rate Over Time

Time Period FBA Adoption Rate
2016-2018 53%
2019-2020 63%
2021-2022 73%
2023-2024 81%
2025 82%


When you add referral fees, FBA fulfillment fees, storage charges, and advertising, the average FBA seller pays 30% to 35% of revenue back to Amazon.

After accounting for those costs and the cost of goods, the average FBA seller earns a net profit margin of 15% to 20%.

Approximately 64% of Amazon FBA sellers achieve profitability within their first 12 months.

Over 800,000 brands are now enrolled in Amazon's Brand Registry, a 20% increase from the previous year. In 2024, Amazon's proactive controls blocked more than 99% of suspected infringing listings before brand owners had to find and report them.

Source: Thunderbit, Red Stag, Novadata

Amazon vs. eBay Seller Statistics


Amazon has approximately 9.7 million active sellers globally. eBay hosts approximately 17.6 million sellers, a number that is larger on paper but reflects a very different seller mix.
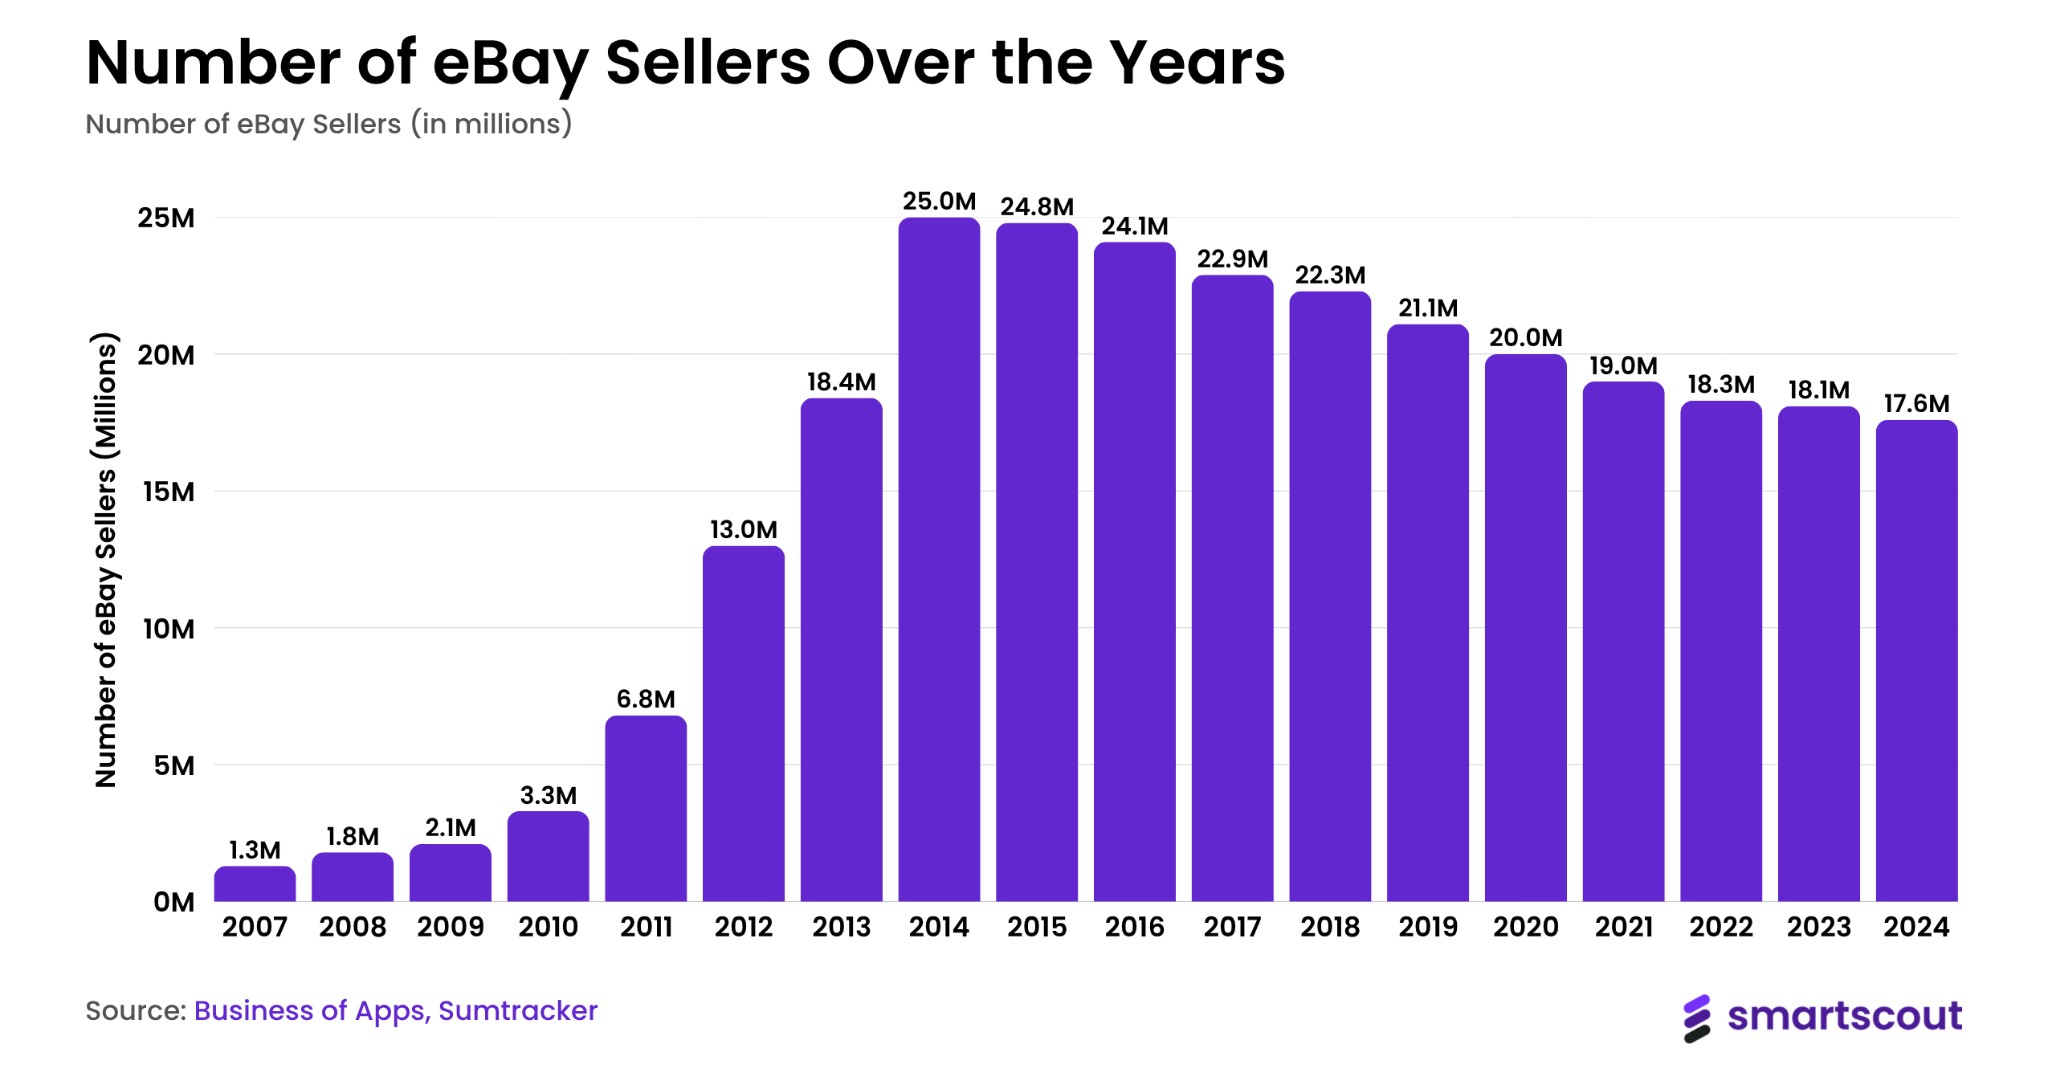
The table below tracks eBay's total seller count from 2007 through 2024:

Number of eBay Sellers Over the Years

Year Number of eBay Sellers
2007 1.3 million
2008 1.8 million
2009 2.1 million
2010 3.3 million
2011 6.8 million
2012 13.0 million
2013 18.4 million
2014 25.0 million
2015 24.8 million
2016 24.1 million
2017 22.9 million
2018 22.3 million
2019 21.1 million
2020 20.0 million
2021 19.0 million
2022 18.3 million
2023 18.1 million
2024 17.6 million


eBay includes millions of casual, consumer-to-consumer sellers listing secondhand goods alongside professional merchants.

Amazon's global GMV reached approximately $830 billion in 2025. eBay's full-year 2025 GMV came in at $79.6 billion. Amazon's marketplace is more than ten times larger in gross merchandise volume.

Amazon's average order value sits around $52, while eBay's is approximately $48. The pricing gap is narrow, but the purchase intent is completely different.

Source: Search Lab, Business of Apps. Sumtracker, DMR, Novadata

Start using SmartScout with Risk-Free pricing

7-day money back guarantee, cancel at any time
Back

Amazon Seller Statistics (2026) – Sales Data, Growth & Trends

Most Recent
Amazon Marketing
Selling on Amazon
7.14.26
0
Min

Amazon has about 1.9 million active sellers throughout the world, with over 177 orders per second being placed through the marketplace. It leads in retail e-commerce in the US market with a 40.5% share of the market, while Walmart has 9.2%. The third-party sellers now contribute to almost 69% of Amazon’s GMV.

We have provided you with a statistical report on Amazon sellers, the marketplace, and sales trends.

Amazon Seller Statistics 2026: Key Highlights

  • Amazon had 1.9 million active sellers globally in 2025, with 9.7 million active sellers.

  • Amazon holds 40.5% of the US e-commerce market.

  • Third-party sellers generated approximately $575 billion in GMV.

  • Over 100,000 Amazon sellers now earn $1 million annually.

  • Amazon closed 2025 with $716.9 billion in total net sales.

  • 82% of all active Amazon sellers currently use FBA.

How Many Sellers Does Amazon Have?


9.7 million sellers have ever registered with Amazon as sellers. That figure includes dormant accounts, suspended sellers, and businesses that tried and stopped.

There were around 1.9 million sellers who were active across the world by the year 2025, as compared to 2.4 million active sellers in 2021.

The table below illustrates the number of active Amazon sellers each year:

Active Amazon Sellers by Year

Year Active Sellers (Millions) Third-Party Sales Share Daily New Sellers
2021 2.4 million 57% 4,000+
2022 2.2 million 58% 3,200
2023 2 million 60% 750
2024 1.9 million 60% 600
2025 1.9 million 60% 550


Traffic per active seller has increased 31% since 2021, meaning each surviving seller is reaching a larger audience than before.

The number of Amazon's new vendors decreased by 44% in 2025 compared to 2024 and amounted to only 165,000, which is the lowest value in over ten years.

There are more than 100,000 vendors on Amazon generating more than $1 million a year; that is almost double the number of those vendors, who were around 60,000 in 2021.

In 2025 alone, more than 75,000 independent sellers crossed $1 million in sales in Amazon, marking a 36% increase from 2024.

Additionally, there have been 235 vendors making more than $100 million every year, as against 50 four years ago.

The United States remains the largest single country by seller volume, with around 37.82% of all registered sellers.

China-based sellers have grown rapidly and now represent roughly 35.1% of Amazon's third-party revenue, while the UK accounts for about 9.54% of the global seller base.

Source: Ecomranker, Sumtracker, Red Stag, Seller Report, Amz Prep, About Amazon, Amazon Seller Central, Yahoo

Average Number Of Listings Per Amazon Seller


In the 2025 seller survey conducted by Jungle Scout, 26% of the sellers have only one product listed, while 77% have less than 10 products listed.

The calculated weighted average of the number of listings per seller is about 8.3. However, the picture changes when considering the median, since a median seller has three listings.

74% of Amazon sellers started with less than $5,000 in total investment, which naturally limits initial catalog size.

FBA sellers, who represent 82% of all active sellers, tend to maintain smaller catalogs than FBM sellers.

Source: Red Stag

How Many Products Does Amazon Have?


Approximately 600 million products are listed across Amazon's global marketplaces.

Product Catalog Size by Retailer

The table below compares total product catalog sizes across major e-commerce retailers:

Product Catalog Size by Retailer

Retailer Number of Products
Amazon 600 million
Walmart 420 million
Wayfair 30 million
Target 2 million


Only around 12 million products are sold directly by Amazon's retail arm. The remaining 588 million-plus listings come from independent third-party sellers, representing about 97.9% of the total catalog.

Amazon's catalog sat at nearly 350 million products as recently as 2019. The growth since then has come almost entirely from marketplace sellers, not Amazon's own retail operations.

Source: LandingCube, Capital One Shopping

Amazon Market Share


The percentage of market share held by Amazon in the US retail e-commerce industry was approximately 40.5% in 2025.

This is a table depicting the market share percentages of all the retailers in US retail e-commerce sales:

US E-Commerce Market Share

Company Share of Retail E-Commerce Sales
Amazon 40.5%
Walmart 9.2%
Apple 3.2%
Tesla 3.1%
eBay 2.8%
Temu 2.3%
The Home Depot 1.9%
Kroger 1.7%
Target 1.6%
Shein 1.6%
Costco 1.5%
Best Buy 1.1%
Carvana 1.1%
Chewy 1%
Wayfair 1%
Other 26.6%

Source: Statista

Amazon Marketplace Statistics


Amazon attracted approximately 2.6 billion web visits per month to Amazon.com, the highest of any e-commerce site globally. The US accounts for over 86% of that traffic, with users spending an average of 5 minutes and 54 seconds per session.

Today, Amazon has over 310 million active users across the globe. As per the latest reports, Amazon Prime subscribers have grown to more than 230 million from 46 million in 2015.

Prime subscription is key to the performance of sellers on the platform since 73 percent of customers list fast, free shipping as their primary motivation to shop at Amazon.

Third-party sellers now define the marketplace's character. Third-party GMV reached approximately $575 billion in 2025, representing roughly 69% of Amazon's total marketplace GMV, up from 60% in 2019.

In unit terms, third-party sellers accounted for 61% of all paid units sold on Amazon in Q4 2025.

By 2025, approximately 900,000 Amazon sellers were using AI tools to generate or refine product listings, cutting average listing creation time from 4 hours to 30 to 45 minutes per product.

A further 1.3 million sellers used Amazon's own generative AI listing tools by Q3 2025.

Source: Amazon, amzmonitor, Similarweb, Business Wire, Red Stag, CNBC, Business Of Apps, Seller Assistant, Marketplace Pulse

Amazon Sales Statistics


Amazon closed 2025 with $716.9 billion in total net sales, a 12% increase from the prior year. That figure likely places Amazon ahead of Walmart globally for the first time.

Q4 2025 alone generated $213.4 billion in net sales, a 13.6% jump year over year, reflecting the strength of the holiday quarter.

AWS generated $128.7 billion in revenue in 2025, accounting for roughly 57% of Amazon's total operating profit, even though it represents a minority of total sales.

Amazon's operating income reached approximately $80 billion in 2025 at an 11.2% margin, driven by efficiency gains in logistics and strong performance from AWS and advertising.

Source: Yahoo, Amazon SEC, Landing Cube

How Many Products Does Amazon Sell Per Day


US-based third-party sellers alone sold around 8,600 products per minute on Amazon in 2025. That amounts to approximately 12 million items sold daily through US third-party sellers.

In an average minute, shoppers buy around 8,900 items from Amazon sellers across the marketplace. Amazon processes roughly 177 orders per second globally and ships an estimated 20 to 25 million packages per day worldwide.

The table below breaks down Amazon's global order volume and dollar sales by time period:

Amazon Global Order Volume and Product Sales

Duration Number of Orders Product Sales Dollars
Second 177 $9,395
Minute 10,591 $563,672
Hour 635,481 $33,820,320
Day 15,251,553 $811,687,671
Week 106,760,874 $5,697,423,077
Month 463,901,416 $24,688,833,333
Fiscal quarter 1,391,704,247 $74,066,500,000
Year 5,566,816,986 $296,266,000,000


Source: Capital One Shopping 1, Capital One Shopping 2, Red StageDesk

Amazon Sales Data by Product


According to the SmartScout database, Health & Household leads all Amazon categories in monthly revenue at $4.44 billion, followed closely by Home & Kitchen at $4.23 billion. Together, the top 10 categories generate over $27 billion per month in marketplace sales.

The table below ranks the top 10 Amazon product categories by monthly revenue, along with key competitive metrics:

Top Amazon Product Categories by Monthly Revenue

Rank Category Monthly Revenue Brands Avg Sellers/Listing YoY Growth
1 Health & Household $4.44B 85,474 207 +30%
2 Home & Kitchen $4.23B 100,313 445 +9%
3 Clothing, Shoes & Jewelry $3.77B 57,623 124 -12%
4 Electronics $3.18B 41,983 202 +21%
5 Beauty & Personal Care $2.96B 67,065 222 +27%
6 Patio, Lawn & Garden $2.30B 59,872 144 +12%
7 Tools & Home Improvement $1.80B 83,825 116 +3%
8 Sports & Outdoors $1.72B 74,498 140 +8%
9 Grocery & Gourmet Food $1.57B 42,113 55 +24%
10 Pet Supplies $1.42B 54,666 105 +16%


Home & Kitchen has the highest number of active brands at over 100,000, while also showing the most intense competition with an average of 445 sellers per listing.

At the brand level, Apple leads Amazon's marketplace with $431 million in monthly revenue, driven primarily by traditional laptop sales. Amazon's own brands, Amazon Basics and Amazon, rank second and fifth, respectively, with near-total single-seller control over their listings.


The table below shows the top 10 brands on Amazon by monthly revenue:

Top Brands on Amazon by Monthly Revenue

Rank Brand Monthly Revenue Category / Subcategory Avg Sellers/Listing YoY Growth
1 Apple $431M Electronics - Traditional Laptops 2.5 +5%
2 Amazon Basics $210M Health & Household - Copy & Multipurpose Paper 0.71 +29%
3 Samsung $205M Electronics - Cell Phones 2.5 +39%
4 HP $143M Office Products - Inkjet Ink Cartridges 2.9 +17%
5 Amazon $111M Electronics - eBook Readers 0.56 +34%
6 Shark $98M Home & Kitchen - Upright Vacuums 1.4 +42%
7 Ninja $91M Kitchen & Dining - Air Fryers 1.3 +37%
8 Generic* $89M Grocery & Gourmet Food - Squeeze Toys 0.85 +2%
9 Sony $77M Electronics - Mirrorless Cameras 4.4 +15%
10 VEVOR $75M Patio, Lawn & Garden - Ice Machines 1.65 +47%
*Generic refers to unbranded or white-label products sold without a registered brand name on Amazon.

*Generic refers to unbranded or white-label products sold without a registered brand name on Amazon. SmartScout aggregates all such listings under this label.

Source: SmartScout Brands, SmartScout Subcategories Data

Amazon FBA Statistics


Approximately 82% of active Amazon sellers use FBA, either exclusively or as part of a hybrid model. That figure has risen steadily from around 50% in 2019.


Here is a table displaying Amazon FBA adoption rates across different time periods:

FBA Adoption Rate Over Time

Time Period FBA Adoption Rate
2016-2018 53%
2019-2020 63%
2021-2022 73%
2023-2024 81%
2025 82%


When you add referral fees, FBA fulfillment fees, storage charges, and advertising, the average FBA seller pays 30% to 35% of revenue back to Amazon.

After accounting for those costs and the cost of goods, the average FBA seller earns a net profit margin of 15% to 20%.

Approximately 64% of Amazon FBA sellers achieve profitability within their first 12 months.

Over 800,000 brands are now enrolled in Amazon's Brand Registry, a 20% increase from the previous year. In 2024, Amazon's proactive controls blocked more than 99% of suspected infringing listings before brand owners had to find and report them.

Source: Thunderbit, Red Stag, Novadata

Amazon vs. eBay Seller Statistics


Amazon has approximately 9.7 million active sellers globally. eBay hosts approximately 17.6 million sellers, a number that is larger on paper but reflects a very different seller mix.

The table below tracks eBay's total seller count from 2007 through 2024:

Number of eBay Sellers Over the Years

Year Number of eBay Sellers
2007 1.3 million
2008 1.8 million
2009 2.1 million
2010 3.3 million
2011 6.8 million
2012 13.0 million
2013 18.4 million
2014 25.0 million
2015 24.8 million
2016 24.1 million
2017 22.9 million
2018 22.3 million
2019 21.1 million
2020 20.0 million
2021 19.0 million
2022 18.3 million
2023 18.1 million
2024 17.6 million


eBay includes millions of casual, consumer-to-consumer sellers listing secondhand goods alongside professional merchants.

Amazon's global GMV reached approximately $830 billion in 2025. eBay's full-year 2025 GMV came in at $79.6 billion. Amazon's marketplace is more than ten times larger in gross merchandise volume.

Amazon's average order value sits around $52, while eBay's is approximately $48. The pricing gap is narrow, but the purchase intent is completely different.

Source: Search Lab, Business of Apps. Sumtracker, DMR, Novadata

Start Using SmartScout with Risk-Free Pricing

try it today
7-day money back guarantee, cancel at any time