Amazon Prime Day 2026 (June 23–26) generated $26.4 billion in U.S. online spend across all retailers, narrowly beating Adobe’s pre-event forecast of $26.3 billion and marking a 9.54% increase over 2025’s $24.1 billion four-day total.
According to Numerator’s final tracking update, the average order size was $47.66 (down from $53.34 in 2025). Average household spend dropped to $143.45 from $156.37 in 2025, though 63% of households still placed two or more orders. The average spend per item was $23.23.
Prime Day 2026 has now concluded and the numbers are in. We have compiled the final data from 2026 alongside historical sales to date.
Amazon Prime Day Statistics 2026 – Key Stats
- Amazon Prime Day 2026 spending recorded $26.4 billion in U.S. online spend, a 9.54% YoY increase over 2025’s $24.1 billion. Day 1 alone hit $8.3 billion, up 5.3% YoY.
- 69% of items purchased were priced under $40, while just 10% were above $100.
- The average spend per item was $23.23, down from $24.59 in 2025.
- 84% of people who shopped during Prime Day were Prime members.
- Around 37% of Prime shoppers admitted that Prime Day is the main reason for shopping.
- The majority of shoppers (77%) are female, while 31% of shoppers are 65 years or older.
- Mobile hit an all-time Prime Day opening-day high at 51.2% of online sales ($4.24 billion).
- Day-1 discounts ran 10–24% off list, led by electronics (24%) and apparel (23%).
- The average order value was $47.66 (down from $53.34 in 2025), and the average household spent approximately $143.45 (down from $156.37 in 2025).
- AI shoppers also spent 49.9% longer on sites, browsed 20.5% more pages, and had a 33% higher add-to-cart rate vs. non-AI sources.
- Generative AI traffic to U.S. retail sites almost doubled year over year during Prime Day 2026 (Day 1 data), building on the 3,300% YoY surge seen in Prime Day 2025.
- On Day 1 of Prime Day 2026, BNPL accounted for 6.5% of online orders and drove $668 million in revenue (up 7.6% YoY).
- Shopper satisfaction dropped to 59% reporting high satisfaction with deals, down from 68% in 2025.
- Social media drove 4.3% share of revenue (up 34.1% YoY). Influencers converted shoppers 12x more than social networks overall.
- Nearly 45% of shoppers reported purchasing an item they had been waiting to buy until it went on sale.
Amazon Prime Day Sales Over the Years
Amazon does not publish Prime Day-specific revenue figures. The numbers below come from third-party analysts, mainly Adobe Analytics for U.S. spend and Statista's compiled series.
.avif)
Methodologies and geographic coverage differ between sources, so these are estimated numbers rather than exact figures.
Prime Day 2026 opened ahead of pace. Day one alone generated $8.3 billion in U.S. online spend, up 5.3% from $7.9 billion on the opening day of 2025. The total spending crossed $26.4 billion by 26 June, narrowly crossing Adobe’s forecast of $26.3 billion.
The total was up 9.54% from the $24.1 billion spent during Prime Day 2025, making it the largest Prime Day on record.
Source: Adobe, Chain Store Age, Bloomberg, Statista global series, Statista U.S. series, and Adobe Analytics for 2025.
*The 2025 figure measures total U.S. retailer online spend during the window, not Amazon-only revenue.
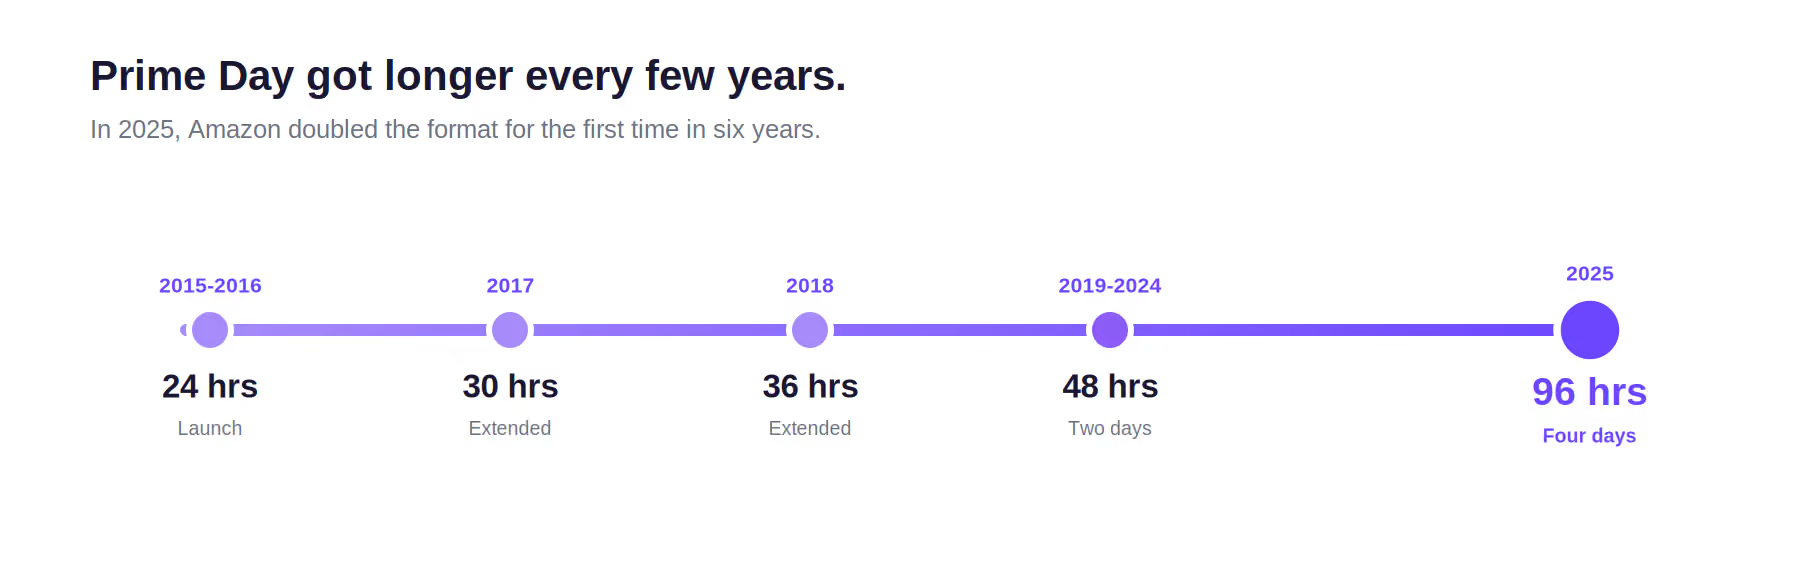
The format change is the single biggest reason 2025's headline number was up 30% year over year. Longer event, more transaction time, more reported revenue. For context, the 2025 four-day total roughly matched the combined 2024 Black Friday and Cyber Monday online sales.
Per-day intensity actually dropped. NielsenIQ's panel data shows the average daily order total in 2025 was 136% above Amazon's year-to-date daily average, versus 247% above the year-to-date daily average in the 2024 two-day event.
So the event is bigger overall, but each individual day is less concentrated than before.
Prime Day Shopper Statistics (2025-2026)
About 89% of 2026 Prime Day shoppers said they had shopped a previous Prime Day, and 93% identified as Prime members of more than a year.
A further 93% of shoppers knew it was Prime Day before they shopped, and 37% said Prime Day was their primary reason for visiting Amazon during that period.
- 59% reported high satisfaction with deals (down from 68% in 2025).
- More than half compared prices across retailers before buying.
- 49% of Prime Day shoppers also shopped Walmart Deals; 32% shoppedTargetshopped Target Circle Deal Days (vs.38% in 2025)
Source: Numerator 2026, Numerator 2025 Report
Prime Day Consumer Spending Statistics (2026)
The average Prime Day 2026 order was $47.66, down from $53.34 in 2025. 63% of households placed two or more orders. Average household spend was approximately $143.45, down from $156.37 in 2025.
Here is a table showing the average order size and the average household spend distribution
Over 37% of households purchased only 1 order, while 18% of them placed more than 5 orders.
Spend per item dropped further to $23.23 in 2026 from $24.59 in 2025. On Day 1 of 2026, BNPL accounted for 6.5% of online orders, driving $668 million (up 7.6% YoY). Adobe forecasts $2.04 billion for the full event (7.8% of spending, up 5.5% YoY).
Most Popular Prime Day Categories
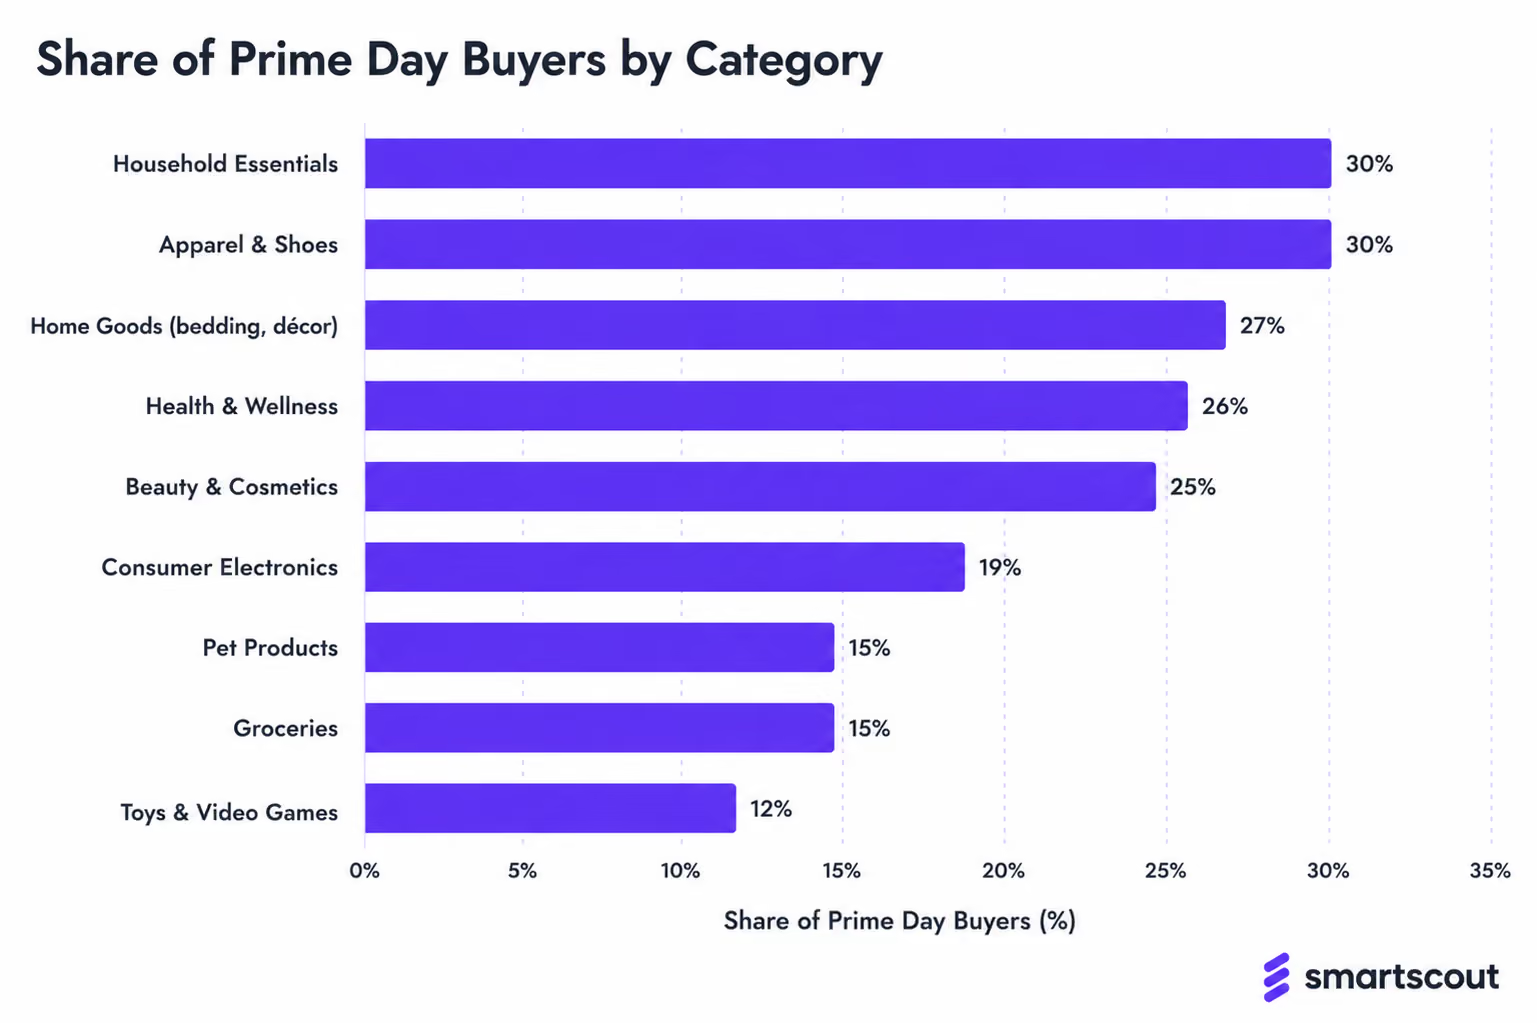
Numerator's verified-buyer survey ranked the most-purchased categories. Everyday essentials dominate the leaderboard:
Source: Numerator 2026 Prime Day Survey.
Biggest category lifts on Prime Day 2026 (Day 1)
Adobe measures category lift differently. It compares Prime Day sales against the daily average from June 2026, which surfaces where Prime Day pulled in disproportionate demand.
Here is a table showcasing the increase in sales compared to the daily average as of June 2026:
This is the day 1 report by Adobe and Chain Store Age analytics from Prime Day 2026.
Source: Chain Store Age
Mobile Shopping & Ecommerce Trends
For the first time in any Prime Day, mobile revenue beat desktop revenue. Smartphones generated 53.2% of online sales, roughly $12.8 billion in spending. The 2024 share was 49.2%, so this is not a small jump. It is a structural shift.
On Day 1 of 2026, mobile hit 51.2% of sales ($4.24B). Adobe forecasts mobile at 54.2% for the full event ($14.2B).
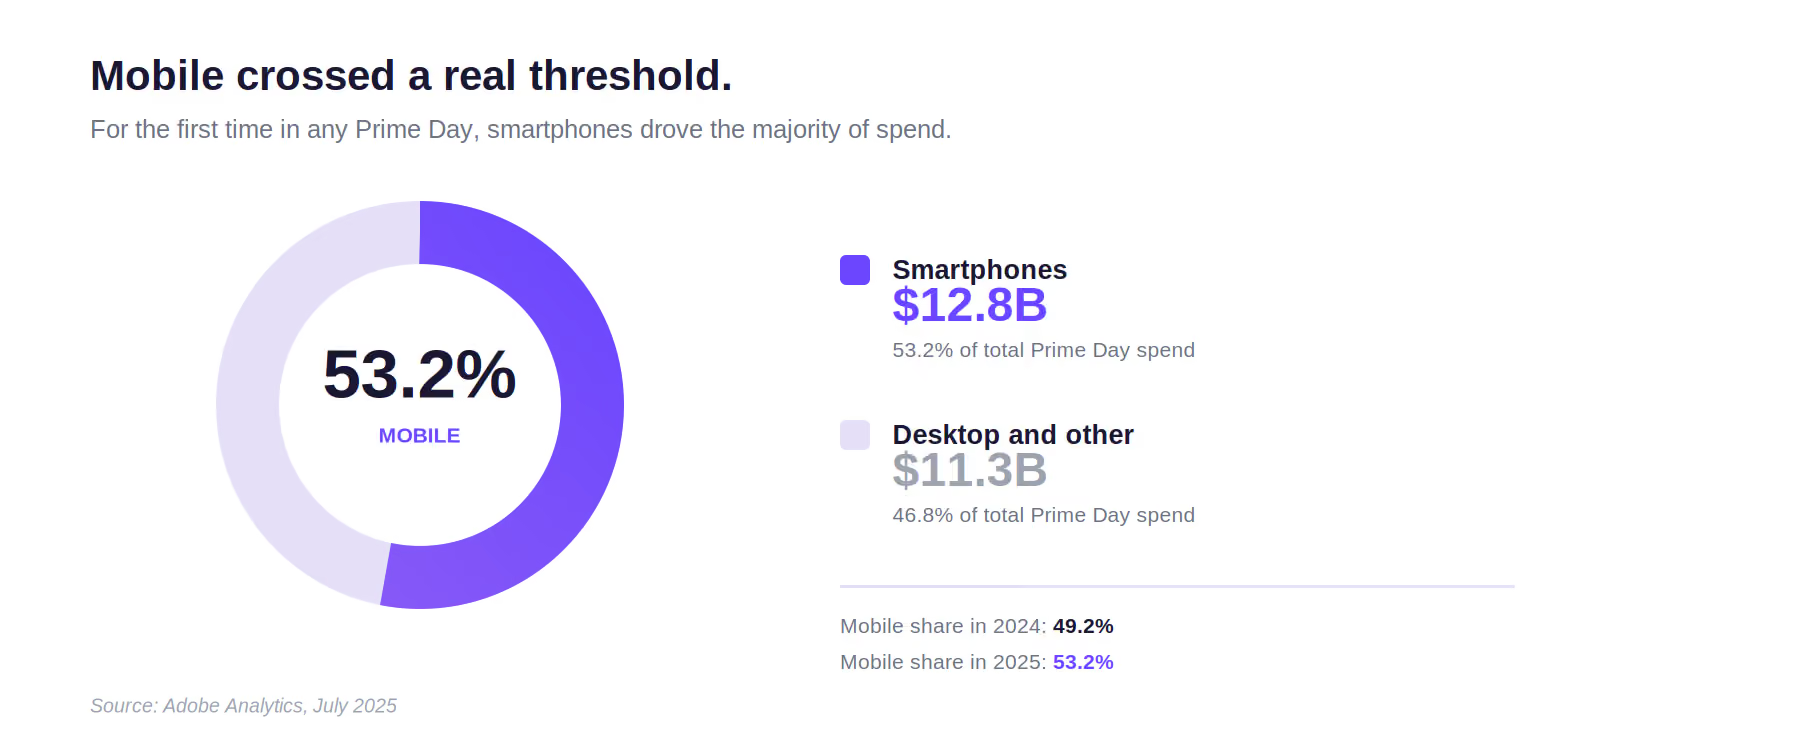
Mobile is now the primary driver of e-commerce sales overall, which has real consequences for how sellers should design listings and ads. Mobile-first product imagery, A+ content that renders on small screens, and ads optimized for thumb scrolling all matter more than they did a year ago.
Prime Day Seller Statistics
Most coverage of Prime Day focuses on what consumers did. The seller side often matters more for strategy. Ad costs, conversion rates, and inventory positioning shape outcomes that the GMV number cannot show.
Ad spend and CPC trends
Skai called Prime Day 2025 the biggest Prime Day in Amazon Ads history, though year-over-year ad spend growth was slower than in prior years. Across Skai's client base, daily averages outperformed the 30-day baseline.
Clicks were up 108%, impressions up 114%, click-through rate climbed, and cost-per-click actually fell. That pattern says advertisers paced their budget across all four days instead of front-loading day one.
Halo effects beyond direct deals
Even brands that did not run formal Prime Day deals saw a sales lift. Acadia's data shows roughly a 46% lift versus their normal weekly baseline during the event. That changes the question for many sellers from "should we run a deal" to "are our listings, inventory, and ads ready for the surge either way?"
How two brands used Prime Day differently
The 46% halo lift tells one side of the story. The other side is what happens when brands actively run deals, and how much the execution varies even among large sellers. SmartScout's marketplace data from July 2025 shows two brands that both treated Prime Day as a growth lever but pulled it in opposite directions.
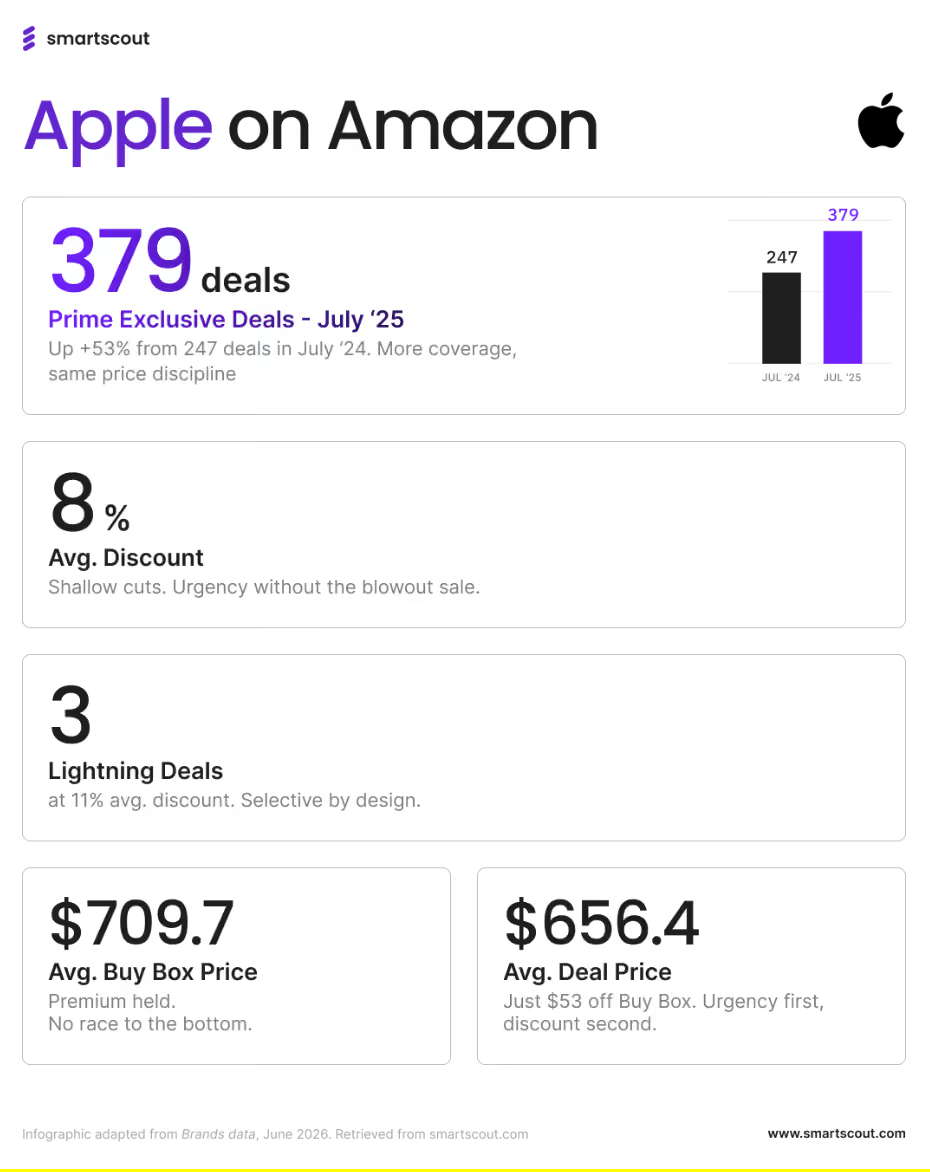
Apple listed 379 Prime Exclusive deals during the event at an average discount of just 8%. It ran only 3 Lightning Deals, averaging 11% off. The average Buy Box price across those listings was $709.74, with deal prices averaging $656.42, a narrow spread that kept the brand's pricing architecture intact.
Year over year, Apple expanded its Prime Exclusive deal count from 247 in July 2024 to 379 in July 2025, but held discount depth flat or lower. More entry points for buyers, no erosion of perceived value.
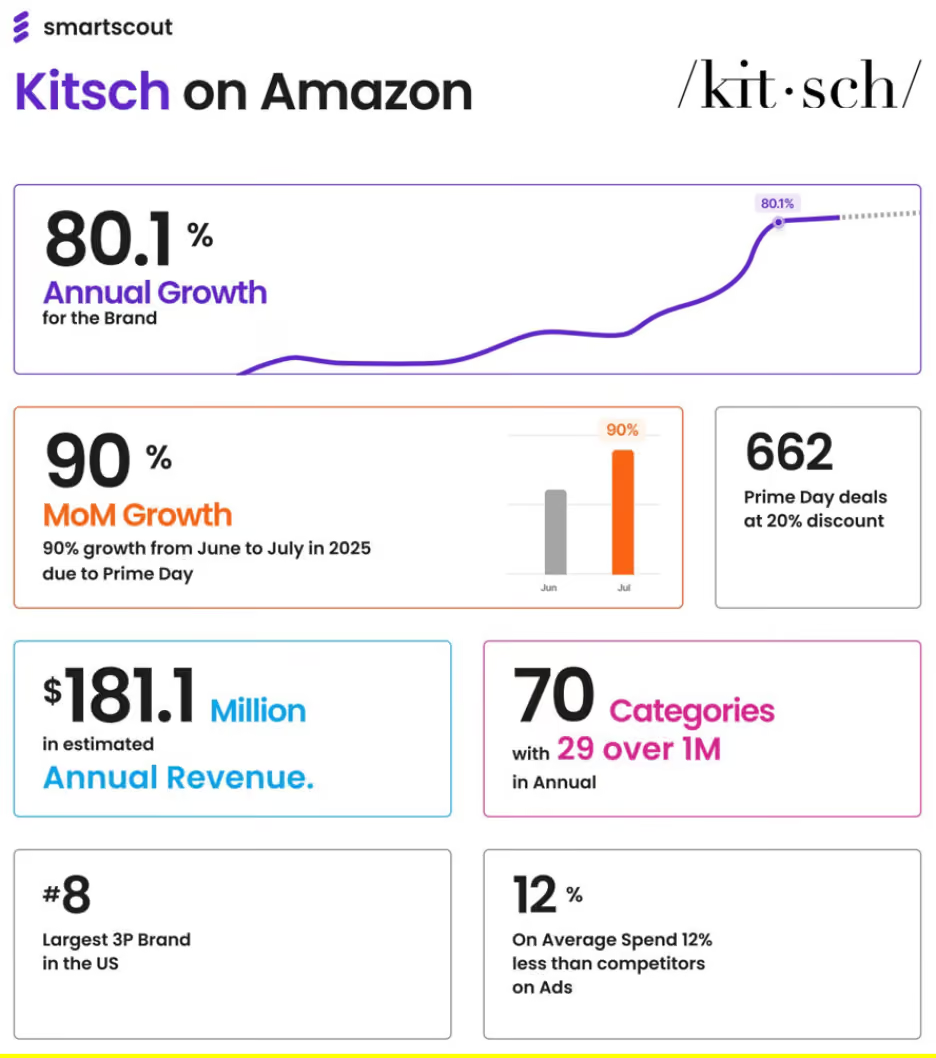
Kitsch, the eighth-largest third-party brand in the U.S. by estimated Amazon revenue, ran the opposite playbook. SmartScout tracked 662 Prime Day deals at an average 20% discount, more than double Apple's deal count and two-and-a-half times the discount rate. The result was a 90% month-over-month revenue jump from June to July 2025, feeding into 80.1% annual brand growth.
Kitsch now operates across 70 Amazon categories, 29 of which generate more than $1 million in estimated annual revenue, putting its total estimated annual revenue at $181.1 million. It did this while spending roughly 12% less on Amazon advertising than its category competitors on average. The growth was deal-fueled, not ad-fueled.
Neither approach is universally correct. Apple optimized for margin and brand positioning, treating Prime Day as a conversion event for buyers who already wanted the product. Kitsch optimized for reach and category penetration, treating Prime Day as a discovery engine that pulls shoppers into adjacent product lines. For third-party sellers mapping out their own Prime Day strategy, the question is which growth constraint they are actually trying to solve: converting existing demand or creating new demand.
Source: SmartScout marketplace intelligence, July 2025.
Prime Day Pricing & Discount Statistics
According to Omnia Retail's proprietary analysis, the overall average discount depth across discounted Amazon US products in 2025 was around 21.7%.
Amazon's own tech brands like Fire TV, Echo, Kindle, and Ring averaged about 30% off, and Amazon Private Brands ran up to 40% off. For third-party products, the picture was more complicated.
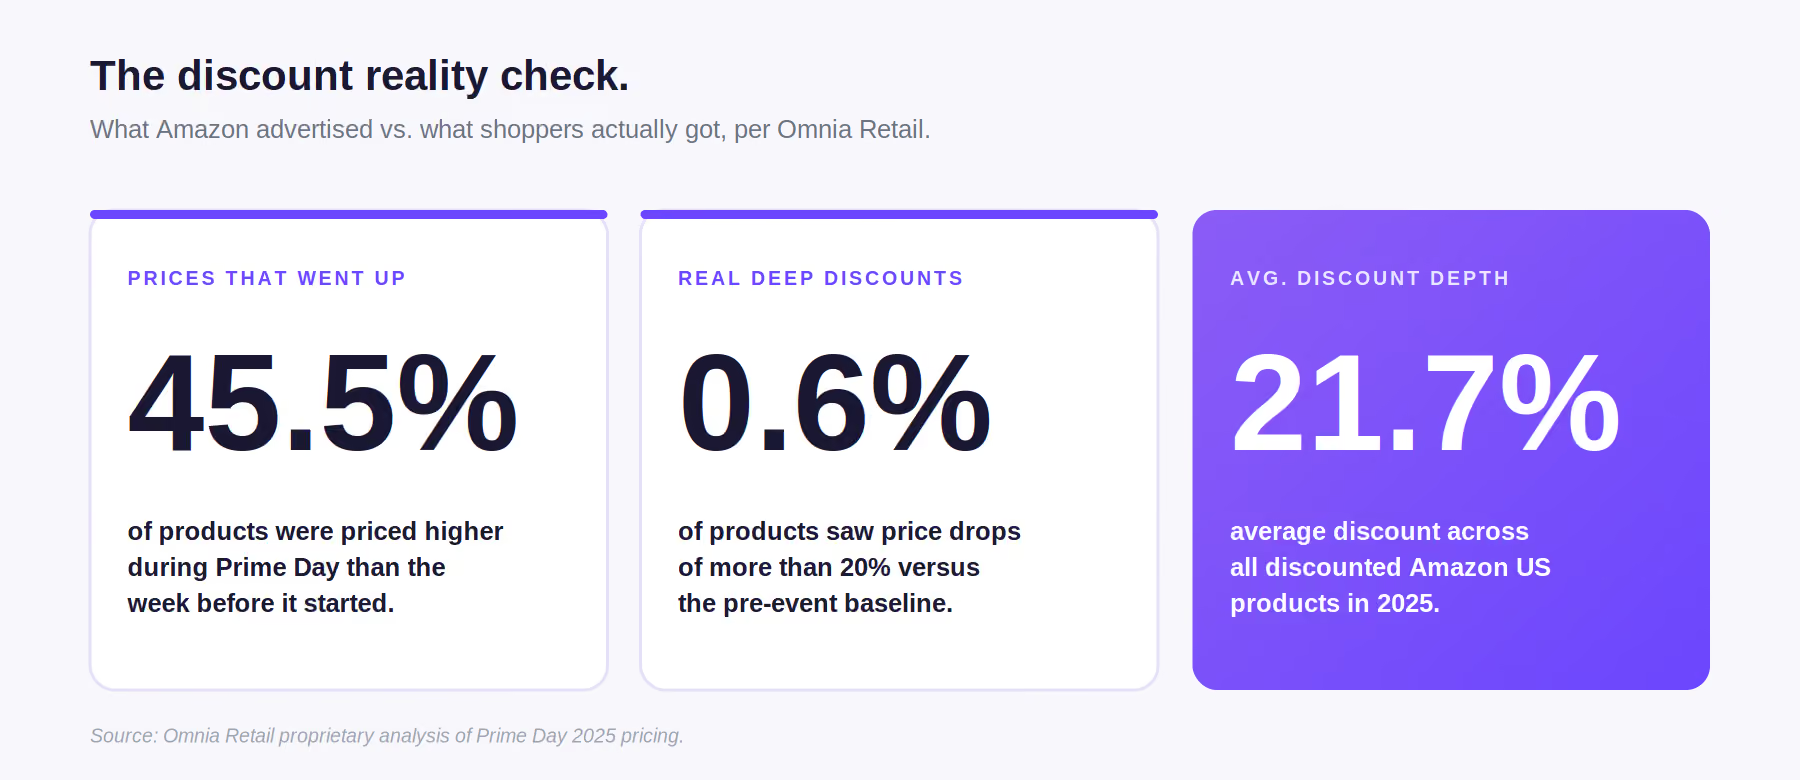
Omnia's most striking finding: 45.5% of products were priced higher during Prime Day 2025 than the week before the event. Only 0.6% of products saw price reductions of more than 20% from the pre-event baseline. For most listings, the "Prime Day discount" reverted prices to where they had been a month earlier, instead of offering a genuinely new low.
Adobe's view shows higher peak discounts
Both views can be accurate at the same time. Adobe measures peak discount depth against listed prices, not pre-event street prices. By that view, here is how the major categories landed (2024 to 2026):
Source: Chain Store Age, Adobe Analytics, Prime Day 2025 (Adobe).
Practical takeaway: price-tracking tools like CamelCamelCamel and Keepa saw a spike in usage during the 2025 event. Consumer skepticism about promotional pricing is rising, not falling, and sellers who set genuine discounts off durable baselines will earn more trust than those who inflate prices first.
AI & Prime Day Shopping Trends
In 2026, AI traffic almost doubled YoY. Converted 50.7% better than non-AI. Shoppers spent 49.9% longer, browsed 20.5% more pages, and added to cart 33% higher. In 2025, AI had converted 23% worse. (source: Chain Store Age)
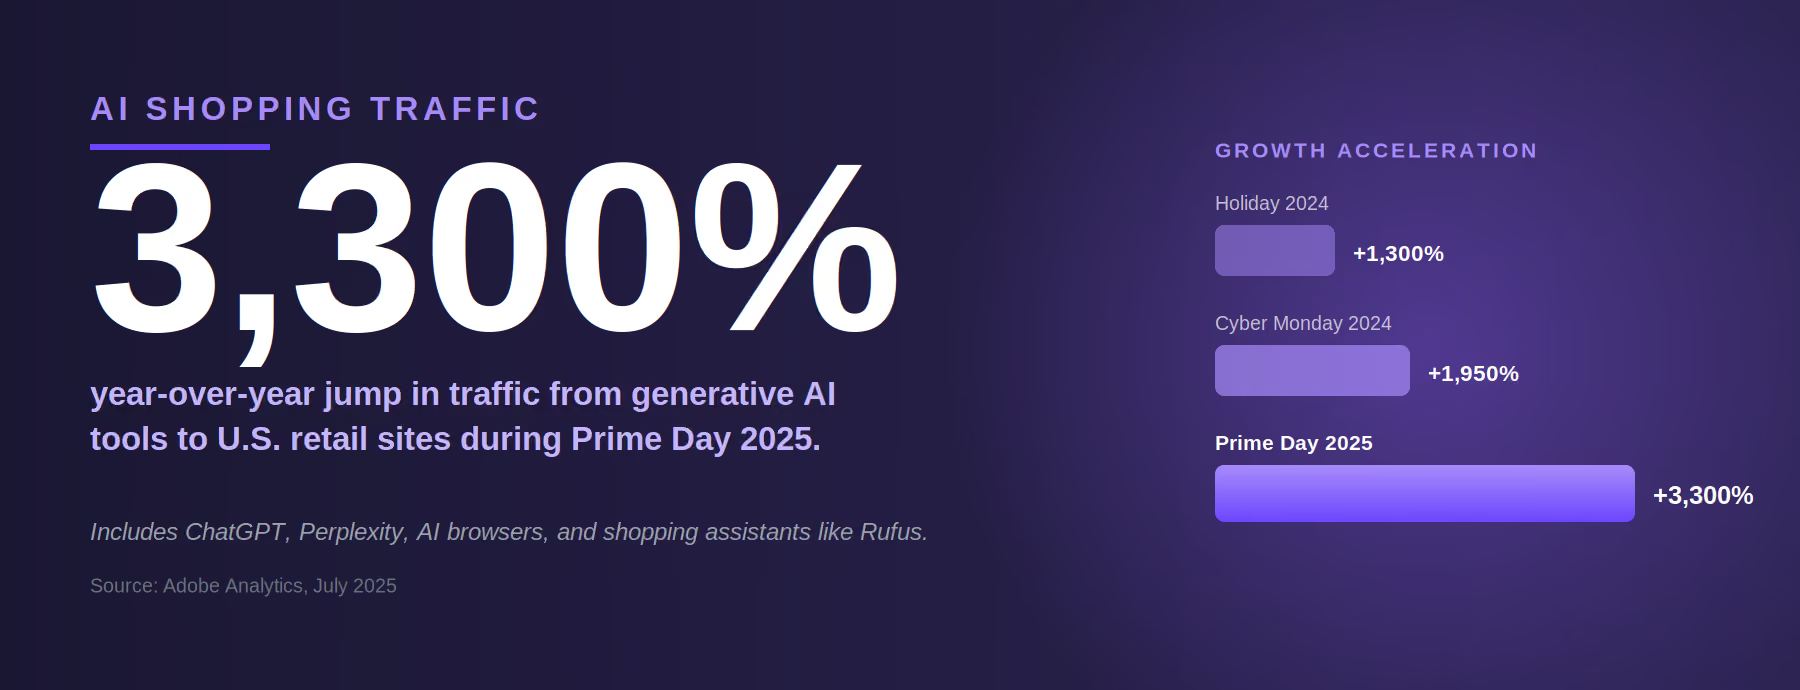
During Prime Day 2025, traffic to U.S. retail sites from generative AI sources like ChatGPT, Perplexity, AI-powered browsers, and shopping assistants jumped 3,300% year over year during the four-day event. For context, the same traffic was up 1,300% during the 2024 November to December holiday window. The curve is accelerating, not flattening.
Inside Amazon, Rufus, the AI-powered shopping assistant, handled an estimated 274 million queries per day by October 2024, about 13.7% of all Amazon searches, with that share projected to reach 25 to 35% by the end of 2025. To handle Prime Day volume, Amazon deployed roughly 80,000 AWS AI chips to process about 3 million tokens per minute for Rufus queries.
AI is still small compared to traditional channels in absolute terms. During Prime Day 2025, paid search drove 28.5% of online retail revenue (up 5.6% YoY), and affiliates and partners drove 19.9% (up 15%). But AI-referred visitors convert 31% better than non-AI traffic, and revenue per visit is up 254% year to date. The channel does not have to overtake paid search to start mattering.
For sellers, the practical implication is direct. Product listings need to be AI-ready. That means clear, structured answers to common customer questions inside the listing, reviews that surface key features, and titles and bullets written in a way that an LLM can summarize cleanly.
Amazon Prime Day vs Holiday Sales (Black Friday + Cyber Monday)
Prime Day 2026 officially crossed the total spending of Black Friday and Cyber Monday combined. Prime Day 2026 totaled $26.4 billion, while BFCM 2025 spending totaled $26.05 billion.
Source: Numerator, Omnisend, CNBC
Prime Day Statistics for Small Businesses
Amazon frames Prime Day as a small-business event, and the data partially supports the narrative. Capital One Shopping estimates small businesses made roughly $3.63 billion in sales during Prime Day 2024). Independent sellers, described by Amazon as mostly small and medium-sized businesses, sold more than 200 million items during the two-day 2024 event.
The official recap says independent sellers achieved record sales and a record number of items sold, but Amazon withheld the specific unit count for the first time since 2020. That is a notable break from past disclosures. Amazon previously shared 375 million units for 2023, over 300 million for 2022, and over 250 million for 2021.
Third-party seller share has been trending up for years. Marketplace items now account for roughly 60% of total Amazon retail sales. For independent sellers, that means Prime Day is increasingly about competition among thousands of marketplace listings rather than Amazon's first-party deals. That is exactly where SmartScout's marketplace intelligence shows up.
Methodology
We compiled this report from multiple publicly available sources, drawing on a mix of primary disclosures (Amazon's official Prime Day recaps, press coverage, and SEC-tracked retail reporting) and third-party analytics platforms (Adobe Analytics, Numerator, NielsenIQ, Statista, and others).
Because Amazon does not disclose Prime Day-specific revenue or unit figures for most metrics, several of the numbers in this article are estimates produced by independent analysts and agencies. Methodologies and geographic coverage differ between sources, so we have flagged those distinctions throughout the article rather than treating every figure as an exact measurement. All data reflects what was available as of June 2026.
Sources:
About Amazon, Adobe, Capital One Shopping, Chain Store Age, Digital Commerce 360, Fortune, GlobeNewswire, Kensium, Mobiloud, Nasdaq, NielsenIQ, Numerator, Omnia Retail, Practical Ecommerce, Productsup, Queue-it, Skai, Statista, Tinuiti.

.png)