
If you are researching Analytic Index alternatives, start with the questions your team needs to answer.
Are you measuring category market share on Amazon? Investigating competitors’ advertising?
Exploring TikTok Shop? Or monitoring product availability and content across a long list of retailers?
Those needs overlap, but they do not lead to the same software purchase.
This guide compares SmartScout, Stackline, Profitero+, and Helium 10 by their practical uses. As this is published on SmartScout, our primary focus is on our own platform. However, we will also highlight scenarios where a competitor's solution deserves a closer look.
Analytic Index provides retail search intelligence, digital shelf analytics, sales and market share insights, and promotional analysis. Its published coverage includes Amazon, Walmart, Target, Kroger, and Home Depot. It also offers curated reporting services for brands and agencies. Explore Analytic Index’s solutions.
That makes it relevant to teams evaluating organic and sponsored search alongside category performance across multiple retailers. If that breadth is central to your work, retailer coverage should be an early requirement when comparing alternatives.
These are our assessments of where each platform fits, based on its published capabilities. They are not rankings of data accuracy.
SmartScout is a strong alternative to evaluate when your priorities are understanding Amazon competition and identifying opportunities on TikTok Shop.
The core value is the ability to work at different levels of detail. Leadership may need a category and brand view. An ecommerce manager needs to understand the products behind that picture. A search specialist needs to investigate keywords and competitive visibility.
SmartScout supports those different questions within one platform.
A product’s growth becomes more useful when you understand the market around it.
Is the category expanding? Is one brand taking a larger share? Is a competitor’s performance concentrated in a few products?
SmartScout’s category market share and brand insights help teams put individual product performance into context. From that broader view, you can examine the products and keywords relevant to your investigation.
For example, a brand evaluating a new segment could use this approach to identify the leading competitors, inspect their assortments, and decide which products warrant deeper research. An agency could use it to prepare a category assessment before recommending a strategy to a prospective client.
SmartScout also helps teams examine where competitors appear in Amazon search and how they compete for sponsored visibility.
AdSpy supports research into competitors’ sponsored placements and keywords. Share of Voice adds historical advertising presence and estimated share of spend across selected keywords. These tools help answer practical questions: Which brands repeatedly appear on important searches? Where is sponsored competition increasing? Which terms deserve investigation? Read how SmartScout tracks competitor advertising.
Competitive spend estimates should be treated as estimates, not access to another company’s advertising account. Similarly, strong search visibility does not by itself establish profitability. The value is in identifying patterns and opportunities to test against your own results.
SmartScout’s TikTok Shop analytics adds shop revenue estimates, product trends, category sizing, and market share research. That gives brands and agencies another marketplace to evaluate when deciding where to expand or which competitors to investigate. Explore SmartScout’s TikTok Shop analytics.
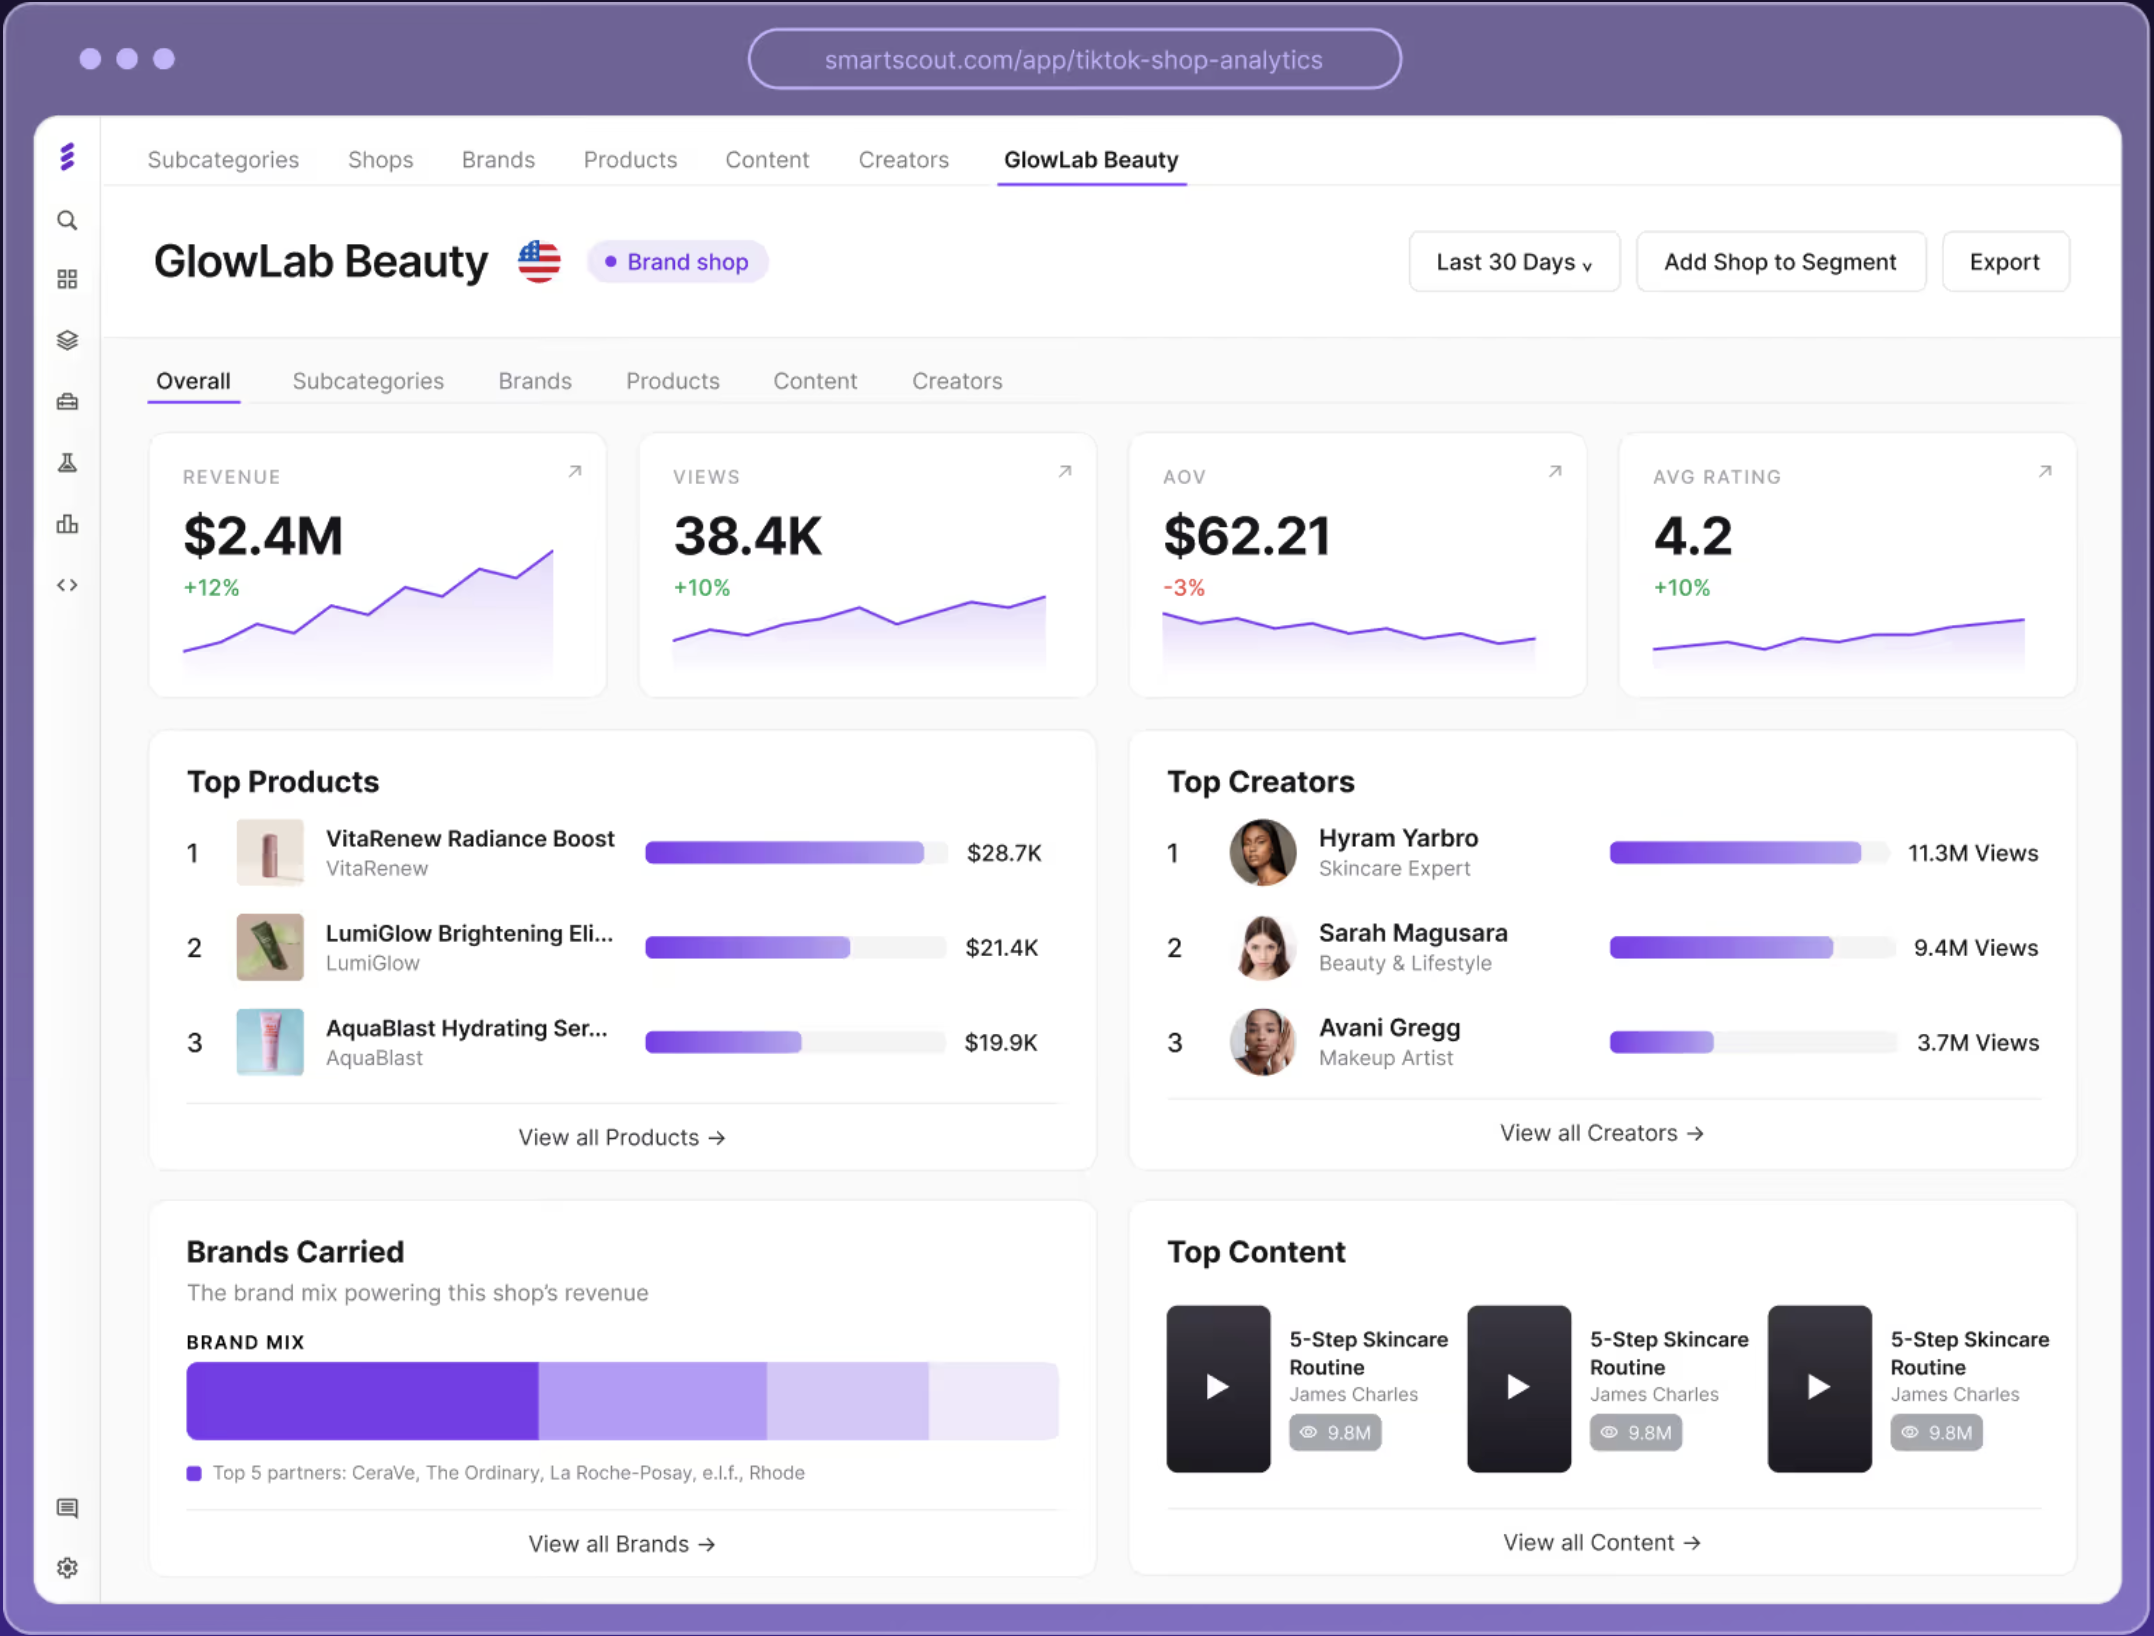
For an Amazon brand considering TikTok Shop, useful starting questions include:
Having intelligence for both channels can support a more informed expansion discussion. It does not, by itself, prove that TikTok activity caused a change in Amazon sales.
SmartScout’s pricing is designed to make market research accessible to smaller sellers and brands while supporting larger organizations. Its enterprise offering includes options such as historical data, AdSpy, Share of Voice, and custom dashboards and alerts. Features and access depend on the package. Compare SmartScout plans.
For buyers considering Analytic Index, the overlap is meaningful: category and brand analysis, competitive advertising intelligence, and product and keyword research address many of the same business questions. Evaluate those capabilities against your actual workflow, data requirements, and budget.
Choose SmartScout when: Amazon and TikTok Shop insights are central to your work, and you want research that serves both strategic market analysis and detailed competitive investigation.
Look more closely at other options when: your main requirement is consistent reporting across retailers such as Walmart, Target, Kroger, and Home Depot. Coverage across those retailers is a different purchasing requirement from depth on Amazon and TikTok Shop.
Stackline’s Atlas product covers market share, competitor advertising, traffic, pricing, and product performance across retailers including Amazon, Walmart, and Target. Its broader platform also includes shopper analytics, forecasting, and advertising management products. Explore Stackline’s platform.
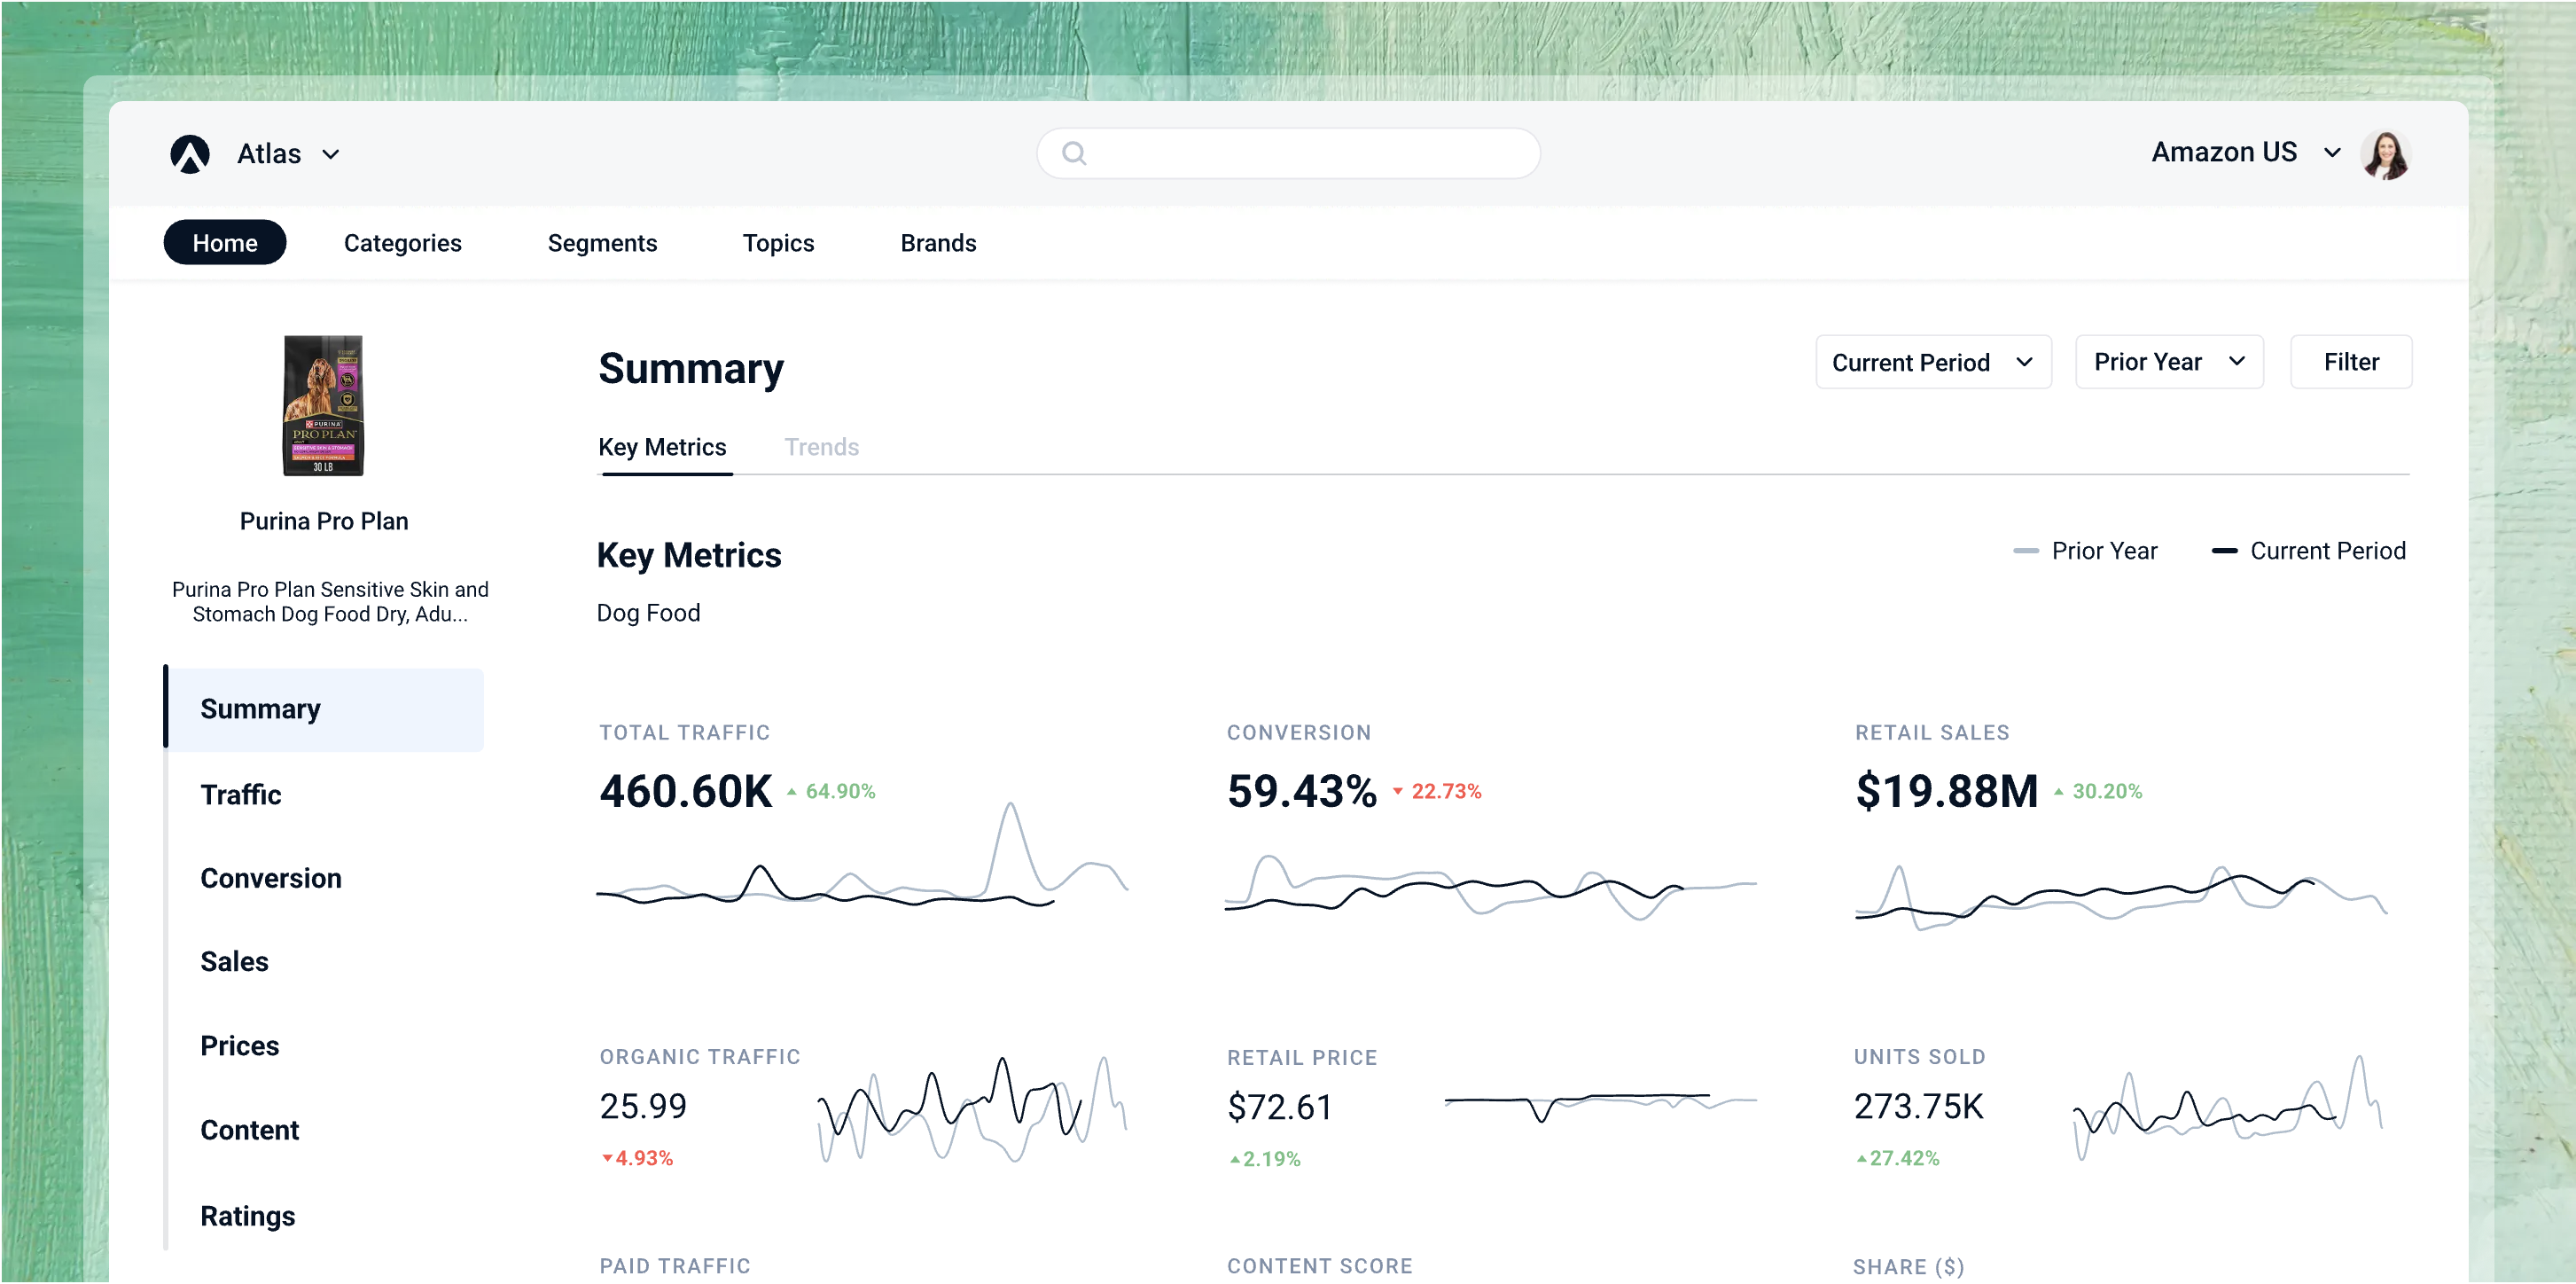
That makes Stackline worth evaluating when your organization wants competitive intelligence alongside shopper behavior analysis or other commerce workflows. For example, a brand might want to investigate its competitive position and also understand shopper retention or share of wallet.
Choose Stackline when: multiple retail teams need a broader combination of market, shopper, and commerce capabilities.
Buying consideration: ask which products are included in the proposal. A capability listed somewhere in a vendor’s platform is not necessarily included in the package you are purchasing.
Profitero+ is particularly relevant to brands managing the quality and availability of their retail presence. Its digital shelf offering covers areas including search visibility, product content, pricing, stock availability, and ratings and reviews across a broad retailer network. Explore Profitero+ Digital Shelf.
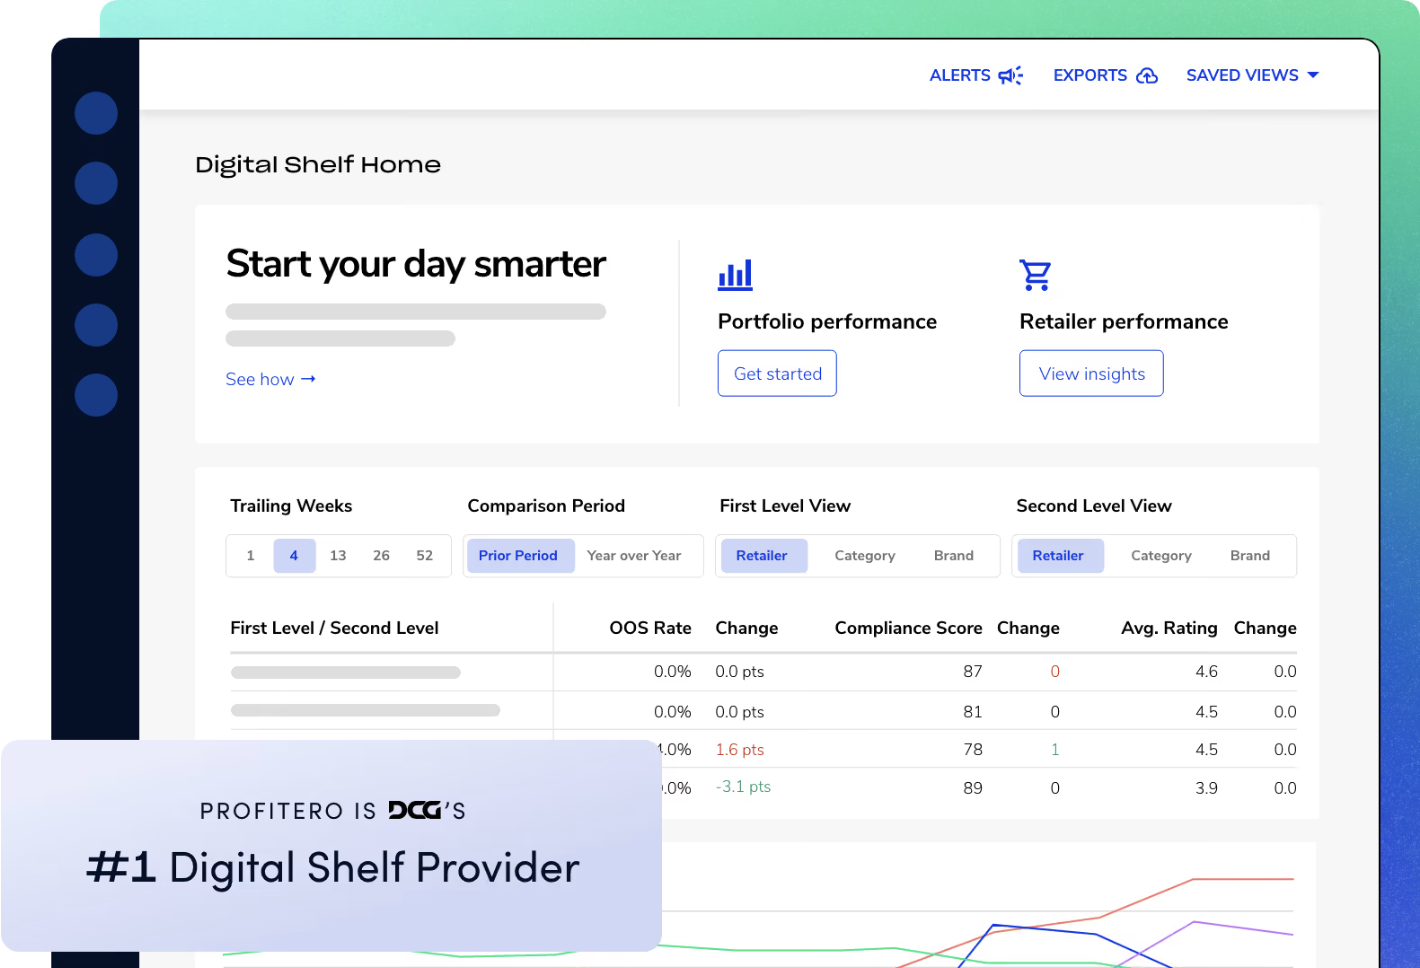
Consider a brand whose immediate problems are missing product images, inconsistent descriptions, out-of-stock listings, and weak search placement across several retail partners. Those are concrete digital shelf execution needs, and they make Profitero+ a relevant candidate.
Choose Profitero+ when: your team needs to find and prioritize issues affecting product presentation and availability across retailers.
Buying consideration: test your actual retailer and SKU list during evaluation. Broad advertised coverage is useful, but the coverage that matters is the portion your business will use.
Helium 10 combines product and keyword research with listing, advertising, and seller operations tools. Its Market Tracker supports competitive market monitoring, while Market Tracker 360 adds broader analysis across categories, brands, and products. Compare Helium 10’s market research tools.

It deserves consideration when the same team conducting research also handles day-to-day Amazon execution. An operator may value access to keyword research, listing tools, inventory workflows, and market monitoring through one vendor.
Choose Helium 10 when: you want market intelligence as part of a wider collection of Amazon seller tools.
Buying consideration: distinguish the standard Market Tracker from Market Tracker 360. Compare the specific product, limits, and package being offered rather than assuming every plan includes the full research offering.
Bring the same research assignment to each demo. Choose a category, several competing brands, a product set, and a handful of important search terms. Ask each vendor to show how its platform would answer your questions.
Then compare:
For teams focused on Amazon and TikTok Shop, SmartScout belongs on that shortlist. Its combination of category market share, competitive advertising intelligence, and brand-to-product-to-keyword research supports both smaller businesses and enterprise analysis.
Explore SmartScout’s plans and evaluate the platform against the market questions your team needs to answer.
Jungle Scout Cobalt is an enterprise Amazon market intelligence platform built for established brands, retailers, agencies, and other teams that need category, brand, product, pricing, advertising, and seller data at scale.
But enterprise teams do not all need the same intelligence layer. Depending on how your organization uses Amazon data, another platform may offer deeper seller visibility, stronger search analysis, more flexible reporting, tighter retail media integration, or broader cross-retailer coverage.
This guide compares five Jungle Scout Cobalt alternatives for enterprise brands and marketplace teams, focusing on competitive monitoring, search visibility, seller data, market research, and overall workflow fit.
Cobalt is designed for companies that have moved beyond basic product research. Jungle Scout currently positions the platform for businesses generating more than $1 million in annual corporate revenue, with features spanning market benchmarking, category performance, keyword research, pricing analysis, seller-level detail, advertising, and executive dashboards.
That means comparing alternatives solely by the number of features on a pricing page does not tell you much. Enterprise teams should instead ask how well each platform supports the decisions they actually make.
Consider:
A broader Amazon analytics software comparison can also help teams separate market intelligence platforms from tools built primarily for listing optimization, PPC management, or day-to-day seller operations.
There is no universal replacement for Cobalt, as the platforms below address different parts of the Amazon intelligence problem.
Pricing and product capabilities can change. Teams should confirm current pricing, limits, marketplace coverage, and required modules directly with each vendor before purchasing.
Best for: Amazon teams that want connected brand, seller, category, search, and competitive intelligence
SmartScout approaches Amazon research at the ecosystem level. Instead of forcing teams to investigate individual ASINs in isolation, it connects products with the brands, sellers, subcategories, keywords, ads, and traffic patterns around them.
Teams can investigate which brands lead a category, how market share is distributed, who sells rival products, which subcategories are changing, where shopper traffic comes from, and how search visibility overlaps with competitors.
For larger marketplace teams, that connected view can also make it easier to evaluate category opportunities, monitor competitor movement, and give different stakeholders a shared view of the Amazon market.
Key strengths:
For teams comparing these platforms directly, see Jungle Scout Cobalt vs. SmartScout.
Best for: Amazon operators that want market research and seller operations in one platform
Helium 10 combines Amazon market research with operational tools for managing listings, advertising, profitability, inventory, and other seller workflows. This breadth makes it a strong fit for teams that want research and execution capabilities in a single platform, rather than in a dedicated market intelligence environment.
Key strengths:
Teams can also compare its positioning with SmartScout and Jungle Scout in this SmartScout vs. Helium 10 vs. Jungle Scout comparison.
Best for: Enterprise teams that want marketplace intelligence connected to account analytics and BI workflows
DataHawk combines external marketplace data with a brand's own ecommerce performance metrics. Its platform brings together sales, advertising, profitability, inventory, product, SEO, and digital shelf metrics across Amazon and other marketplaces.
Key strengths:
Best for: Enterprise brands that want competitive intelligence closely connected to retail media
Pacvue is geared toward enterprise commerce teams that want competitive market signals tied directly to retail media and commerce execution. Its Market and Competitive Insights capabilities cover category performance, market share, keywords, ASINs, pricing, promotions, and cross-retailer share of voice.
Key strengths:
Best for: Large consumer brands that need competitive intelligence across Amazon and other major retailers
Stackline provides ecommerce market and consumer data across Amazon, Walmart, Target, and other major retailers. Its Atlas platform helps large brands track market share, consumer demand, competitor performance, digital shelf activity, and changes in shopping behavior at scale.
Key strengths:
Most enterprise teams do not need every capability equally. Start with the Amazon decisions your team makes most often, then choose the platform that supports those workflows with the least friction.
Before signing an enterprise contract, test each shortlisted platform against the same real-world use case. Give vendors one category, several competitors, priority keywords, and a question your team recently needed to answer. Compare not only the output, but how quickly analysts can reach an answer, how easily the findings can be shared, and whether the data fits existing reporting workflows.
SmartScout's Amazon seller data helps teams investigate those relationships more directly.
Choosing a Jungle Scout Cobalt alternative ultimately comes down to the questions your team needs to answer. For Amazon-focused organizations, that often means looking beyond individual products to understand brands, sellers, categories, search behavior, advertising, and market share together.
SmartScout gives enterprise Amazon teams a connected view of brands, sellers, products, categories, keywords, and advertising so they can evaluate market share, monitor competitors, uncover category opportunities, and support faster strategic decisions.
Use SmartScout's Amazon brand list software to research brands, products, sellers, and market position across Amazon.
Contact SmartScout to see how its enterprise market intelligence capabilities can support competitive research, category planning, and Amazon reporting across your organization.
New SmartScout data shows that nearly half of all Apple laptops sold on Amazon US now ship with 8GB of memory. The AI memory squeeze is reaching consumers two different ways, and only one of them shows up on the price tag.
In late October 2024, Apple made 16GB the standard memory configuration across every Mac it sold. The move was widely read as preparation for Apple Intelligence, which needed more memory than the old 8GB baseline could spare. Apple did it without raising prices. For the first time in the company's history, the entry-level Mac and the expensive one had the same amount of memory.
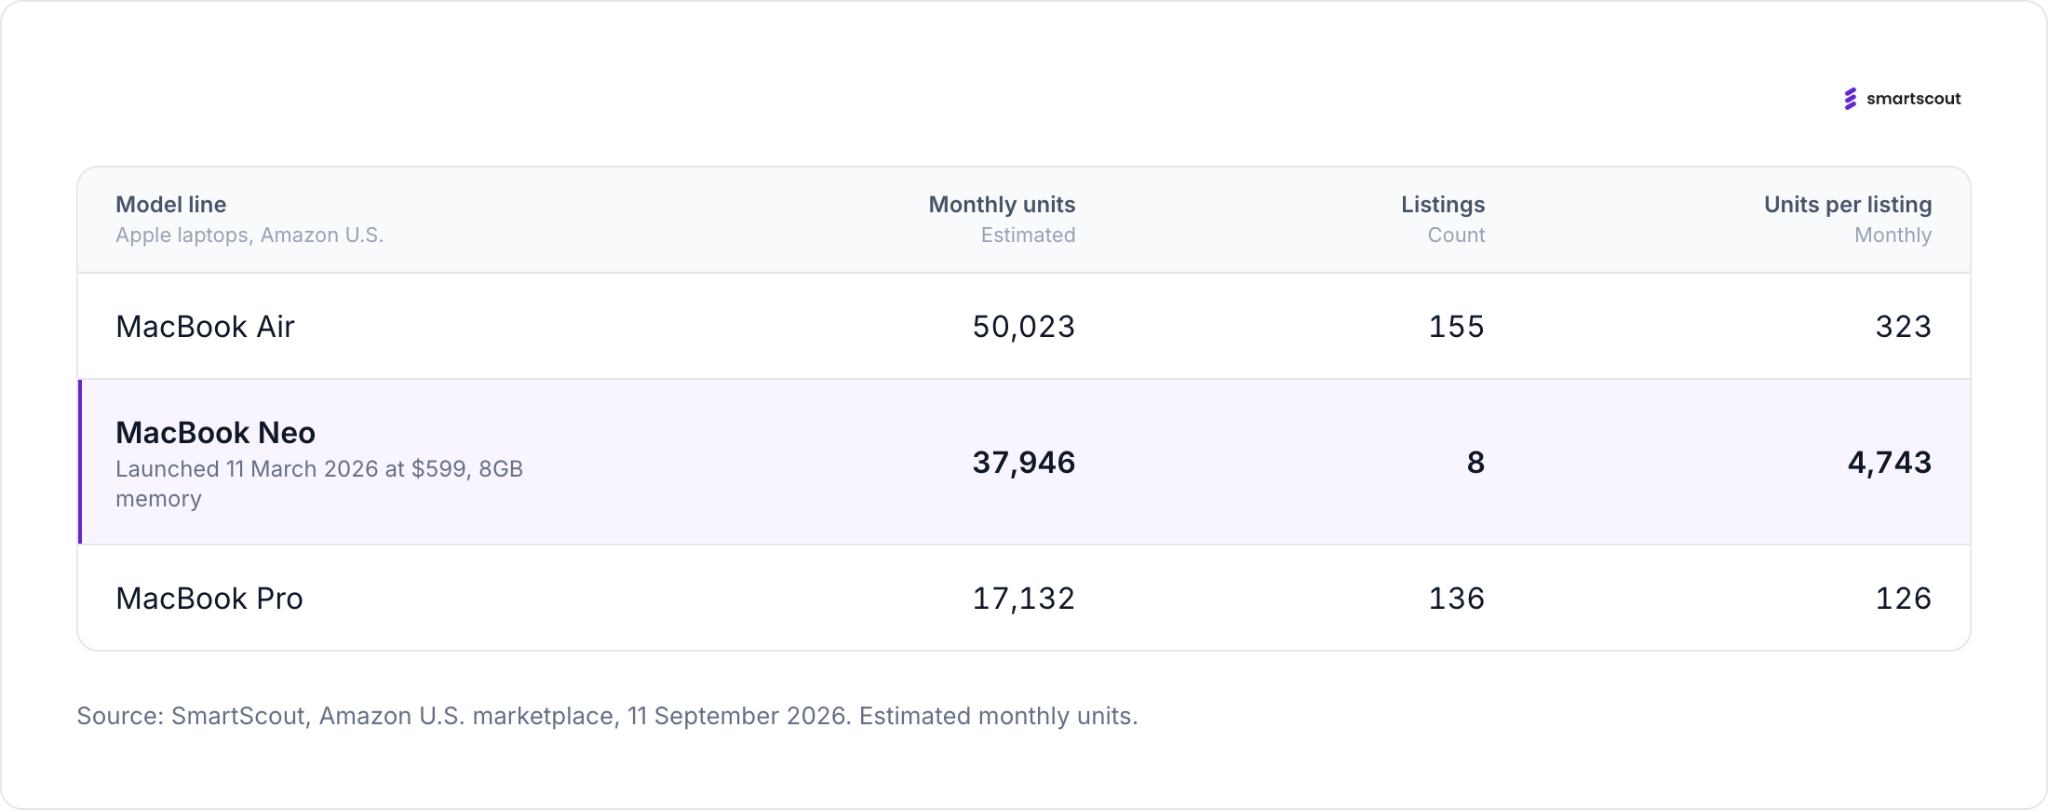
On 11 March 2026, Apple launched the MacBook Neo at $599. It has 8GB of memory, a 256GB drive, and an A18 Pro chip, the processor from the iPhone 16 Pro. Apple markets it as built for artificial intelligence.
Sixteen months separate those two decisions. In between, data centre demand for memory chips repriced the entire supply chain.
SmartScout tracked 300 Apple laptop listings in the Amazon US Traditional Laptops subcategory, accounting for $114,945,776 in monthly revenue and 105,142 units.
Sorted by the memory configuration stated in each listing, 45.6 percent of units now ship with 8GB. Another 39.4 percent ship with 16GB. Configurations of 32GB and above account for 2.4 percent of units between them.
The MacBook Neo is doing that on its own. It generates $27,742,797 a month, 24.1 percent of Apple's Amazon laptop revenue and 36.1 percent of its units, from eight listings. The MacBook Air needs 155 listings to produce 47.6 percent of units. The best-selling single MacBook Neo configuration moves 8,169 units a month against 6,348 for the best-selling MacBook Air.
A machine that did not exist in February is now a third of Apple's laptop volume on the largest retail channel in the United States.
Every device maker facing higher memory costs has two levers. Raise the price, or reduce what goes in the box. Which lever a company pulls depends on whether it has a configuration to cut and a margin to protect.
Laptop makers have both. A laptop has a memory tier, a storage tier and a processor tier, and the maker can move any of them without changing the name on the lid. So laptop revenue on Amazon US grew 19 percent year over year, a modest figure against the 162 percent increase in the Computer Memory aisle. The adjustment happened inside the specification instead.
Console makers have neither. A PlayStation 5 is a PlayStation 5. There is no 8GB version to sell instead, and consoles carry thin hardware margins by design because the money is made on software. Microsoft said as much when it raised Xbox prices by as much as $150, stating that storage and memory costs had more than doubled since the previous autumn and that consoles are not sold with enough margin to absorb that.
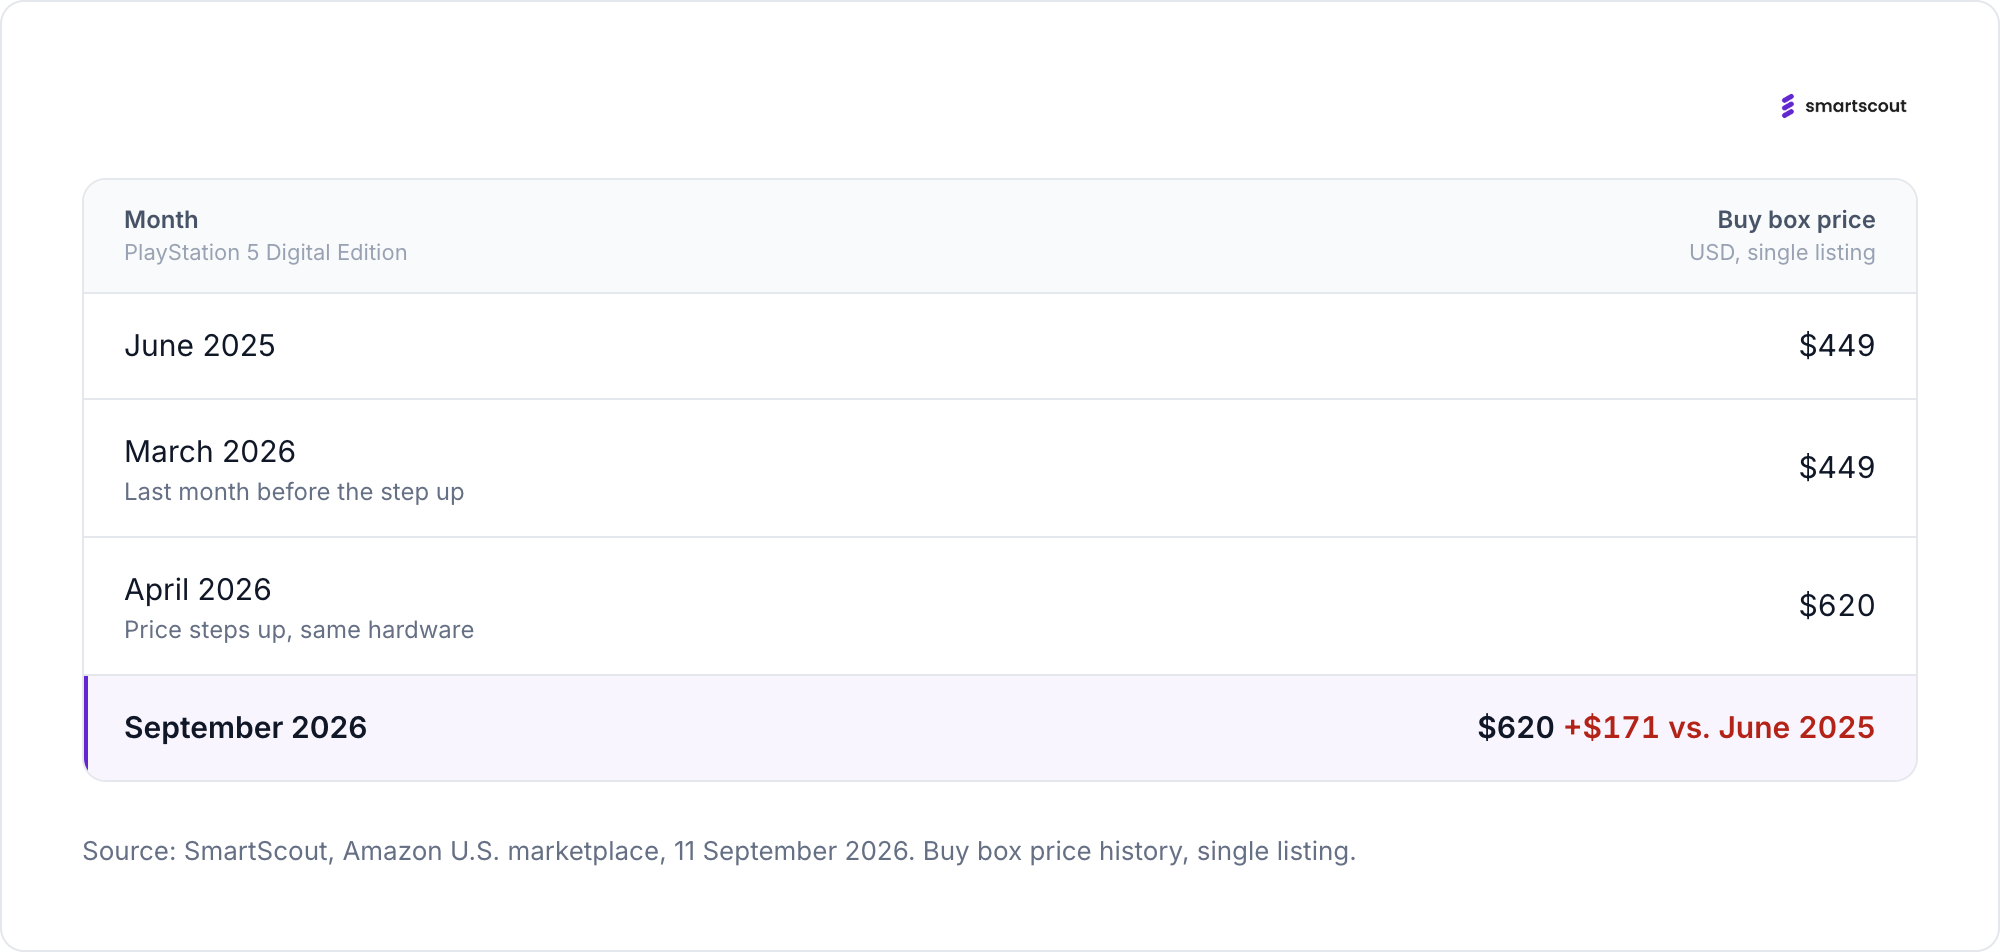
The result is visible in the price history. A PlayStation 5 Digital Edition held a buy box price of $448.50 in June 2025 and $499 from September through March. In April 2026 it stepped to $598. By August it averaged $623. The machine did not change. PlayStation 5 console revenue on Amazon is up 56 percent year over year, and Xbox Series X and S revenue is up the same 56 percent.
A console buyer pays more for the same machine. A laptop buyer pays a little more for a smaller machine. Both are paying the memory bill. Only one of them can read it off the shelf.
Ranking Amazon US categories by year-over-year revenue growth produces an unusually clean gradient.
Where the memory chip is the product, prices rose hardest: Computer Memory up 162 percent, external solid state drives up 90 percent, memory cards up 64 percent, internal solid state drives up 63 percent, flash drives up 35 percent. The Data Storage department as a whole is up 91 percent.
Where memory is a large share of the bill of materials, the increase is real but smaller: consoles up 56 percent, graphics cards up 41 percent, laptops up 19 percent, tablets up 17 percent, processors up 11 percent.
Where a product contains little or no memory, nothing happened, or the category shrank: computer monitors up 14 percent, networking products up 9 percent, tablet accessories up 8 percent, power supplies flat, cooling down 10 percent, motherboards down 13 percent, optical drives down 24 percent.
Motherboards and power supplies are the tell. Those are the parts you buy at the same time as memory. Both categories are flat or falling while memory climbs, which is what happens when people stop building computers.
Search behaviour on Amazon confirms that buyers are adjusting their own expectations rather than paying up.
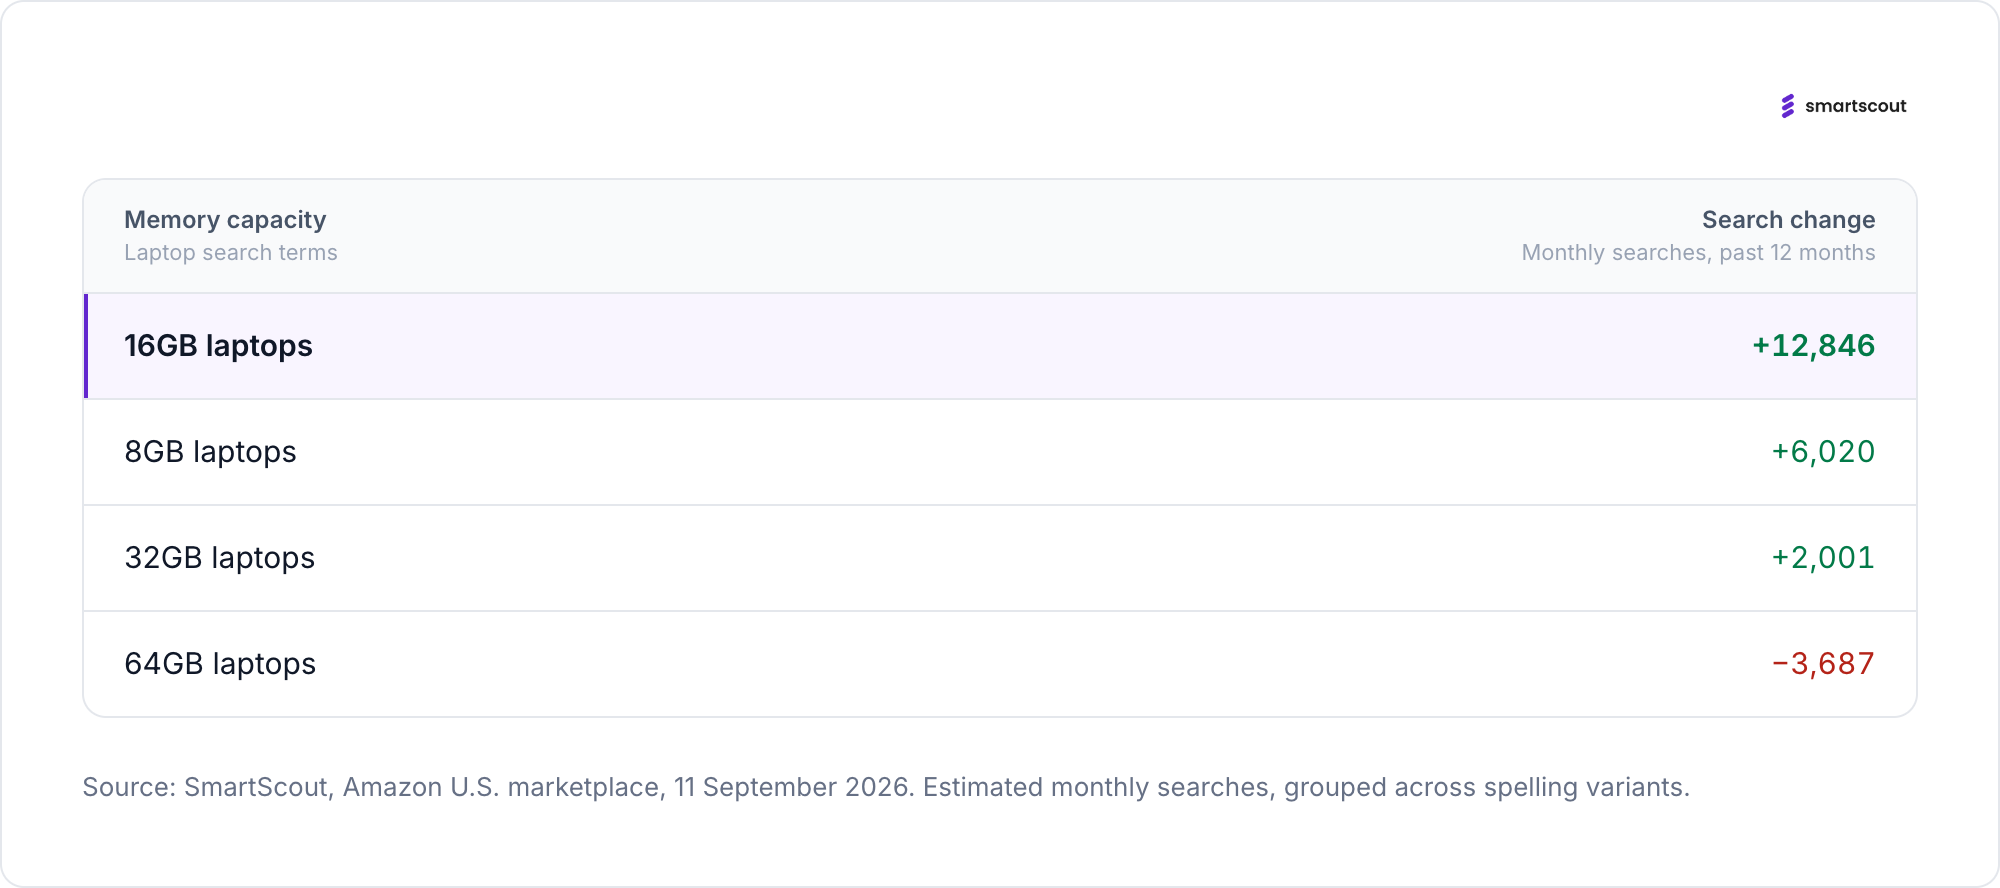
Grouping laptop memory searches by capacity, the bottom rungs are growing and the top rung is shrinking. Searches for 8GB laptops are up roughly 6,000 over twelve months and gained about 3,500 in the last month alone. Searches for 16GB laptops are up roughly 12,800. Searches for 32GB laptops are up about 2,000 and fell last month. Searches for 64GB laptops are down about 3,700 over the year.
The secondhand market is inflecting at the same time. Searches for refurbished laptops stand at 44,532 a month and have added 9,109 in the last three months after being flat for the year before. "Refurbished laptops clearance sale" has gone from almost nothing to 15,558 searches a month. "Certified refurbished laptops" and "refurbished laptop clearance" both appeared from a standing start in the last twelve months.
People are not cancelling the purchase. They are buying less computers, or buying somebody else's.
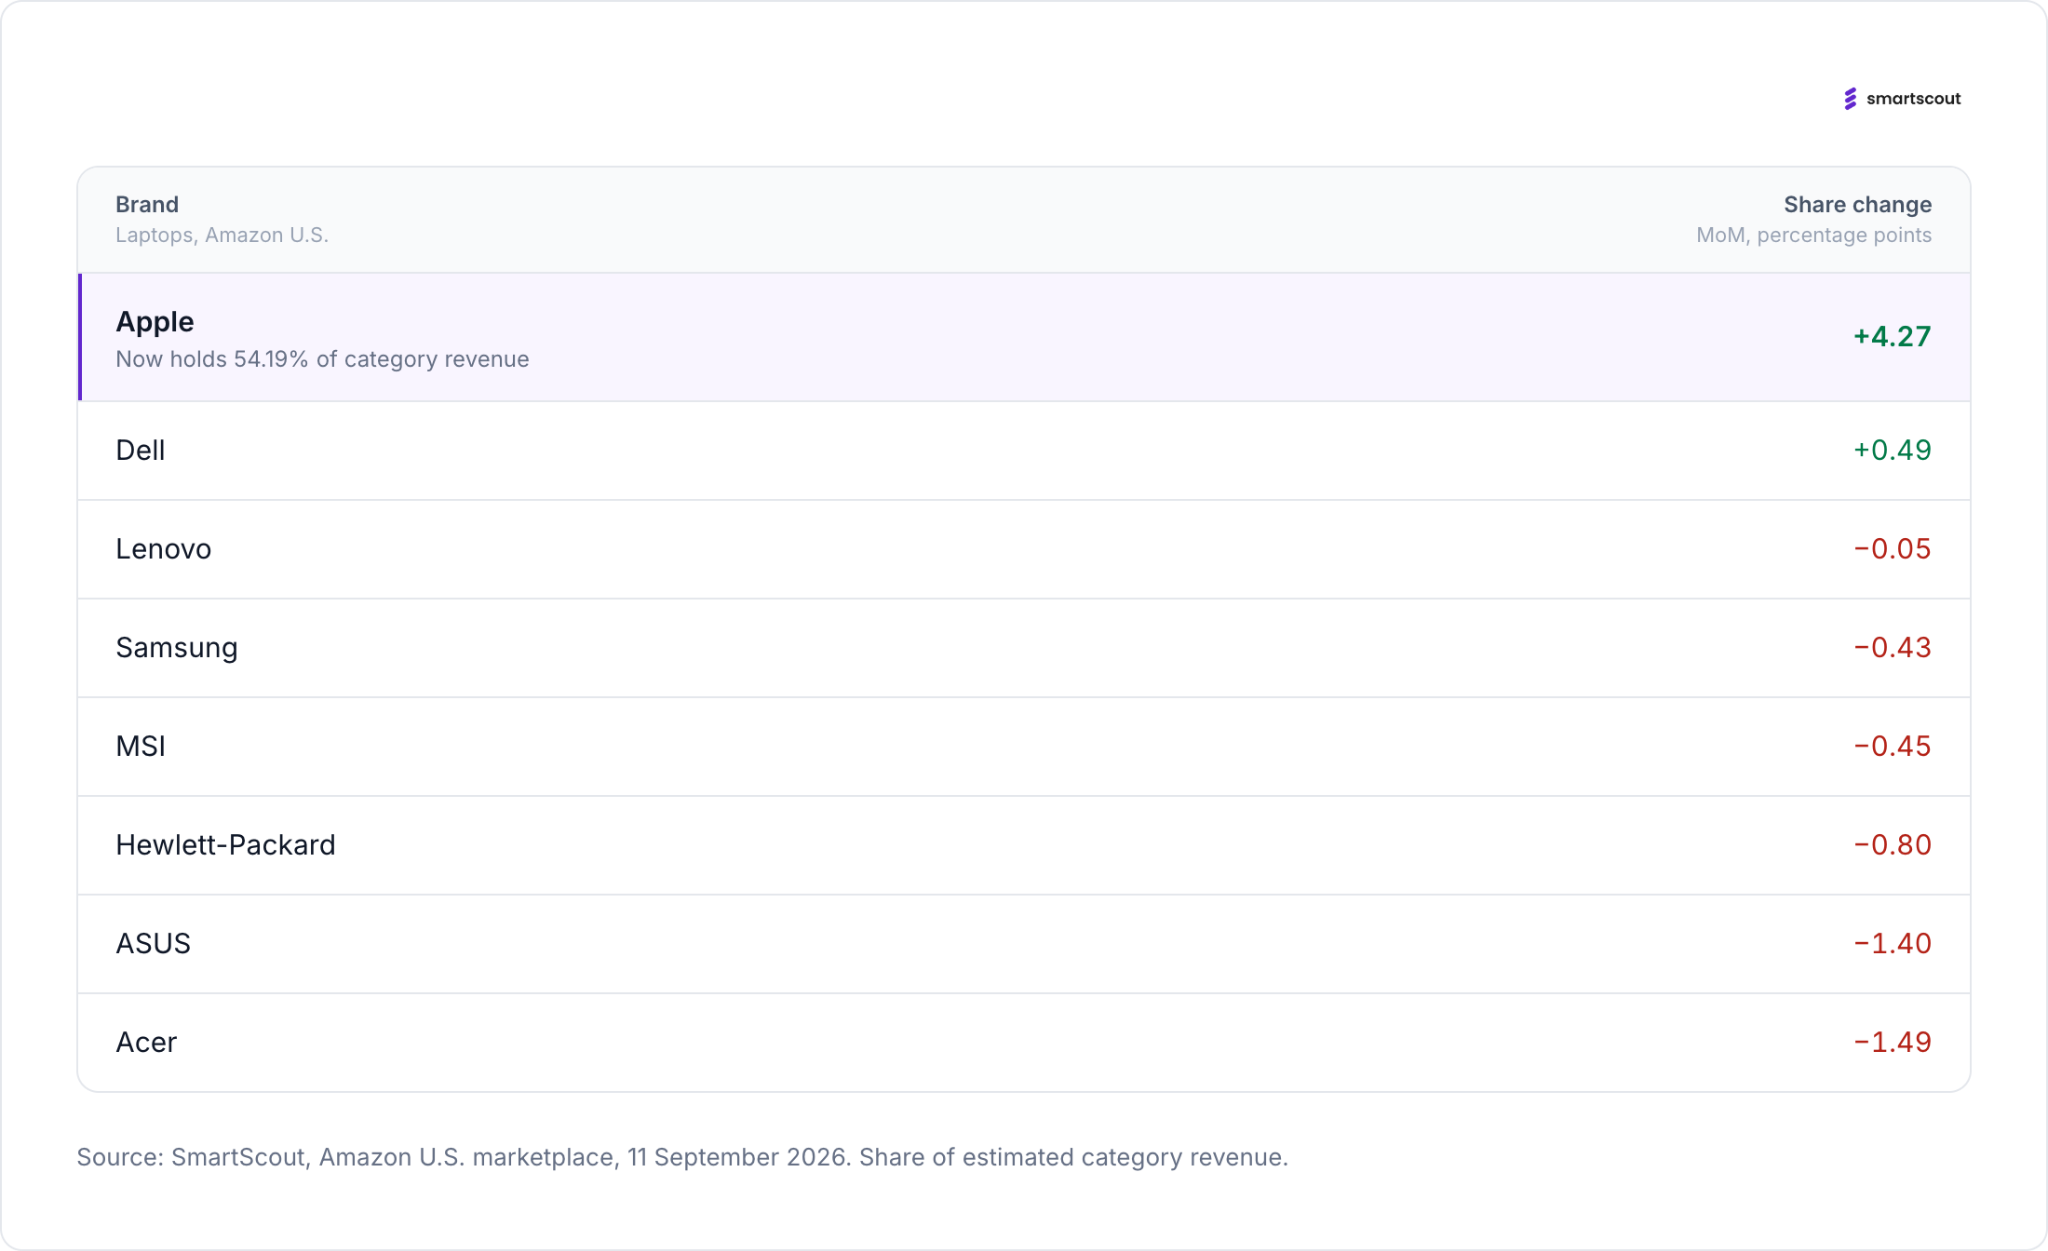
Apple now holds 54.19 percent of Amazon US laptop revenue, up 4.27 points month over month, and accounts for 50.6 percent of all advertising spend in the category. It gained that share in the same period it raised prices on Macs and iPads by as much as 25 percent, citing memory costs.
The brands that lost ground are the ones that buy memory and storage on the open market and sell into the enthusiast segment. Acer fell 1.49 points and lost 3,460 units. ASUS fell 1.40 points. Hewlett-Packard fell 0.80. MSI, whose average selling price of $2,520 is the highest of any volume brand in the category, fell 0.45 points and lost 594 units. Samsung fell 0.43 points and lost 3,211 units.
Component scarcity rewards whoever has the longest contracts and the most leverage with three suppliers. On Amazon, that is currently Apple.