



A shopper discovers your product in a TikTok video, skips the shopping link, and buys it on Amazon two days later. Another searches for your brand on Google. A third adds it to their next Walmart order.
TikTok Shop’s dashboard cannot tell that whole story.
The TikTok Shop halo effect is the demand that TikTok content, creators, and advertising generate beyond the purchases recorded inside TikTok Shop. Measuring it helps brands understand whether their investment is creating value across the business.
The best software depends on the question you want answered. Are branded searches growing? Are marketplace sales moving with creator activity? Or did a campaign generate sales that would not have happened otherwise?
These six tools approach those questions from different angles.
Best TikTok Shop Halo Effect Tools at a Glance
1) SmartScout
Best for understanding the halo effect across marketplaces
A TikTok Shop success story becomes more interesting when you can see what happens to the same brand elsewhere.
SmartScout brings together revenue and keyword tracking with TikTok Shop, Amazon brand search, and Walmart Marketplace intelligence. That gives brands and agencies a useful starting point for examining whether TikTok momentum coincides with broader marketplace demand.
For example, a brand can examine a TikTok Shop growth period alongside Amazon branded searches and revenue trends, then assess its Walmart Marketplace performance. The question becomes: are more customers looking for this brand, and where is that demand converting?
SmartScout’s broader marketplace research also adds competitive context. Growth is more meaningful when you can compare it with the surrounding category and other brands, rather than looking at a sales chart in isolation.
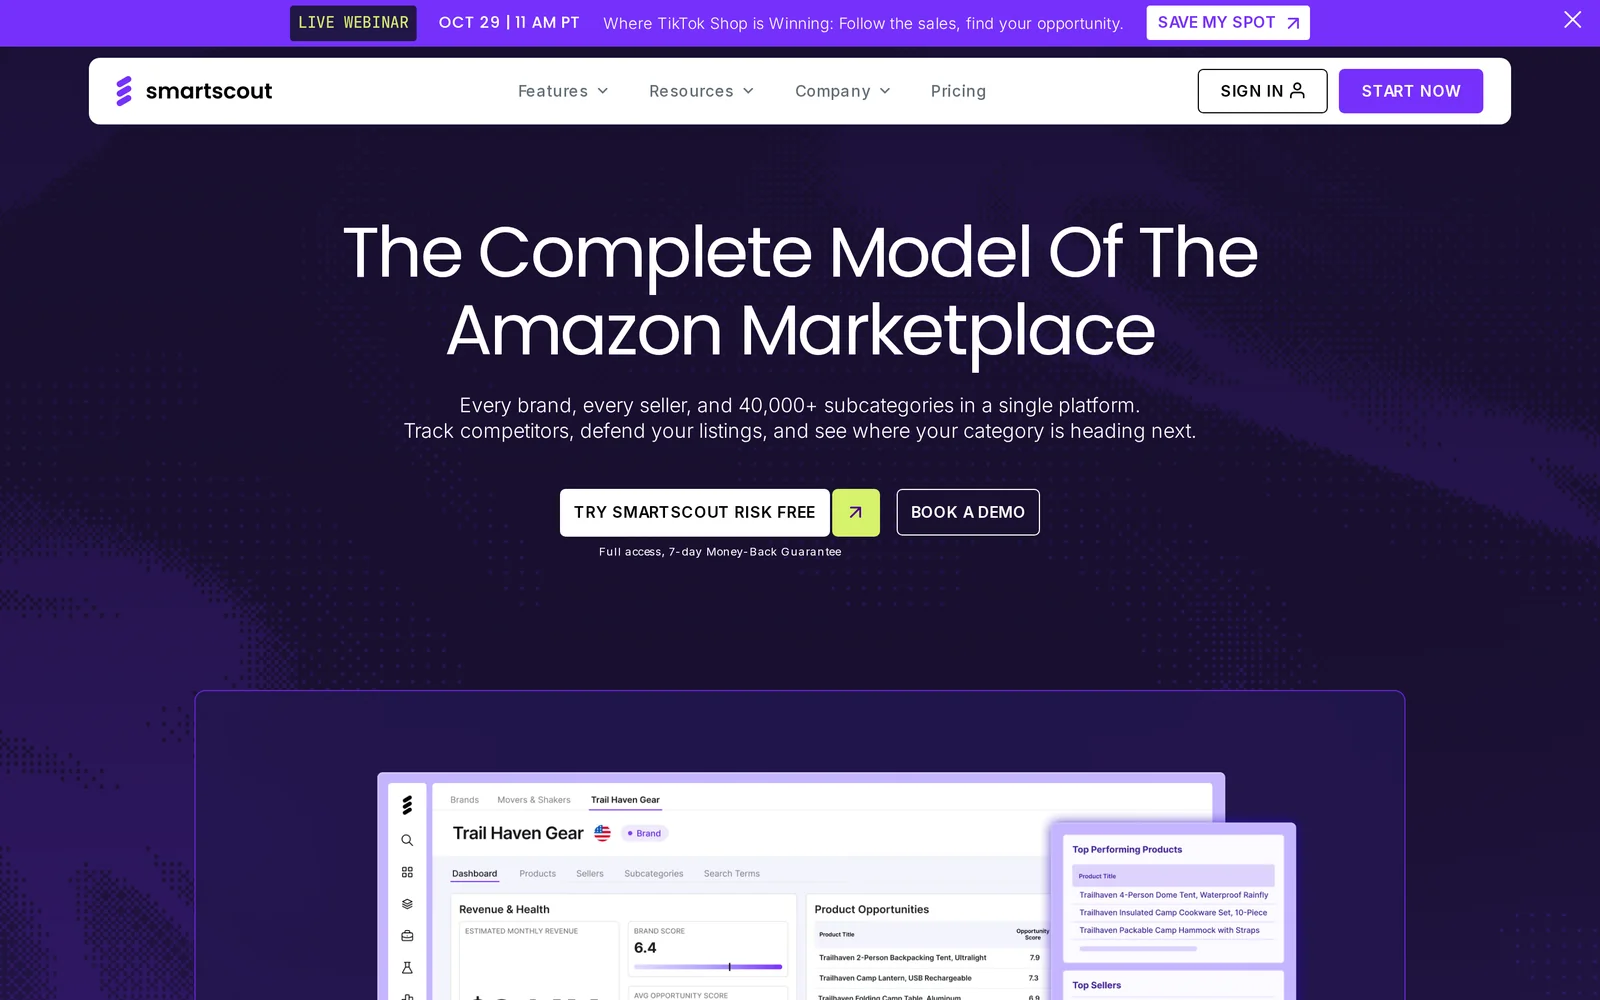
What makes it interesting: It connects demand signals with marketplace performance and competitive research. That is particularly valuable for businesses whose customers buy across several marketplaces.
Use these trends to identify potential halo effects and investigate them further. Parallel growth alone does not establish how much revenue TikTok caused.
2) Euka
Best for connecting creator activity with off-platform revenue
Euka is a strong fit for teams running TikTok Shop affiliate programs that want to understand what happens beyond in-app GMV.
Its Halo Effect feature places TikTok views and TikTok Shop sales alongside connected Amazon and Shopify data. Amazon Seller Central connections can also supply search-term data; Vendor Central connections provide detail page views instead.
The feature estimates a sales baseline and the relationship between TikTok views and additional revenue. This gives affiliate managers a practical way to discuss whether creator activity is associated with a wider commercial benefit.
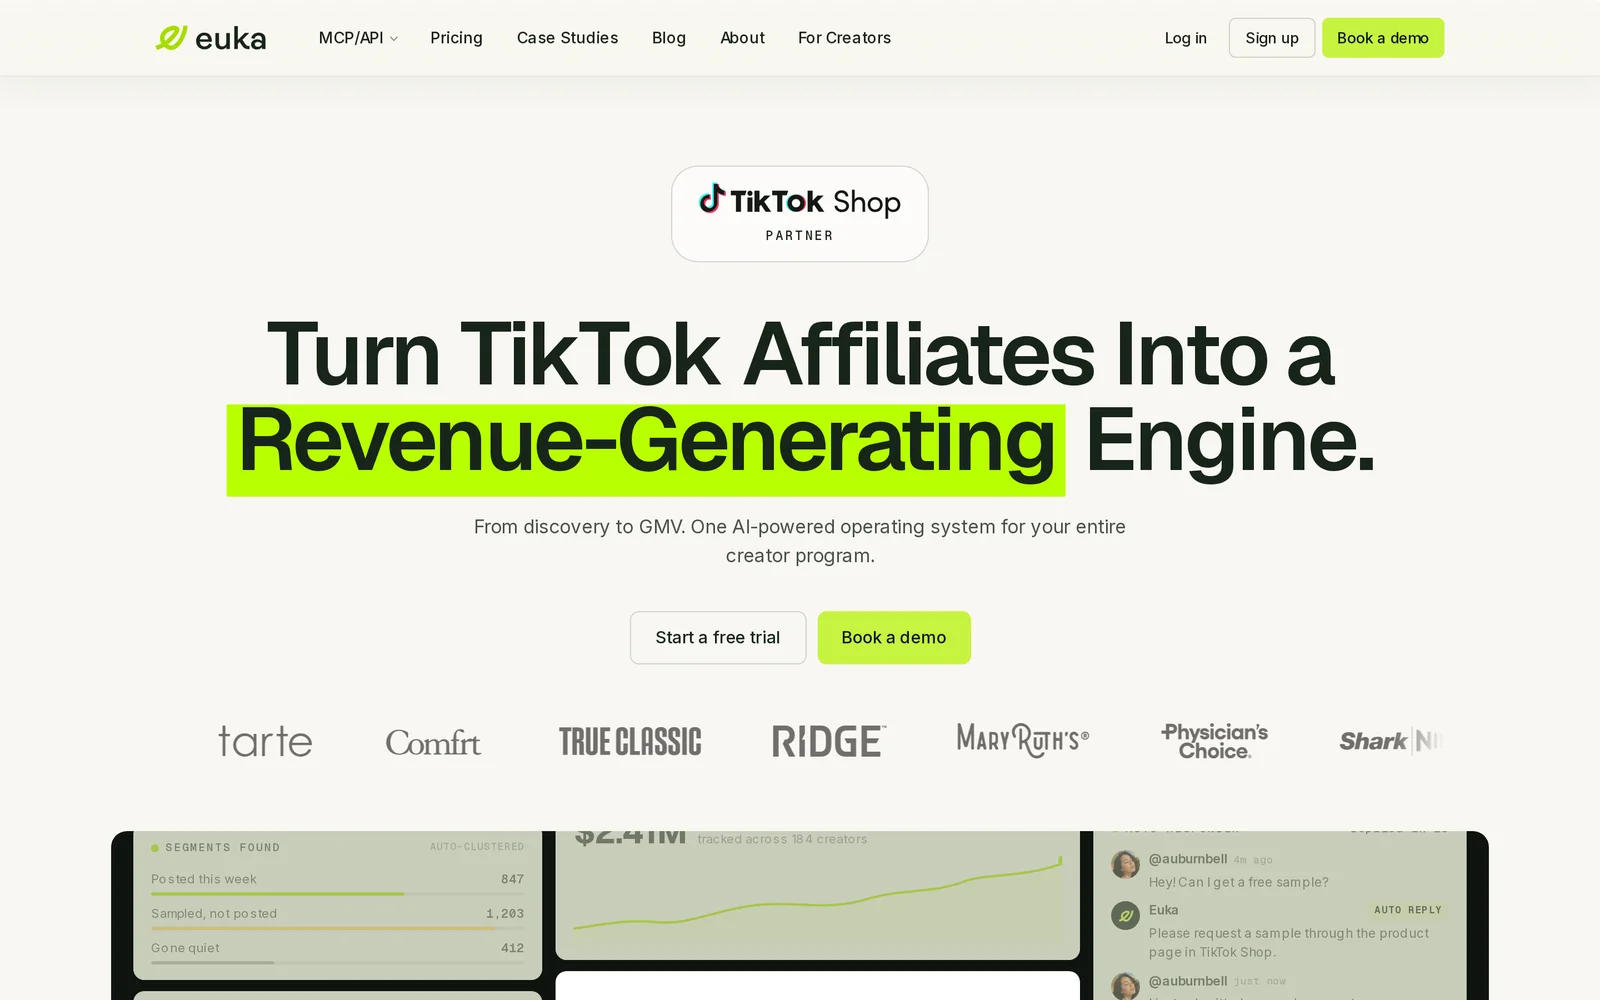
What makes it interesting: Halo reporting sits close to the creator program itself, making it useful for teams evaluating the broader value of their content engine.
Euka explicitly describes these estimates as relationships, not proof of causation. Promotions, holidays, and other advertising can move views and sales together, while delayed purchases can weaken same-period comparisons.
3) Fospha
Best for measuring paid media across sales destinations
A customer may encounter a TikTok ad and purchase on Amazon. Another may see a Meta ad and buy through TikTok Shop. Fospha addresses this movement between advertising platforms and purchase destinations.
Its Halo product combines DTC, Amazon, and TikTok Shop measurement and models how external paid media contributes to marketplace sales. This supports a broader view of return on advertising than a website-only or marketplace-only report.
For brands investing in TikTok advertising, that can help answer whether campaigns look less efficient simply because some customers complete their purchases elsewhere.
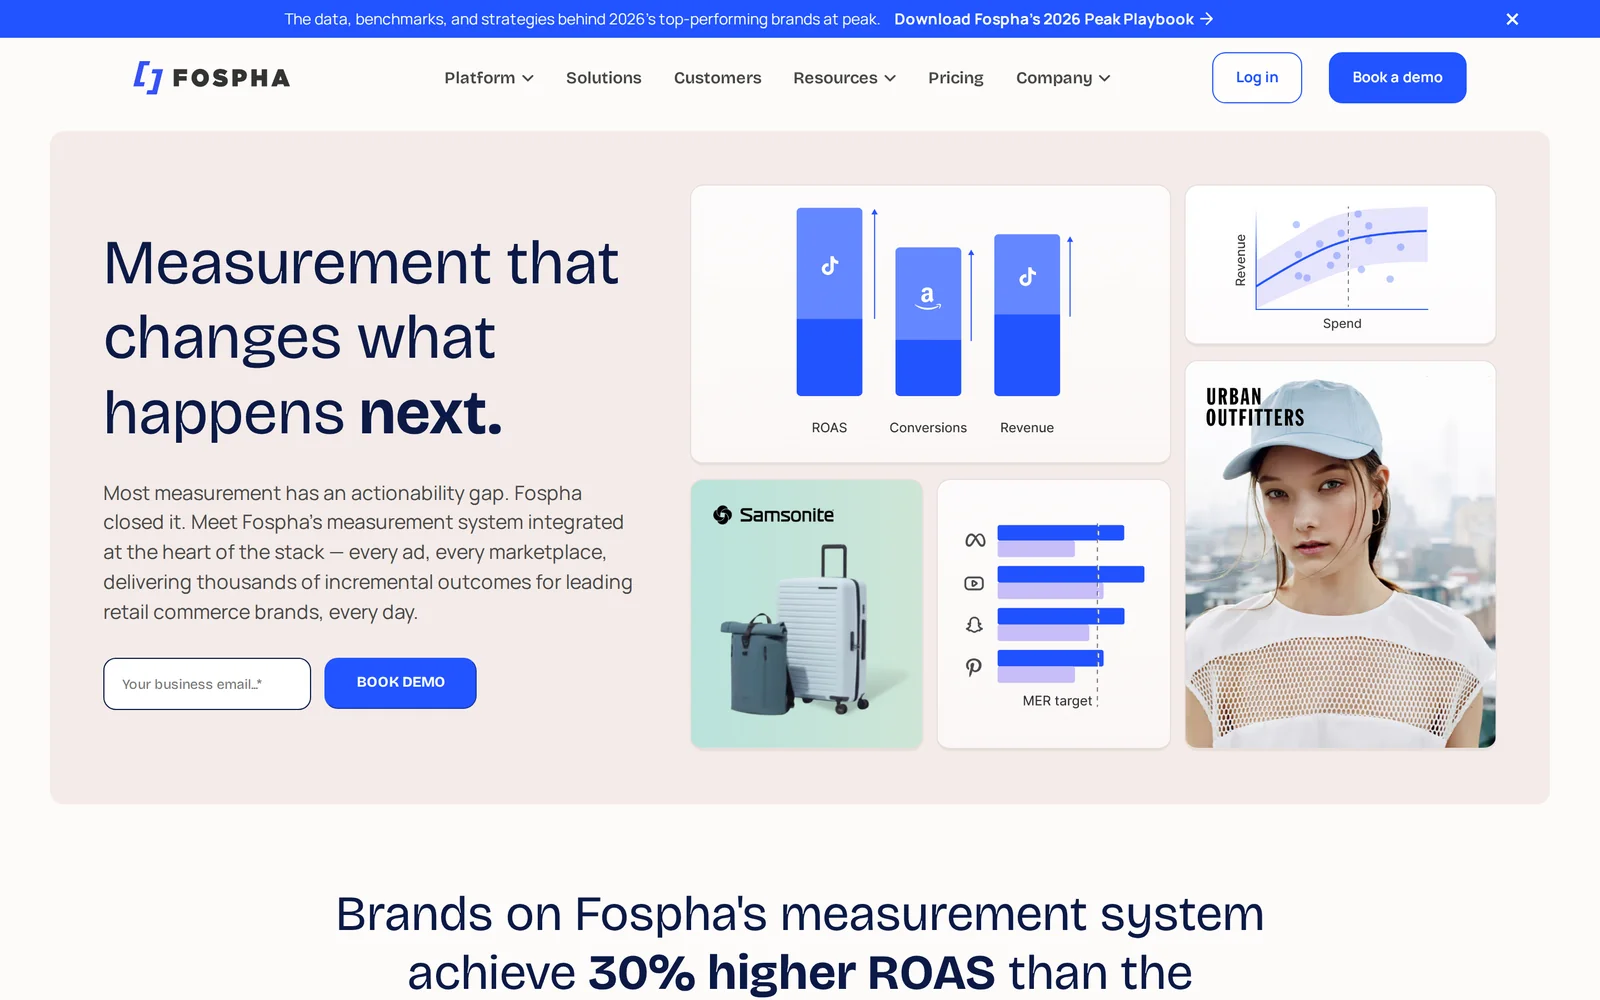
What makes it interesting: Fospha evaluates media across multiple sales destinations, helping ecommerce and advertising teams make budget decisions using a shared view.
Its strongest fit here is paid-media measurement. Model-based contribution estimates should not be treated as a direct count of every purchase inspired by organic creator content.
4) WorkMagic
Best for testing whether TikTok creates incremental sales
When the next budget increase is substantial, seeing two charts rise together may not be enough. WorkMagic offers geographic incrementality testing to estimate what advertising adds beyond the sales a business would otherwise generate.
In a published TikTok case study, WorkMagic compared matched markets where advertising was paused with markets where it continued. The analysis incorporated sales and location data from Amazon, Walmart, and Target.
WorkMagic reported that 62.5% of the measured TikTok Ads impact occurred outside TikTok Shop in that study. That is a result for one brand, not a benchmark to apply to every business.
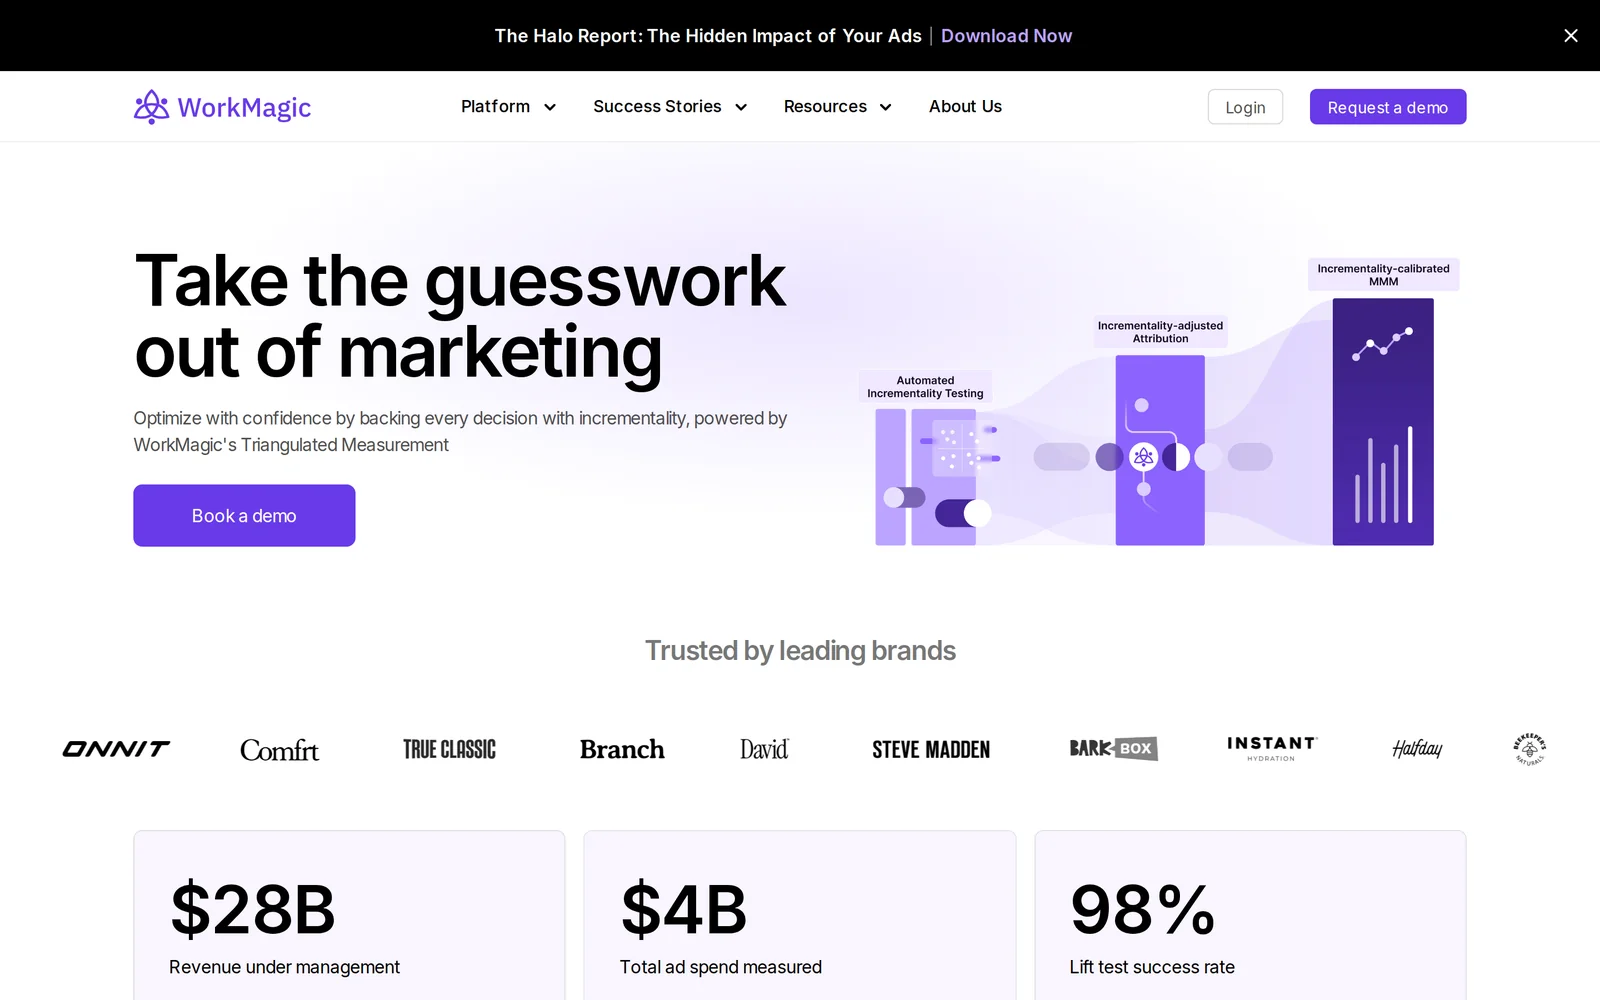
What makes it interesting: It moves the question from “Did sales rise?” to “How much additional demand did this advertising create?”
This approach requires suitable data, enough scale, and a workable experiment. Testing paid TikTok activity also does not automatically isolate the impact of every organic TikTok Shop video.
5) KnoCommerce
Best for discovering the customer journeys that click tracking misses
Sometimes the most useful measurement comes from asking the customer.
KnoCommerce provides post-purchase surveys that help brands understand how shoppers discovered them and how long they took to buy. TikTok also identifies KnoCommerce as a post-purchase survey partner.
For a DTC brand, a useful survey could ask where a customer first encountered the brand, followed by whether they remember a TikTok creator, a shoppable video, or an advertisement.
That can reveal a journey in which TikTok introduced the product, but Google or a direct website visit captured the purchase.
What makes it interesting: Customer responses add context that a revenue chart or tracking pixel cannot provide.
Survey responses are subject to memory and response bias. Surveys on your own storefront also do not automatically capture the experience of customers who purchased on Amazon or Walmart.
6) Google Trends
Best for a free first look at branded search demand
Google Trends offers a simple way to investigate whether interest in your brand changed around a TikTok campaign or viral moment.
Compare your brand and product search terms over time, examine geographic differences, and use category terms or competitors as context. A sustained rise in branded interest can be a useful signal to investigate alongside marketplace revenue and creator activity.
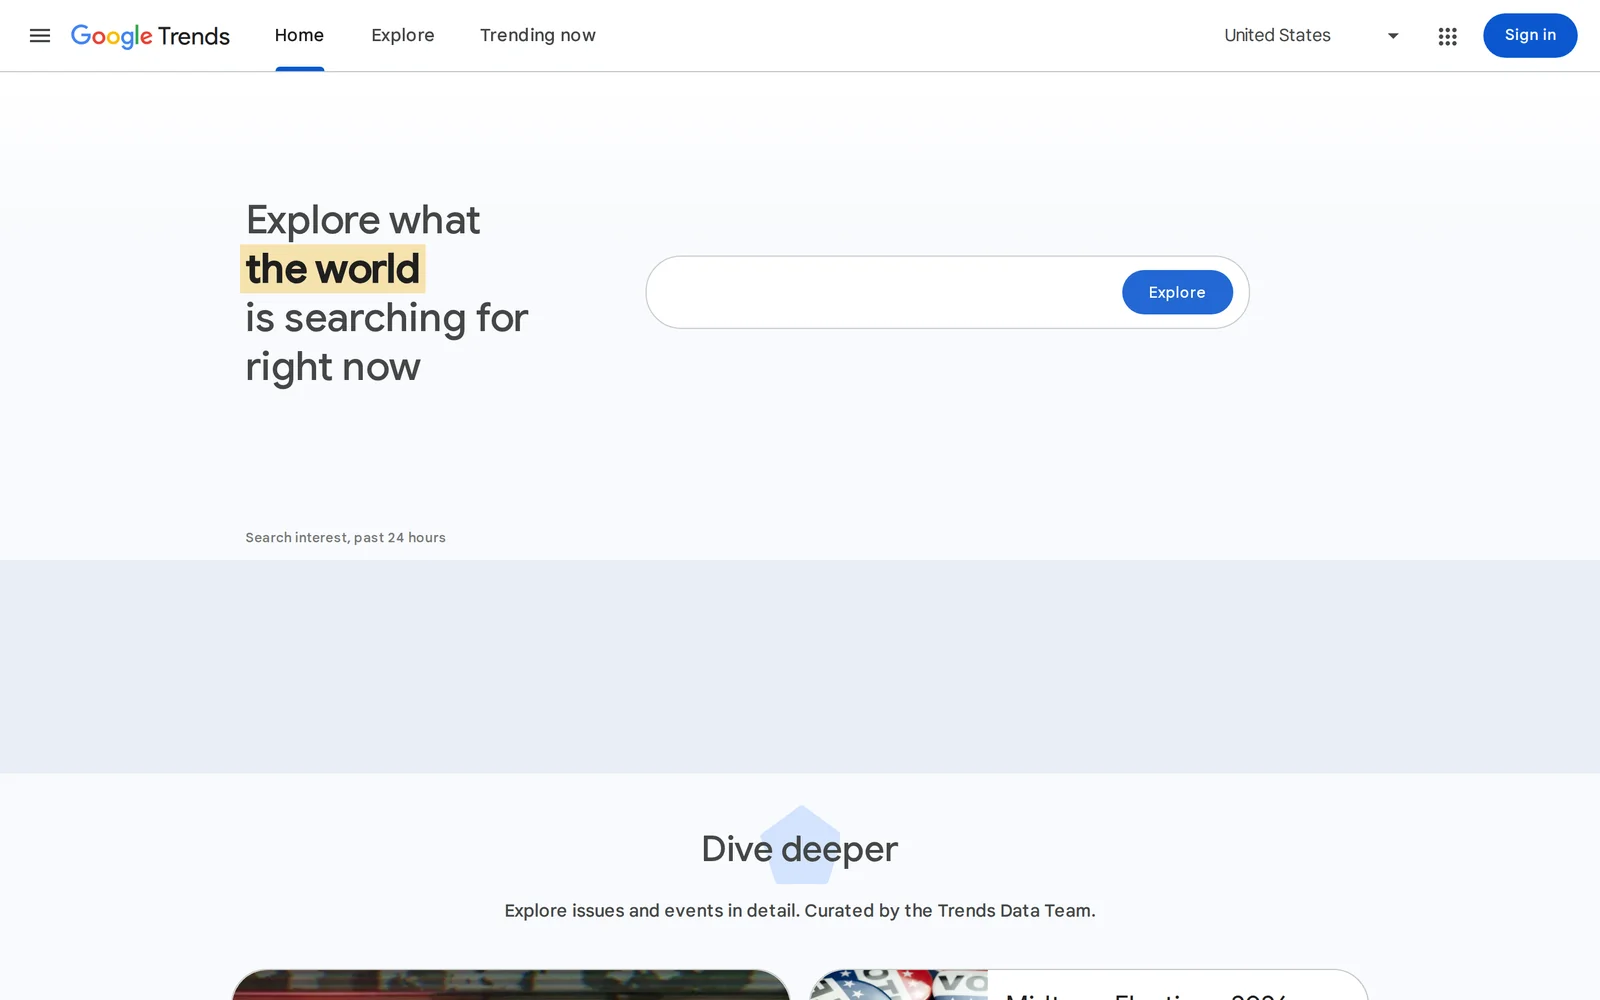
What makes it interesting: It helps you see whether attention extends beyond TikTok before investing in a more sophisticated measurement program.
Google Trends reports normalized relative interest on a 0–100 scale, not absolute search counts or revenue. Low-volume brands may have limited usable data, and a search spike does not identify its cause.
How To Choose Your Measurement Stack
Start with the decision you need to make.
For marketplace visibility, SmartScout offers a useful foundation: examine revenue, branded search, and the competitive environment together. If your team manages TikTok Shop creators, Euka adds a closer view of how content activity relates to connected-store performance.
For paid-media allocation, consider Fospha’s cross-channel modeling or WorkMagic’s incrementality testing. For a DTC business, KnoCommerce can explain how customers discovered the brand, while Google Trends adds a broader search-demand signal.
You do not need all six. You need complementary evidence.
Establish a baseline before a campaign, align reporting periods, and track promotions, stockouts, pricing changes, and other advertising. Allow for purchases that happen days or weeks after discovery. Keep TikTok Shop revenue separate from off-platform revenue, and avoid adding together estimates that may describe the same sales.
The goal is to understand how TikTok changes demand across your business—and use that evidence to decide where the next dollar should go.





