
With millions of products and thousands of categories, knowing “who’s winning” on Amazon is tough.
For Amazon sellers, agencies, and brand managers, understanding market share by category is like reading the scoreboard of a game – it shows which brands lead and how everyone else stacks up.
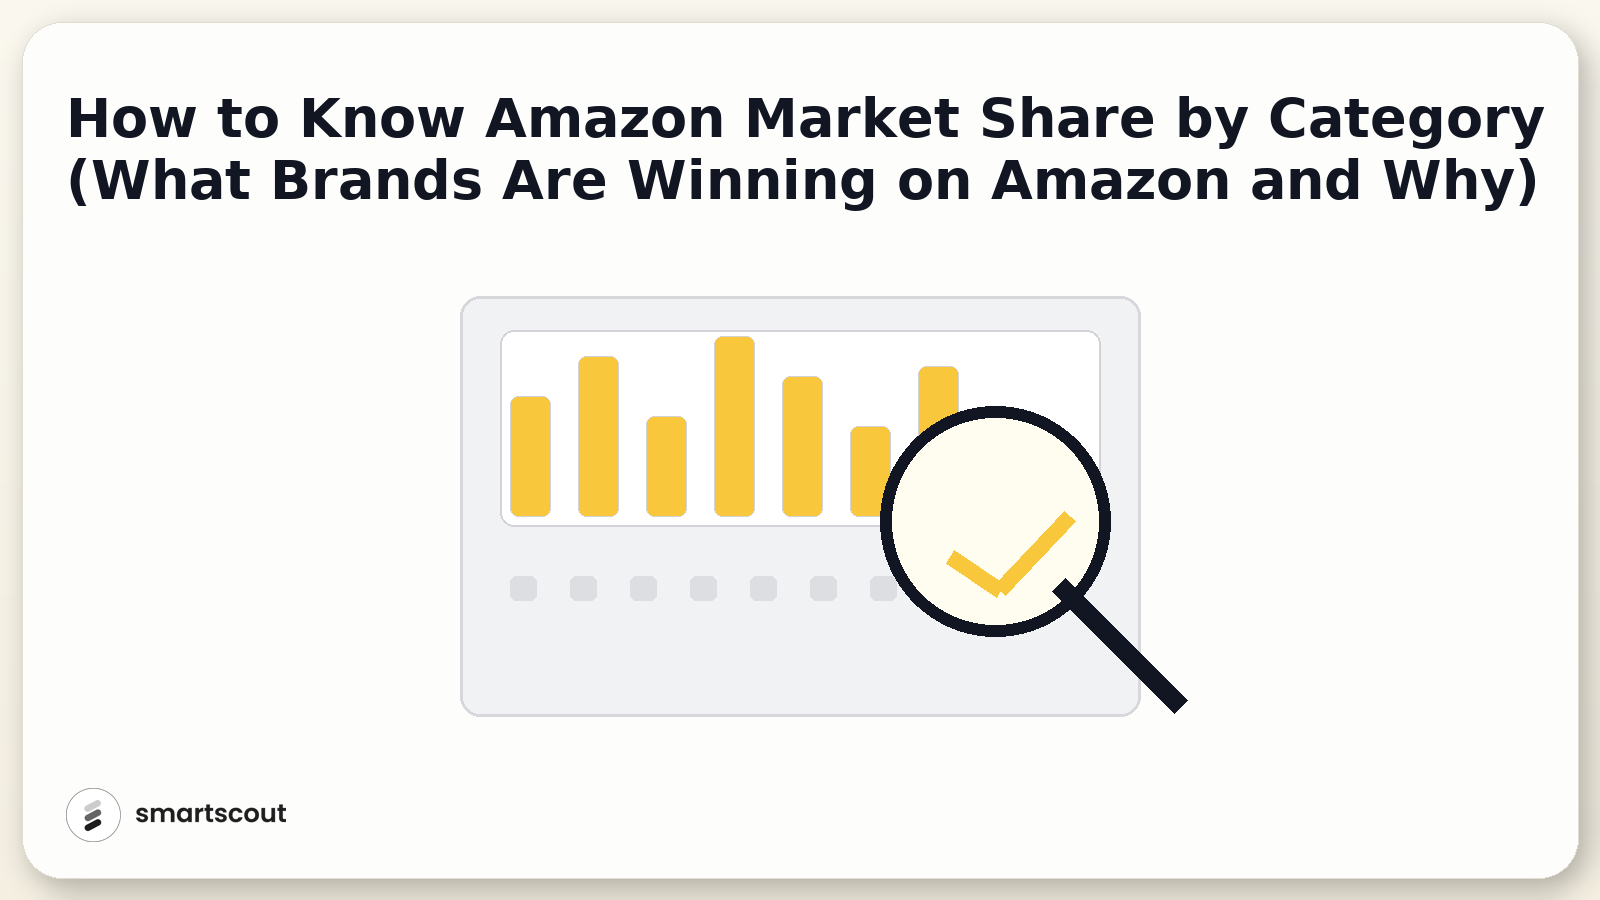
Here you will learn why category market share matters, how to find it (using tools like SmartScout), and what insights you can gain about which brands are winning and why.
Market share is essentially the percentage of total sales in a category that a brand accounts for. It tells you who the market leaders are and how far ahead they are. This information is invaluable for several reasons, many of which are the same four reasons big brands justify paying $30K+ for traditional market share reports:
Some categories are also simply more crowded than others. Books, Electronics, and Clothing, Shoes & Jewelry are consistently among the most popular Amazon categories, while others are still emerging or more niche. If you’re still deciding where to compete before worrying about market share, check out our breakdown of the most popular categories for selling on Amazon and what makes each one attractive (or difficult) for sellers.
Despite its importance, category-level market share on Amazon is not easy to obtain. Amazon doesn’t publicly report what percentage of a category each brand holds. Traditionally, only expensive third-party reports could tell you “Brand X has Y% of Category Z.”
In fact, many market share services hide behind sales calls and paywalls, with a single report costing $30K or more. For a deeper breakdown of what those reports include, why brands still pay for them, and when that spend is overkill, read our guide on whether Amazon market share data is really worth $30K.
Why so costly? These reports compile sales estimates across millions of ASINs and often require complex modeling. However, paying $30K for a static report is often overkill, especially for smaller sellers.
As one SmartScout analysis put it, brands are overpaying, and there are now cheaper, more efficient ways to get Amazon market insights without breaking the bank.
This is where tools like SmartScout come in, democratizing market share data for everyday Amazon professionals. Instead of a one-time report, you can get continuous visibility into categories and brands at a fraction of the cost.
SmartScout is an Amazon intelligence software designed to reveal who’s winning in every niche. One of its flagship features is the Subcategories tool, essentially a catalogue of Amazon’s 40,000+ subcategories. SmartScout breaks down Amazon’s entire category hierarchy – from top-level categories down to micro-niches – showing estimated revenue and brand market share in each one.
Key capabilities of SmartScout’s Subcategories tool include:
SmartScout provides a 360° view of any category. It’s designed to give Amazon professionals the kind of competitive intelligence that was once reserved for big brands with big budgets. Subcategories tool “allows you to see sales and brand data across an entire category – stacking you up against all your competitors at the brand level”. Instead of looking at isolated products, you get the complete picture of the market.
When you’re evaluating subcategories, think in two phases:
Find the opportunity: Look for subcategories where most products have low average review ratings or where market share is spread widely across many brands. That usually means no single brand is truly satisfying customers yet.
Expand the opportunity: Once you have a foothold, use SmartScout’s Traffic Graph together with Subcategories to find neighboring products and variations that can grow your total share in the category.
Example: You operate in the “Protein Bars” subcategory. Rather than guessing who the top players are, SmartScout will show you something like: Brand A – 30% share, Brand B – 15%, Brand C – 10%, etc., along with the rest of the market. Immediately, you know the pecking order and how far ahead Brand A is. This context is critical to understand your place in the Amazon market.
If you’re new to thinking in subcategories, it helps to zoom out from a single product view. Subcategories is essentially all of our product research tools in one, letting you see sales and brand data across an entire category and down to the tiniest niches so you can understand your true place in the market. For a deeper dive into how to find the opportunity (where reviews are weak or share is fragmented) and expand the opportunity once you have a foothold, read What’s Up With Subcategories.
Here are a few examples of Amazon category leaders. Let's see which brands are winning, and why they hold their top positions. These examples show how market share data provides insight into brand dominance:
Table: Examples of Amazon subcategories and their top brands’ market share. (Sources: SmartScout data and industry reports.)
These cases highlight different dynamics of why brands win in their categories:
It’s also insightful to notice when a category is fragmented versus concentrated.
Popular categories like Books, Electronics, and Fashion come with built-in demand but also intense competition and more sophisticated incumbents, while smaller or emerging categories may offer less volume but a clearer path to meaningful market share for new entrants.
If one brand holds about 70% share, any challenger has an uphill fight. But if the leader has 20% and many others have 10-15%, the market is wide open. SmartScout helps reveal these structures at a glance, so you can decide whether to enter a niche or how to position against the leader.
Using SmartScout, look for subcategories where “there is a wide distribution of brands spread across a lot of market share.” Those niches may indicate opportunities since no single brand satisfies all customers. Conversely, if a single brand controls a subcategory, you might need a highly differentiated strategy (or choose an easier battleground).
We go much deeper into this “market leaders vs challengers” dynamic in Why Market Share is Essential on Amazon, where we connect category share directly to profitability and ad strategy. It includes how Quest Nutrition manages to dominate protein bars while spending less on ads than some competitors.
Knowing the numbers is just the start – the real goal is to apply these insights to your Amazon business. Here are some ways Amazon professionals can leverage category market share data:
For a real-world example of winning in a category most sellers avoid, see our breakdown of how Spreetail dominates oversized hot tubs in “How To Find an Unsaturated Category to Sell on Amazon.”
In Amazon, knowing market share by category and which brands are winning lets you act strategically instead of flying blind. SmartScout’s Subcategories tool helps you monitor competitors continuously, spot leaders’ advantages and upstart opportunities, and uncover the story behind the numbers without paying for a one time report.
Ready to find out who’s winning your category? Don’t leave it to guesswork.
SmartScout gives you the data and clarity to make the right moves on Amazon’s battlefield. Book a demo with SmartScout today and see how brand market share insights can turbocharge your Amazon strategy.
By understanding the market and your place in it, you’ll be equipped to take action – whether that’s toppling the category king or becoming one yourself.


