TikTok Shop crossed $50 billion in global GMV in just the first half of 2026. That puts it on track to surpass $100 billion for the full year, making it the fastest e-commerce platform to ever reach that milestone.
What started as a social commerce experiment inside a video app is now a top-tier global retail channel, one that added more GMV in 18 months than most marketplaces generate in a decade.
At SmartScout, we track TikTok Shop data at the category, shop, and product level. For this report, we combined publicly available data from industry trackers with our own proprietary data on category revenue, shop performance, and market structure.
Here is everything you need to know about TikTok Shop in 2026, backed by numbers.
Key TikTok Shop Statistics 2026
- TikTok Shop's global GMV reached $50.3 billion in H1 2026, up 92% year-over-year.
- The platform is projected to reach $123.5 billion in global GMV for full-year 2026.
- US GMV hit $11.8 billion in H1 2026, growing 103% year-over-year.
- There are over 15 million sellers on TikTok Shop globally.
- The US has 803,500 registered stores, though more than half recorded no sales.
- More than 5,700 US stores crossed $1 million in GMV in H1 2026, an 8x increase year-over-year.
- Beauty & Personal Care is the largest category, generating over $9.7 billion in lifetime revenue.
- TikTok Shop captured 18.2% of all US social commerce sales in 2025.
- 53.2 million US buyers purchased on TikTok in 2025, projected to reach 57.7 million in 2026.
- Affiliate-driven content accounts for 42% of total US TikTok Shop GMV.
- Shop tab now drives 51.4% of attributed GMV in the US, overtaking video and live.
- 97% of TikTok Shop customers in the US also shop on Amazon.
How Many TikTok Shops Are There?
TikTok Shop hosts more than 15 million sellers globally as of 2026. The platform operates in 16 countries as of mid-2026, with four more expected by year-end.
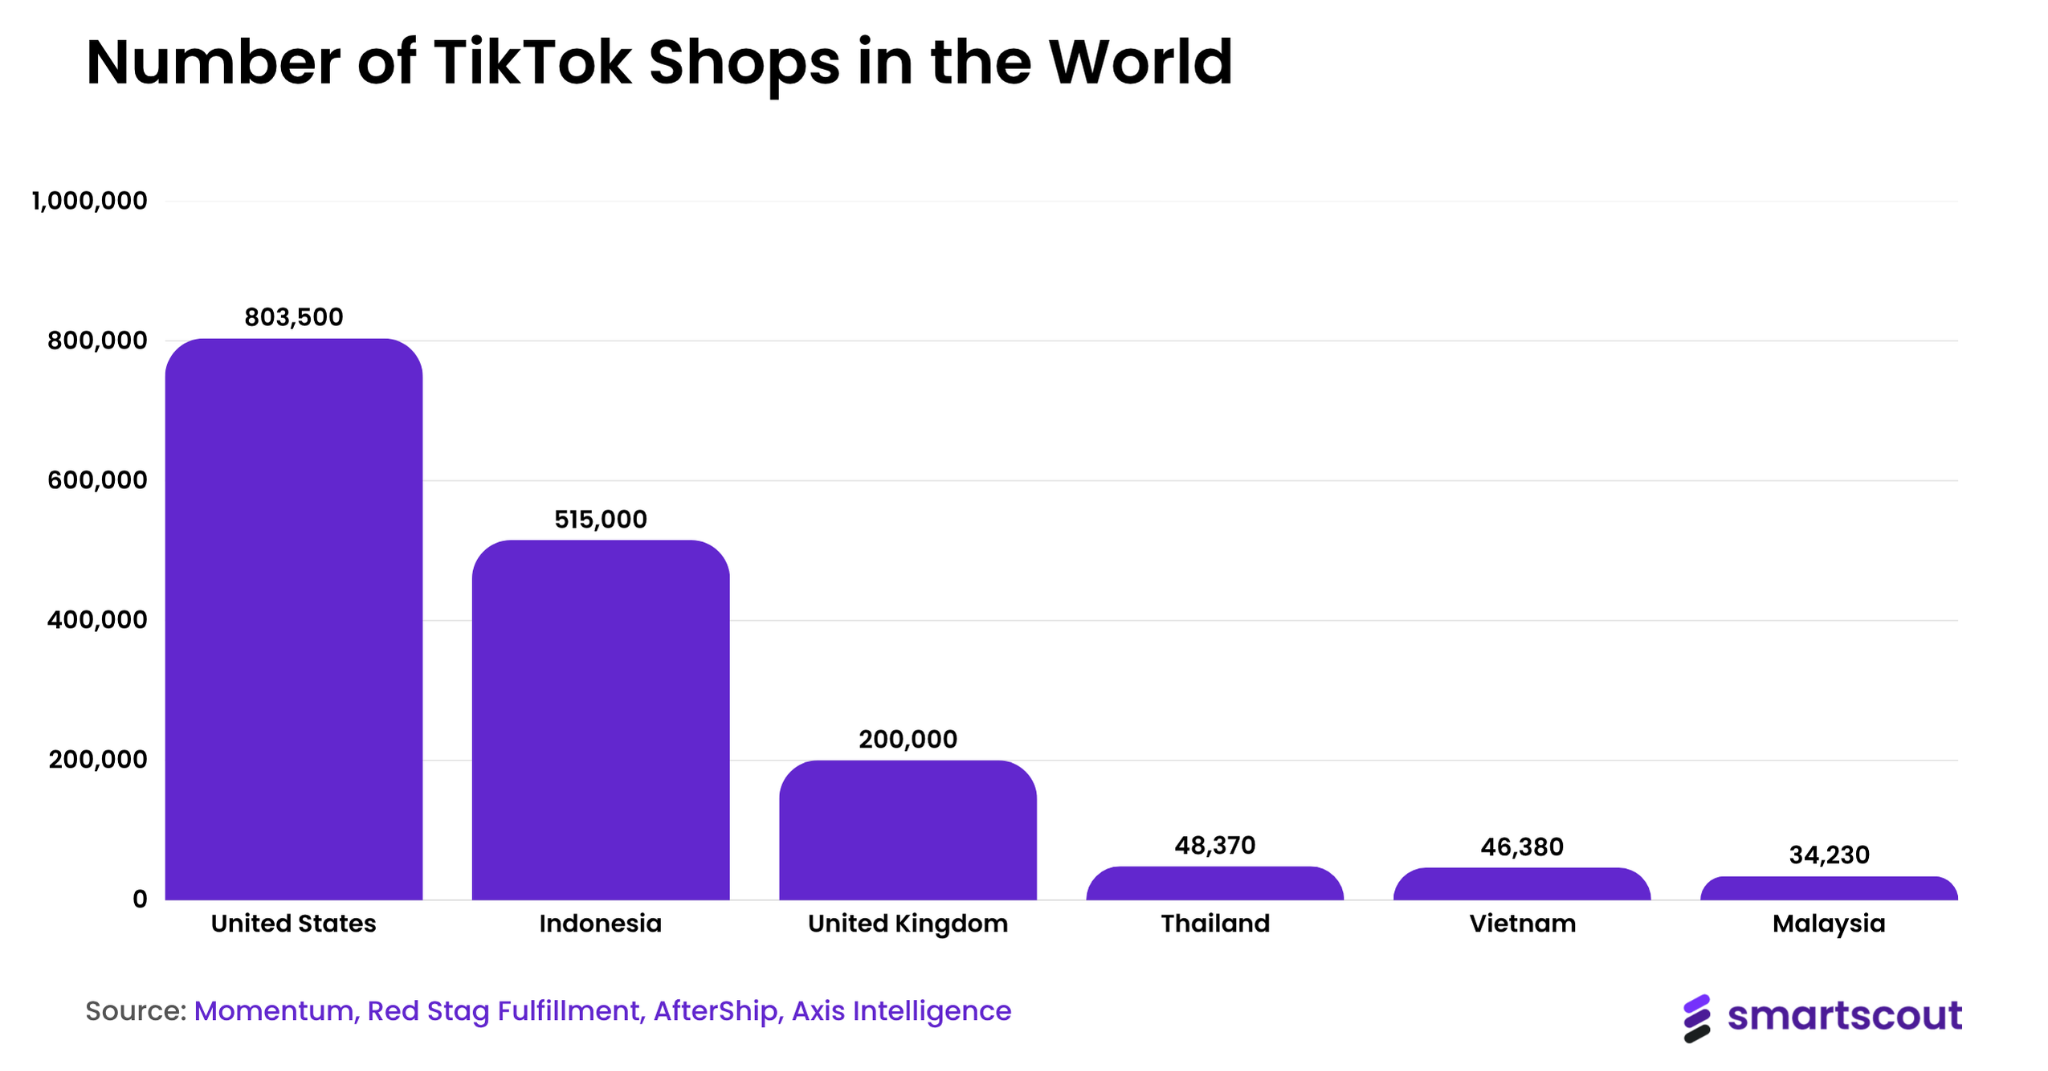
The US market saw the most dramatic expansion. Shop count grew from 4,450 in mid-2023 to 803,500 by the end of 2025. In the same period, US GMV went from near zero to $15.1 billion.
Southeast Asia still dominates total shop count. Indonesia alone has more registered shops than the entire US market, driven by TikTok's integration with Tokopedia and the region's deeply established social commerce behavior.
New markets launched in 2025 include Germany, France, Italy, and Brazil. Brazil launched in May 2025 and grew its monthly GMV from $1 million to $25.7 million within three months, reaching $46.1 million by August 2025.
Source: Momentum, Red Stag Fulfillment, AfterShip, Axis Intelligence
For a step-by-step breakdown of getting started, see our guide on how to sell on TikTok Shop.
TikTok Shop GMV & Revenue Statistics
TikTok Shop generated $64.3 billion in global GMV in 2025, nearly doubling its 2024 performance. In just the first half of 2026, that number already crossed $50.3 billion.
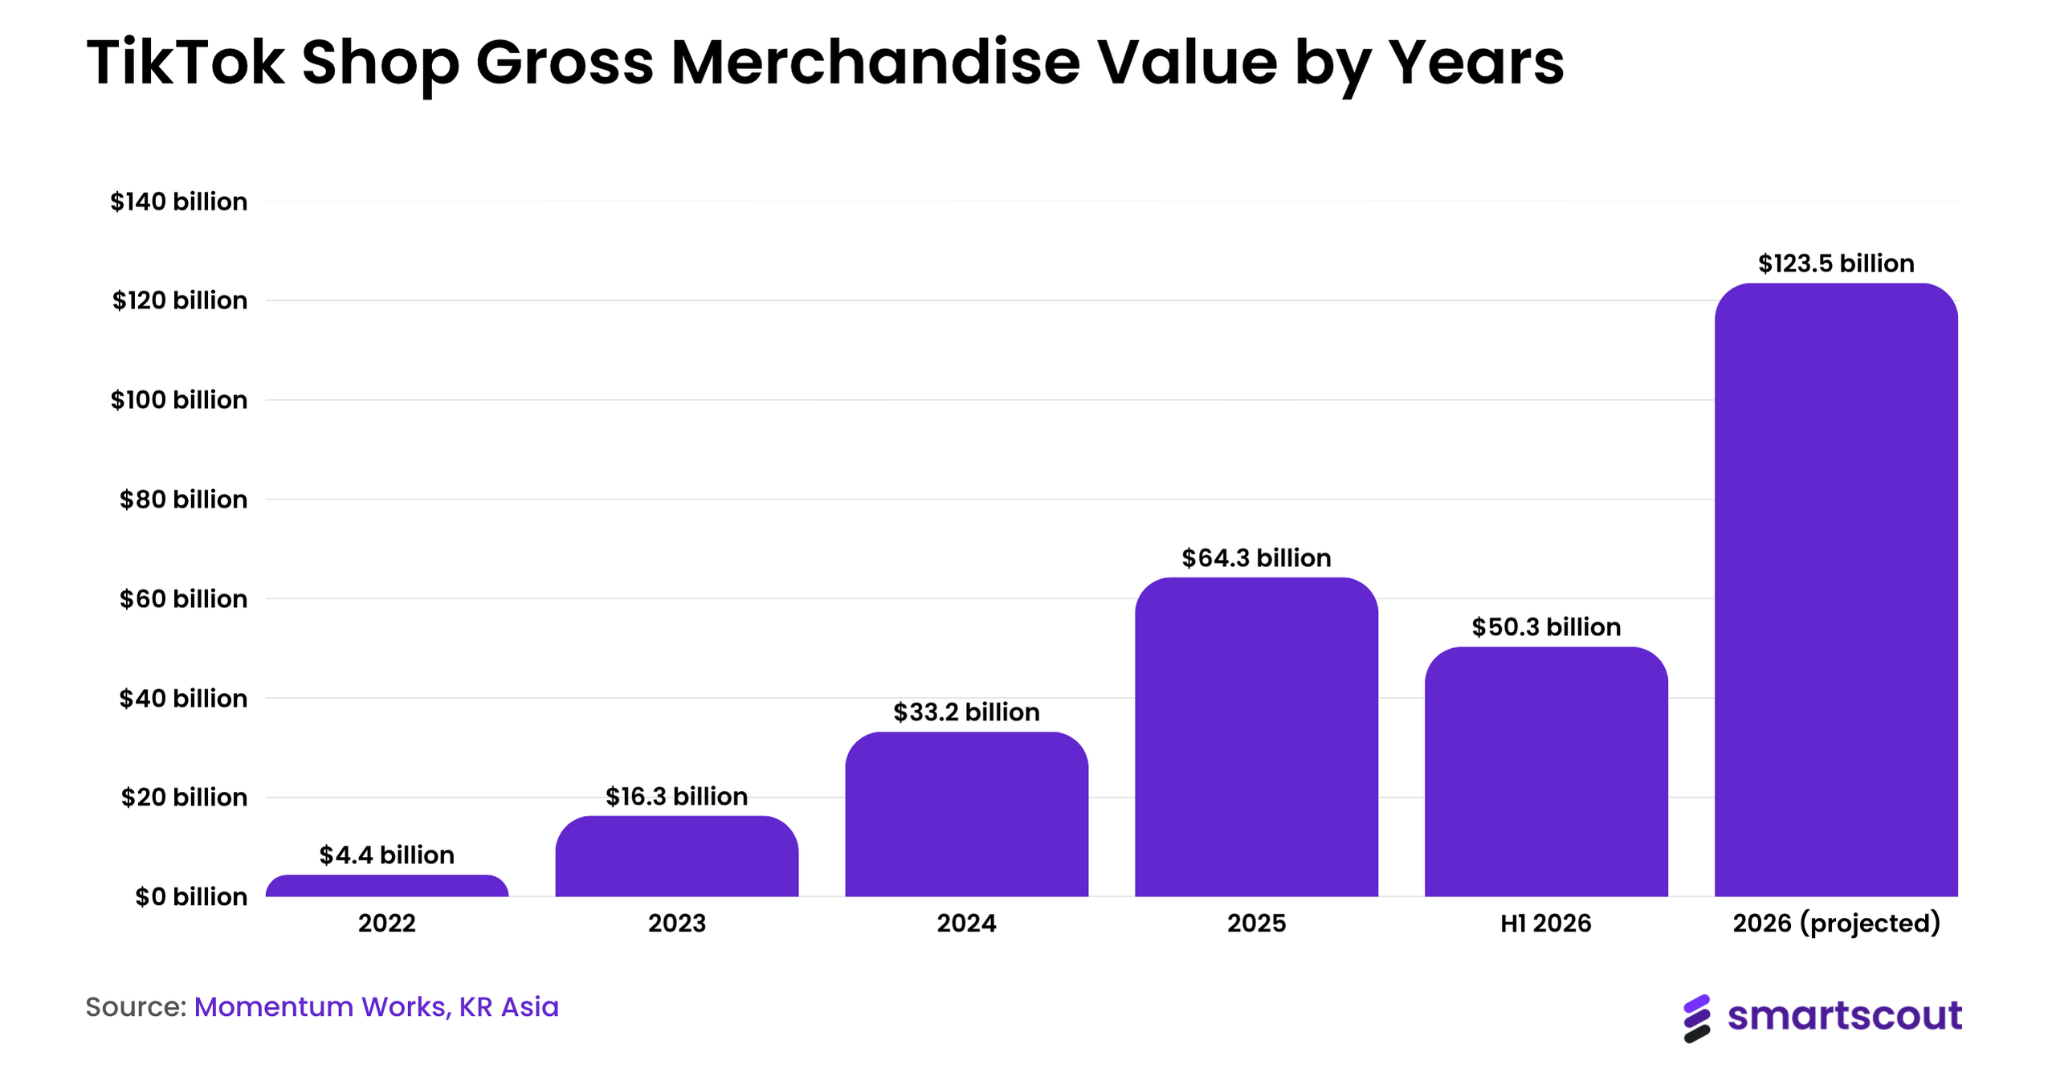
Here is how TikTok Shop's GMV has grown since launch:
Source: Momentum Works, KR Asia
Southeast Asia remains the primary GMV engine. The region doubled to $45.6 billion in GMV in 2025, with Indonesia contributing $13.1 billion alone.
Regional GMV breakdown for 2025:
Source: Momentum Works, TechNode Global
Note: GMV figures represent gross transaction values before returns and cancellations. TikTok does not publicly report net revenue from Shop, so all figures are estimates from third-party trackers.
TikTok Shop in the United States
TikTok Shop launched in the US in September 2023. It reached $9 billion in GMV within 16 months.
US GMV reached $15.1 billion in 2025, a 68% increase from $9 billion in 2024. In H1 2026 alone, the US hit $11.8 billion, growing 103% year-over-year. TikTok Shop captured 18.2% of all US social commerce sales in 2025.
A major structural shift happened in the US during H1 2026. The Shop tab (TikTok's in-app marketplace) now accounts for 51.4% of attributed GMV, up from 36% in 2025. Video dropped to 40.4%, and Live narrowed to just 8.2%.
The 2025 BFCM four-day shopping period generated over $500 million in sales in the US, with shoppers up 50% year-over-year.
Source: eMarketer, TikTok Newsroom, Momentum Works
TikTok Shop Demographics & Engagement
TikTok recorded 3.8 billion visits in August 2026, making it the 5th most-visited social media website in the world. Since the platform registers this much traffic, selling on this platform makes it much easier.
Monthly Visits
TikTok Shop (seller.tiktok) had 3 million visitors in August, with a decline of 26.37% from July 2026. An average person stays on the website for 1 minute 43 seconds and visits 1.45 pages on average.
Traffic Share by Country
The United States drives the most traffic among all the countries, with 29.78% of the total traffic. Vietnam and Indonesia come in second and third place in terms of traffic.
(Data as of September 2026)
Age Distribution
People aged between 25 and 34 years account for the most traffic on TikTok Shop, with 32.66% of the traffic.
Gender Share
Male shoppers on TikTok Shop slightly dominate the platform by accounting for 50.94% of the audience. Female shoppers are also very close, at 49.06%.
Source: SimilarWeb
Top TikTok Shop Categories by Revenue
Beauty & Personal Care dominates TikTok Shop by a wide margin. It has generated over $9.7 billion in lifetime revenue, nearly $3.4 billion more than the second-place category. Monthly revenue alone tops $515 million, more than the next two categories combined.
Womenswear & Underwear holds second place with $6.3 billion in lifetime revenue and nearly $378 million per month. Together, the top two categories account for more than 40% of all tracked category revenue on the platform.
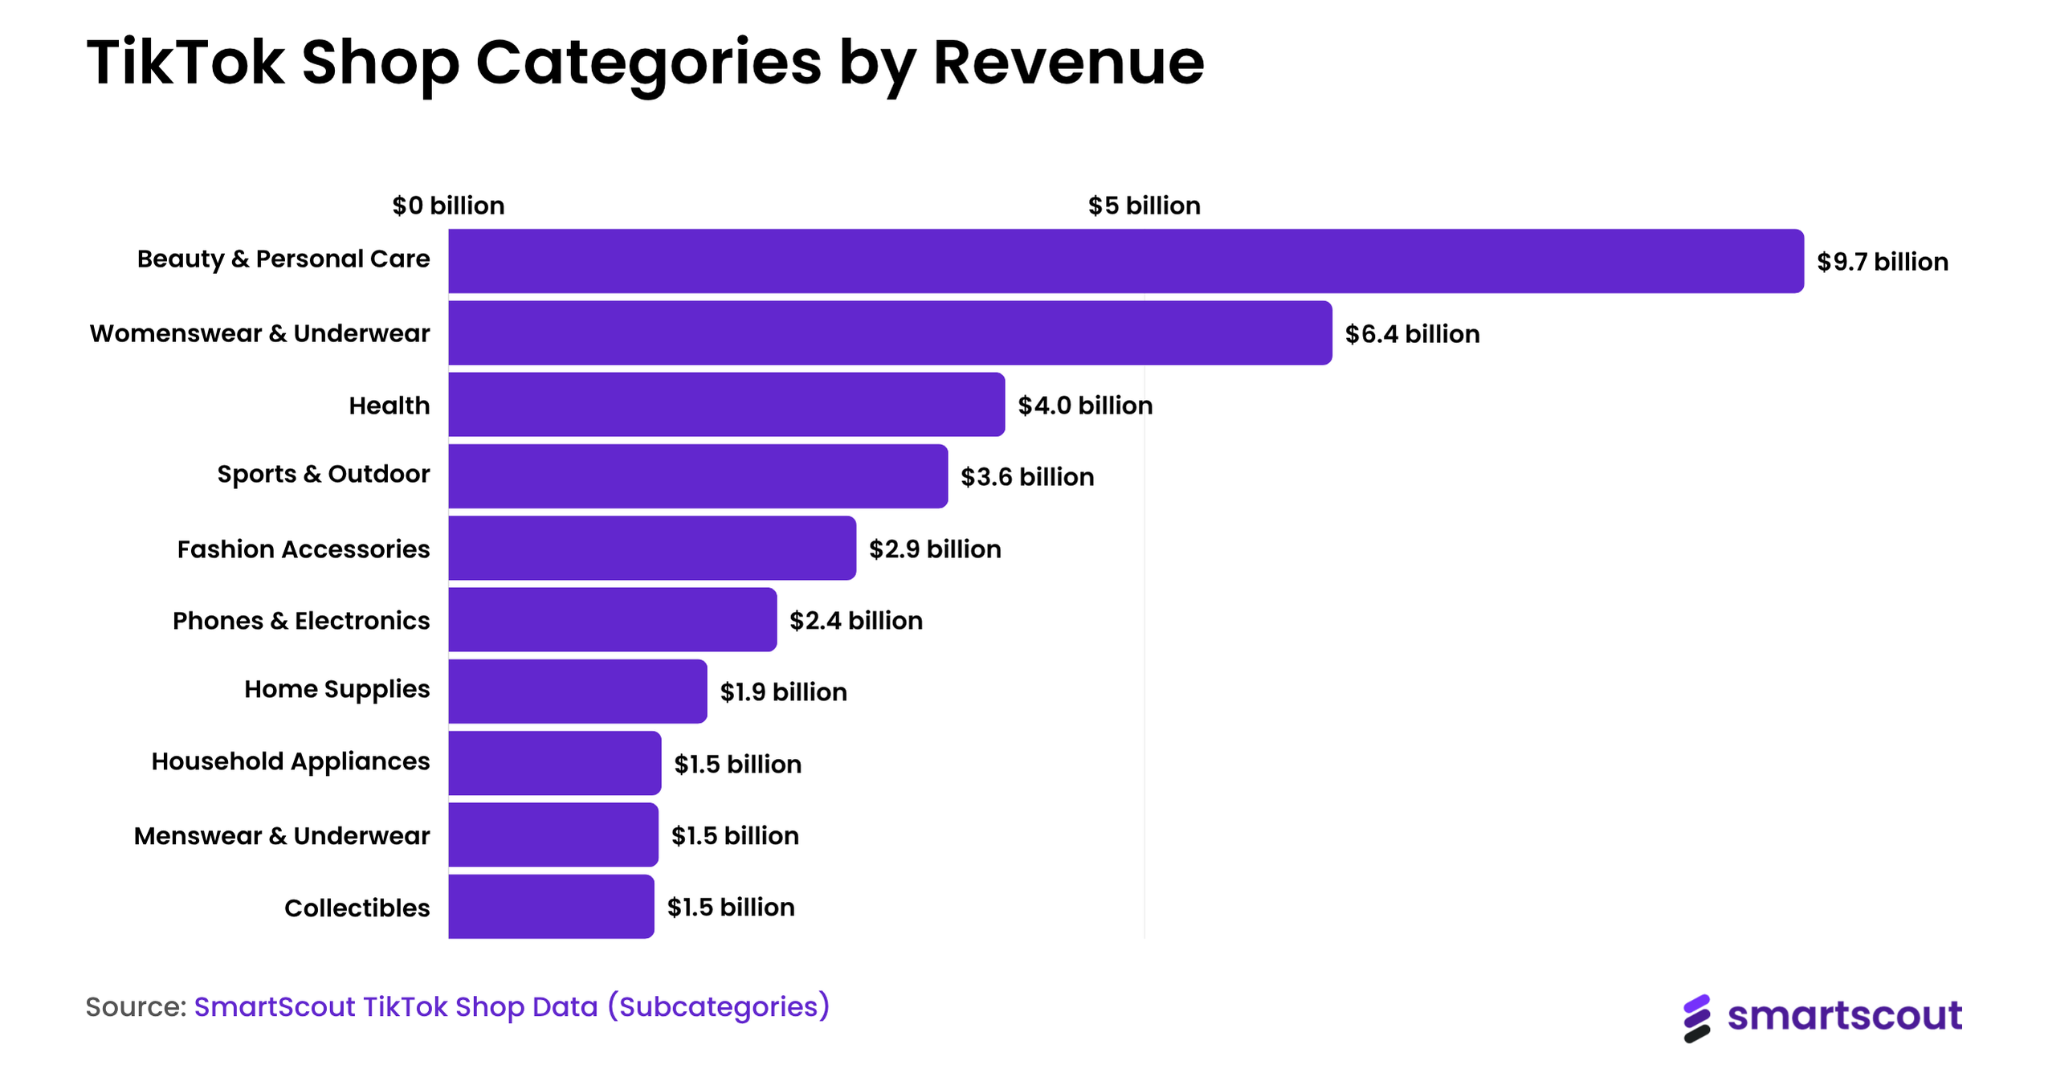
Here are the top 10 TikTok Shop categories ranked by lifetime revenue:
Source: SmartScout TikTok Shop Data (Subcategories)
Top 10 TikTok Shops in the US
medicube US Store is the highest-earning shop on TikTok, pulling in $39.6 million in monthly revenue and $638 million in lifetime revenue. It sells skin care kits and has built a dominant position through consistent creator-driven content and aggressive product launches.
Nine of the top 10 shops are based in the US. The only exception is Halara US, which is registered in China but sells primarily to US consumers.
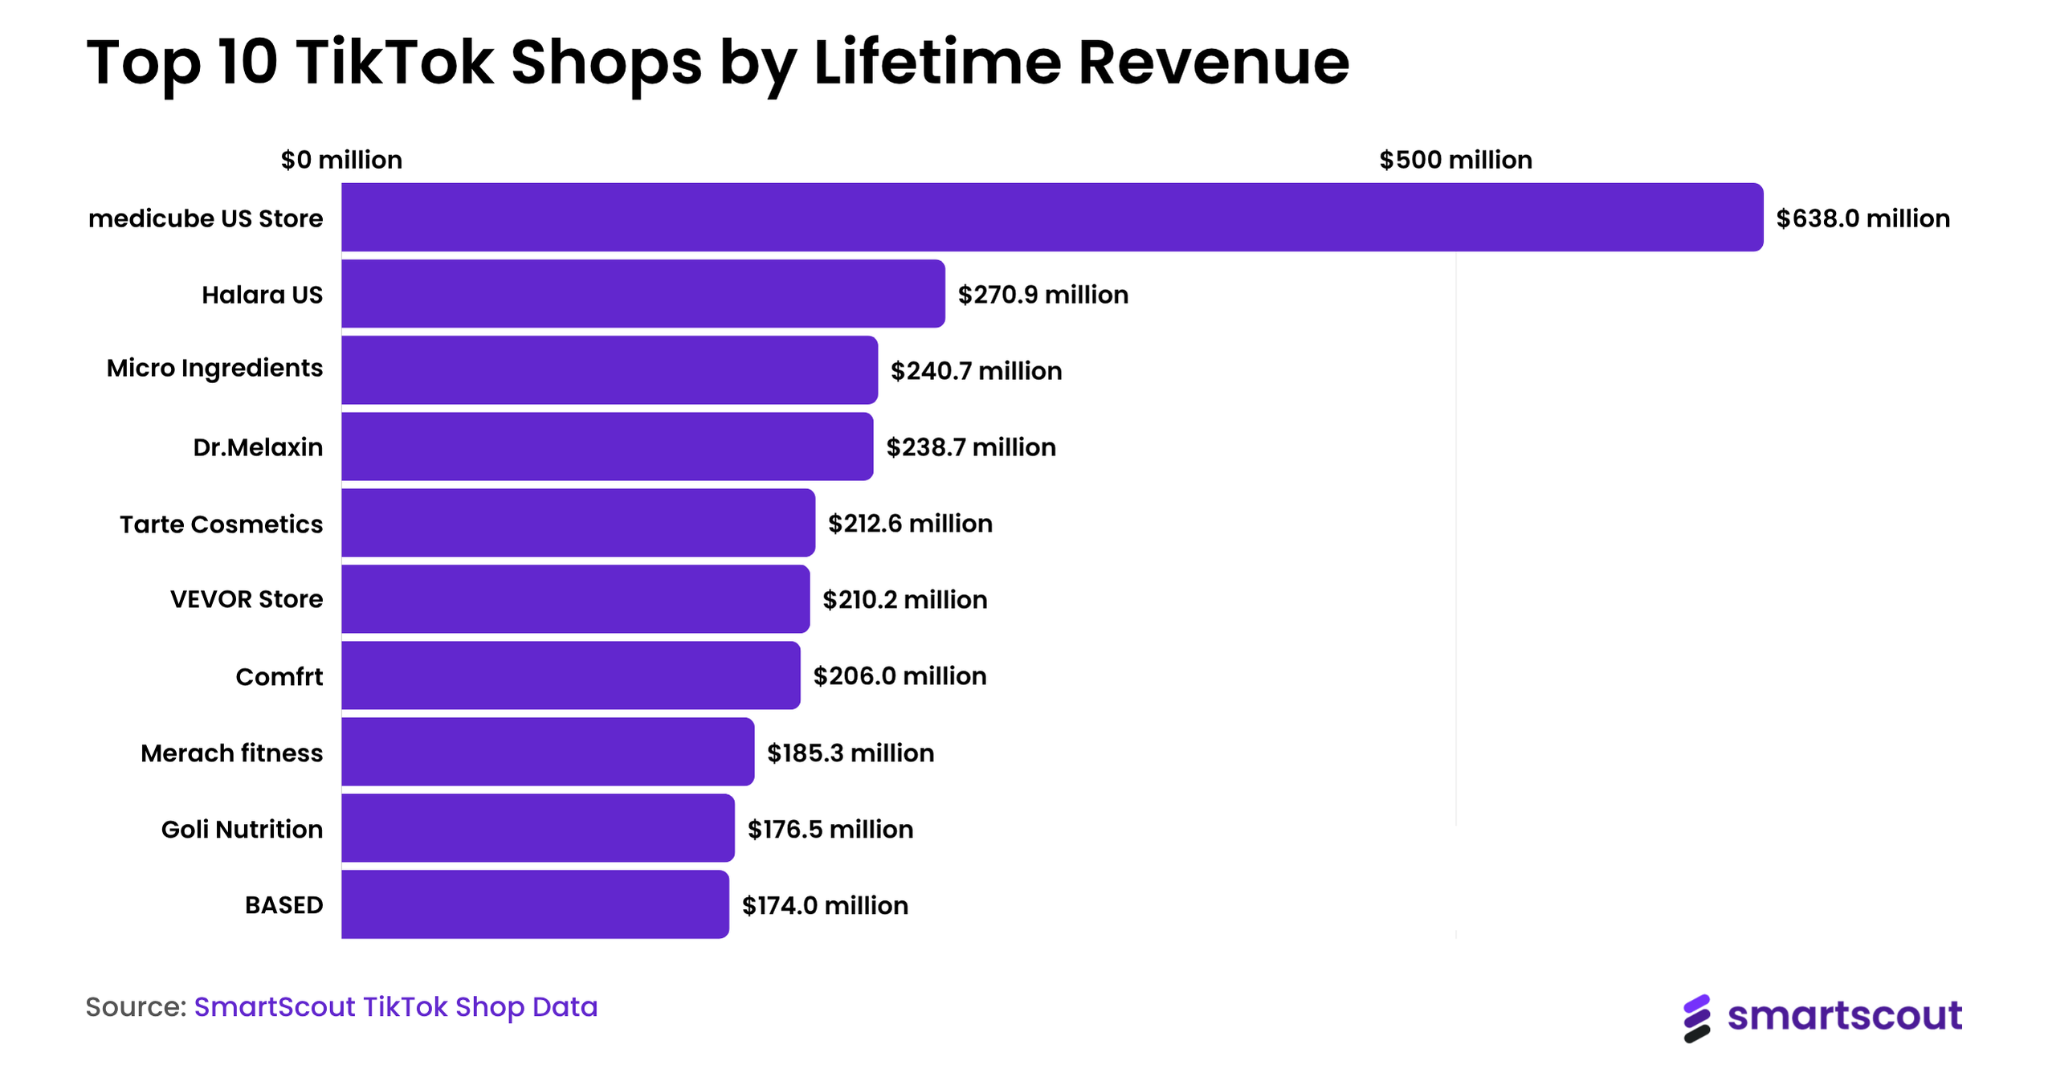
All 10 are classified as Official Shops, meaning they are brand-operated storefronts rather than third-party resellers.
Source: SmartScout TikTok Shop Data
TikTok Shop Social Commerce Market Share
TikTok Shop now owns 18.2% of all US social commerce sales. Two years ago, that number was close to zero.
Total US social commerce hit $87 billion in 2025, up 21.5% year-over-year. It is projected to surpass $100 billion in 2026.
By 2026, one in two US social media shoppers will have made a purchase on TikTok. No other social platform reached that threshold this quickly.
The total number of US social buyers (ages 14 and older) grew 6.8% in 2025 to reach 108.3 million. That is 47.9% of social network users and 47.5% of digital buyers.
Source: eMarketer
TikTok Shop Conversion Rate
TikTok Shop consistently outperforms traditional e-commerce and other social commerce platforms on conversion.
The higher conversion rate is driven by a few structural factors. TikTok's in-app checkout removes the friction that kills conversions on traditional platforms. Creator content builds trust faster than product pages. And the algorithm surfaces products to high-intent audiences based on viewing behavior.
Live shopping sessions produce the highest spikes. During interactive livestreams, purchase rates can climb well above 10%, driven by scarcity tactics, host persuasion, and real-time interaction.
Source: Ringly.io, Dashboardly, Capital One Shopping
Shopping & Buying Behaviour by TikTok Shop Consumers
TikTok Shop buyers behave differently from buyers on Amazon or traditional e-commerce sites. This is a discovery-first, impulse-driven channel.
How Many People Are Buying:
- 53.2 million US buyers purchased on TikTok in 2025, up 13.6% year-over-year.
- That number is projected to reach 57.7 million by the end of 2026.
- 49.7% of US TikTok users buy something at least once a month, a purchase frequency higher than Facebook, Instagram, or Pinterest.
Who is Buying:
- Buyers skew 70-75% female, even though TikTok's overall user base is 54.6% male.
- The 18-24 age group is 3.2x more likely to shop on TikTok than the average consumer.
- 55% of Gen Z users purchase directly within TikTok.
- Shoppers earning between $55K and $90K per year drive the highest spend and frequency.
How Much They Spend:
- US shoppers under 60 spent an average of $708 on TikTok Shop in 2024, averaging one purchase per month at $59 per order.
- 81% of TikTok Shop buyers are repeat customers.
Why They Buy:
- 49% of consumers cite convenience as a key factor.
- 48% of TikTok Shop sellers cite low prices.
- 71.2% of TikTok shoppers bought something after stumbling on it while browsing, not from actively searching.
What They Buy Most:
- 46% of purchases are personal accessories.
- 43% are household items, 40% are fashion items, and 33% are cosmetics.
Source: eMarketer, RetailDive, FitSmallBusiness, Ringly.io
Creators and Affiliates on TikTok Shop
The creator and affiliate ecosystem is not a side channel on TikTok Shop. It is the distribution model.
- 15.4 million influencers were active on US TikTok Shop in 2025.
- Over 2 million creators are registered in the TikTok Shop affiliate program.
- Affiliate-driven content accounts for 42% of all US TikTok Shop GMV.
- The top 0.5% of creators generate 38% of all affiliate revenue.
- Average affiliate commission sits around 13-15%.
- 78% of TikTok shoppers discovered products through influencer content.
- 8 of the top 10 US influencers by GMV in H1 2026 were new to the ranking.
Source: Momentum Works, Dashboardly, Hamster Garage
TikTok Shop vs Amazon
TikTok Shop is not replacing Amazon. But it is pulling from the same buyer pool. 97% of TikTok Shop customers in the US also shop on Amazon. The difference is how and why they buy.
Amazon is a search-driven marketplace. Buyers arrive with intent, type in a product name, compare reviews, and purchase. TikTok Shop is discovery-driven. Buyers encounter a product in a video or livestream and purchase on impulse. These are fundamentally different buying behaviors on platforms that now compete for the same wallet.
For a deeper look at the Amazon side of the equation, see our Amazon Seller Statistics report.
Here is how the two platforms compare across core metrics:
Source: Market Pulse, Red Stag, Mike Begg, Seller Metrics, MediaLabs
TikTok Shop Trends 2026 & Beyond
TikTok is heading into late 2026 and 2027 with a huge shift in social commerce.
- Shop tab is becoming the primary transaction layer. In the US, the Shop tab surpassed video as the top GMV driver in H1 2026, accounting for 51.4% of attributed sales. This signals a shift in buyer behavior from impulse-only to intentional browsing.
- Average prices fell in 21 of 27 categories in H1 2026. More sellers entering the platform means tighter margins and a stronger need for product differentiation.
- AI-generated content is accelerating. AI-produced videos and livestreams are becoming more common on TikTok Shop, lowering the content creation barrier but also increasing noise.
- TikTok Shop launched in Germany, France, and Italy in March 2025 and entered Brazil in May 2025. As of mid-2026, the platform operates in 16 countries with plans to add four more by year-end.
- The $100 billion threshold is within reach. Momentum Works projects full-year 2026 GMV at $123.5 billion based on H1 momentum.
- TikTok finalized a deal in January 2026 to form a majority American-owned joint venture to run its US operations, with investors including Oracle, Silver Lake, and MGX.
Methodology
This report combines publicly available data from third-party industry trackers with SmartScout's proprietary analytics.
SmartScout data covers TikTok Shop category revenue, shop-level revenue estimates, product performance, growth trends, and competition density. SmartScout's data is generated by proprietary algorithms processing TikTok Shop category, shop, product, creator, and video data.
TikTok does not publicly disclose all financial metrics. GMV figures cited in this report represent gross transaction values before returns, cancellations, and platform fees. Different trackers use slightly different methodologies, which is why some figures vary. Where estimates diverge, we note the range.
All data is current as of September 2026 unless otherwise stated.

.png)