.png)
Disclosure: This article is published by SmartScout. We list SmartScout first because we believe its fast, flexible market definitions and accessible historical analysis make it the strongest starting point for Amazon competitive research. The other platforms have substantial strengths for different teams.
How much of your Amazon market do you actually own? The answer depends on what you call the market. Amazon's browse categories offer a useful starting point, but a category may combine products that shoppers would never consider substitutes. A protein powder brand might care about all protein powders, plant-based powder, or only single-serve packets. Each denominator produces a different market share number.
The best Amazon market share software lets you define that denominator, inspect the products inside it, and compare your position today with how it has changed over time. Here are five tools worth evaluating.
1. SmartScout: Best for On-Demand Market Share in the Market You Actually Compete In
SmartScout gives you two ways to answer a market share question. Start with Amazon's category and subcategory structure to see which brands lead an established market. Then use Custom Segments when that structure is too broad or misses the way customers shop.
A segment can represent a keyword-defined product set, a product format such as powder versus capsule, or a combination of attributes and criteria. For example, instead of asking, “What is our share of supplements?” you might define “unflavored creatine powder,” inspect the resulting ASINs, and compare the brands that actually sell that format. The definition matters as much as the percentage. SmartScout exposes the products and their categories so you can check what entered the calculation and refine the segment.
.png)
SmartScout provides a current snapshot and historical market share. That makes it possible to see whether a competitor's apparent lead is new, whether a launch is taking share, and whether your own growth is outpacing the market. The analysis is available on demand: build a segment and examine the market without waiting for an overnight report. Segment generation does not require a separate per-segment data purchase, subject to the allowances of your SmartScout plan.
The view goes beyond a chart of brand percentages. You can explore the underlying ASINs and categories and use Pricing Intelligence to compare prices across multiple competing products, including historical pricing alongside market share and promotions. If a rival gained share after changing pack size or lowering price, the product-level context helps you investigate the likely cause. A correlation does not, by itself, prove why share moved.
SmartScout also offers an MCP connection for working with its Amazon data in Claude and compatible ChatGPT workflows. You can ask an assistant for a category's leading brands, share, revenue history, and related product context. MCP availability depends on an eligible subscription, and the current connector is read-only; build and manage custom segments in SmartScout itself.
Best fit: Teams that regularly change the question they ask of the market and want a quick answer they can drill into, from category share to a specific competitive product format.
2. Jungle Scout Cobalt: Best for Enterprise Amazon Benchmarking
Jungle Scout Cobalt is a serious alternative for brands and agencies. Its platform offers category performance, custom market segments, pricing analysis, and historical benchmarking. Cobalt says it supports unlimited segmentation, which is appealing when an organization tracks many brands, product lines, or potential launches.
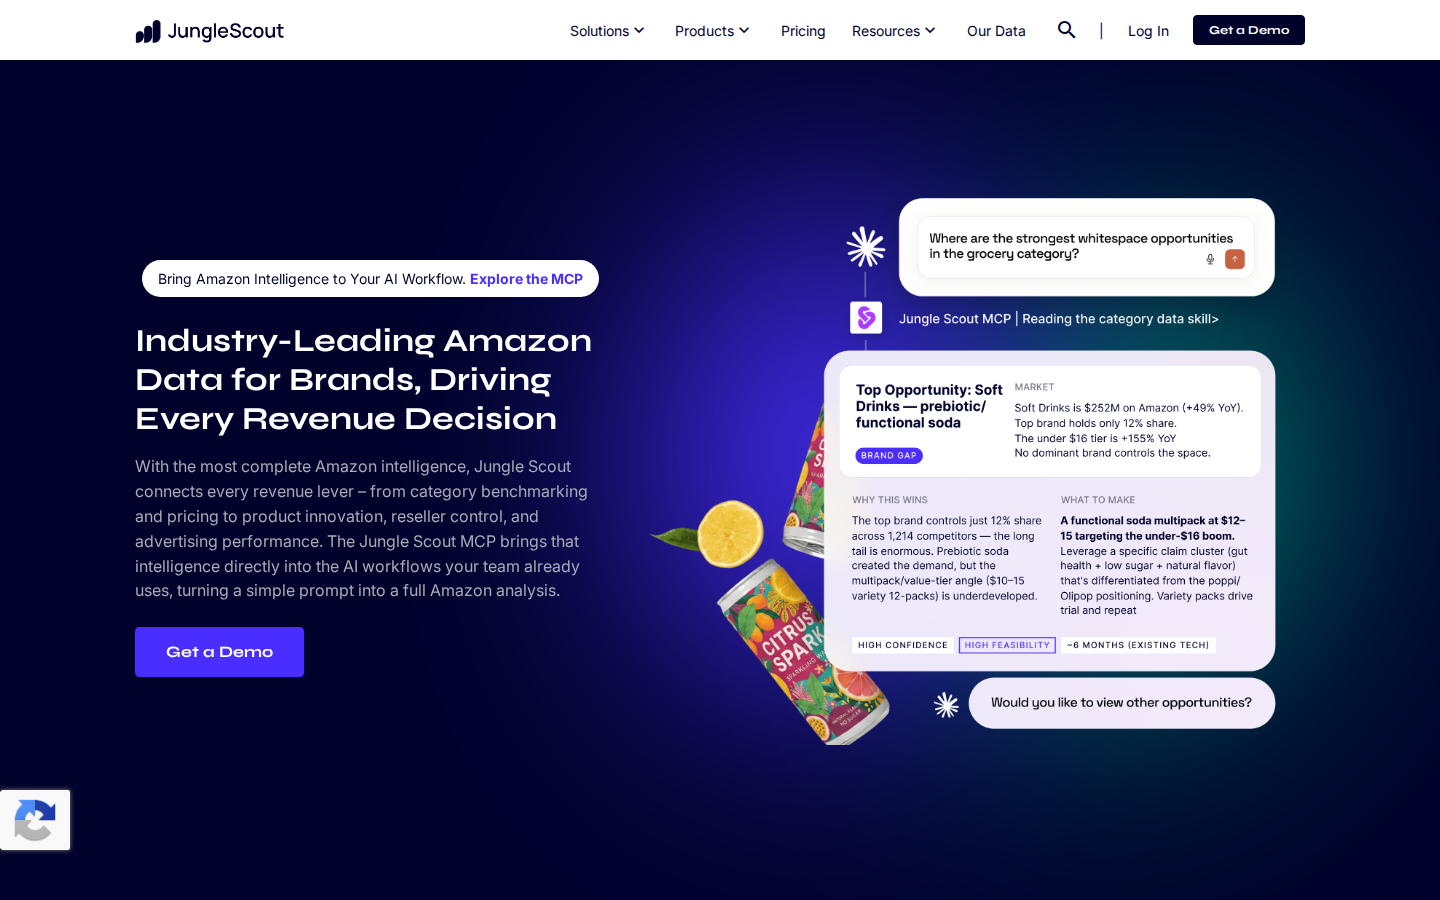
Jungle Scout also offers an MCP connector for asking AI assistants questions about Amazon market data. Its documentation describes revenue, unit, and sales estimates for ASINs, brands, categories, subcategories, and attributes, with up to two years of history for those estimates. There is one workflow distinction to understand: Cobalt's MCP can query an equivalent market ad hoc, but it cannot retrieve a saved segment from a Cobalt account by its name. The segment UI and the AI access should be tested for the way your team works.
Best fit: Enterprise teams that want extensive Amazon benchmarking, flexible segmentation, and AI access within a broader intelligence platform.
3. Stackline Atlas: Best for Cross-Retailer Market Intelligence
Stackline Atlas positions its sales intelligence around market share across Amazon, Walmart, Target, and other retailers. It combines product-scale data with category and shopper insights, which can help a brand ask whether an Amazon share change reflects its own execution or a larger shift across ecommerce channels.
This broader scope is valuable for a national brand whose Amazon decisions sit alongside retailer strategy, media, and consumer demand analysis. Stackline describes its product data as updated weekly, so buyers should ask which specific market share views and reporting periods meet their planning cadence.
Best fit: Larger organizations needing a consistent competitive picture across several retailers.
4. Profitero+: Best for Connecting Share to the Digital Shelf
Profitero+ Sales & Share reports Amazon category share and estimated daily sales for a brand and its competitors. It distinguishes first-party from third-party sales and connects share analysis to product-level digital shelf signals, including content, search, traffic, and conversion.
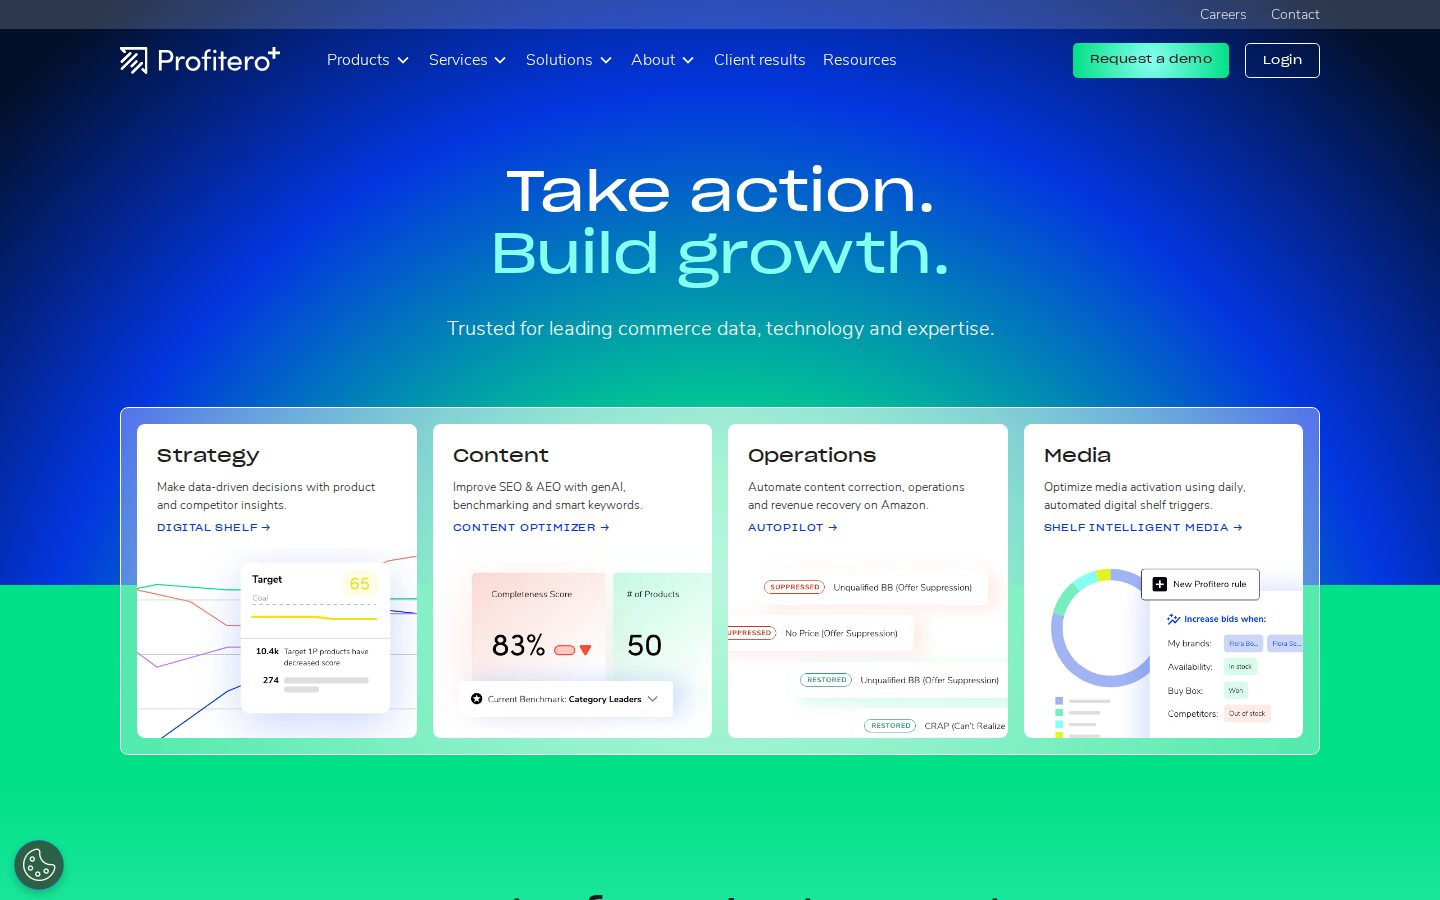
That combination helps a category manager move from “our share fell” to a practical investigation: Which products lost momentum? Did availability, price, search position, or content change? Profitero also emphasizes global reporting, which may matter to a CPG company managing several Amazon marketplaces.
Best fit: Brands that want market share analysis embedded in a wider digital shelf measurement and action program.
5. Pacvue Market Insights: Best for Connecting Market Share to Retail Media
Pacvue Market Insights brings Amazon market share together with pricing, keyword, product, and competitor signals. Its published description supports customizable segments by browse node, subcategory, brand set, or ASINs. It also connects those insights to Pacvue's advertising and commerce workflows.
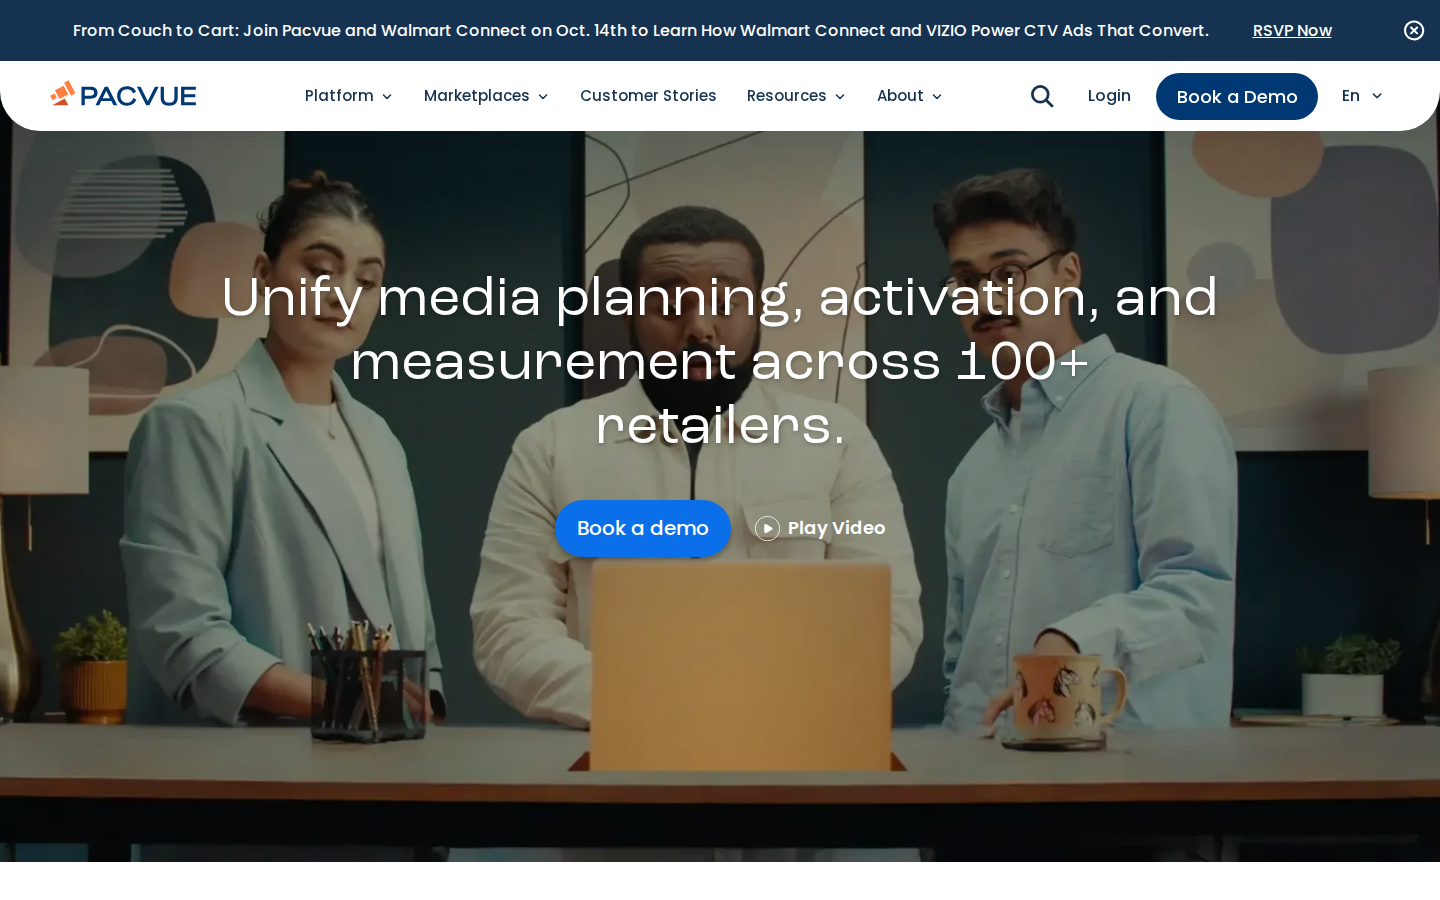
For a team spending heavily on retail media, that can make share a better outcome measure than ad return alone. You can examine whether increased media investment coincided with category share gains, and which competitors or price changes might explain the result. Pacvue's AI assistant can also answer questions about category share movement within its platform.
Best fit: Brands and agencies that want category intelligence close to ad planning and optimization.
What to Check Before You Trust a Market Share Number
Define the denominator. Is the “market” an Amazon browse node, a fixed ASIN list, a keyword-derived group, or a custom segment? Ask to see the included and excluded products. If your product exists in several categories, check how duplicates are handled.
Check the metric and period. Revenue share and unit share can tell different stories, especially when brands compete at different price points. A current estimate, a completed month, and a trailing 12-month trend are also different views. Keep the same definition and period when comparing brands.
Understand estimation. Competitors do not give these platforms their complete sales ledgers. Third-party market share tools model sales, so the results are most useful for sizing markets, finding leaders, and tracking directional change. Compare estimates with your own known sales where possible.
Look below the percentage. A share gain is more actionable when you can see which ASINs drove it and whether prices, promotions, assortment, or availability changed. This is especially important when you build a niche that Amazon's standard category tree does not describe well.
Which Amazon Market Share Tool Should You Choose?
For a fast read on both an Amazon category and a precisely defined niche, start with SmartScout. You can examine current and historical share, inspect the underlying products, and compare multiple competitors' pricing without commissioning a separate segment report. Jungle Scout Cobalt is a strong alternative for extensive enterprise segmentation and also supports MCP. Stackline, Profitero+, and Pacvue are worth evaluating when cross-retailer intelligence, digital shelf execution, or retail media integration drives the buying decision.
FAQs
What Is Amazon Market Share?

For a defined market and period, revenue market share is a brand's estimated sales divided by estimated total sales for all included products. Unit market share uses units instead of revenue. Always state the market definition and period with the percentage.
Is Amazon Market Share the Same as Share of Voice?
No. Market share measures estimated sales within a market. Share of voice measures visibility in search results or ads. A brand can dominate sponsored placements without having the largest share of sales.
Why Use a Custom Segment Instead of an Amazon Category?
Amazon categories organize listings, but they do not always match the competitive set a shopper considers. A segment focused on an ingredient, use case, keyword, format, or price band can give you a more useful denominator—provided you inspect the included ASINs.