
Key Takeaways
- Digital shelf analytics connects search visibility, pricing, availability, content, sellers, and competition to explain changes in Amazon performance.
- Individual metrics rarely tell the whole story; Buy Box, ranking, pricing, and seller changes often influence one another.
- Amazon brands need marketplace context around shelf metrics to understand whether changes are isolated or category-wide.
- Enterprise teams should prioritize tools that connect shelf metrics with the marketplace activity behind them.
- SmartScout connects brands, sellers, products, keywords, subcategories, and ads to support deeper Amazon market analysis.
Digital shelf analytics helps ecommerce teams monitor how products appear and perform across online retail environments. For Amazon brands, the digital shelf includes everything shoppers encounter between search and purchase, from keyword rankings and product detail pages to pricing, reviews, Buy Box ownership, seller activity, and sponsored placements.
That visibility matters because search placement can heavily influence product discovery. NIQ reports that the first three products can capture as much as 80% of clicks on major retailers’ search engines, making it critical for brands to understand not only where products appear, but what may be affecting that position.
For enterprise teams managing large catalogs, those signals are more useful when viewed together. This guide explains how Amazon brands can use digital shelf analytics to connect changes in share, content, price, search visibility, sellers, and competition rather than managing each as a separate reporting stream.
What Is Digital Shelf Analytics?
Digital shelf analytics is the process of tracking and analyzing the signals that determine how products appear, compete, and perform across digital commerce channels. NIQ describes digital shelf analytics as a suite of KPIs used by consumer packaged goods brands to measure and improve digital commerce performance, typically through software that collects and interprets data at scale.
For Amazon teams, the digital shelf extends well beyond the product detail page. It can include:
- Search results: Where products rank organically and through sponsored placements.
- Product content: Titles, images, descriptions, ratings, reviews, and other listing elements shoppers use to evaluate products.
- Price and promotions: Current pricing, discounts, coupons, and competitive price movement.
- Availability: Whether products are in stock and able to appear, convert, and support advertising.
- Buy Box ownership: Which seller controls the primary purchase opportunity at a given time.
- Seller presence: Which Amazon or third-party sellers are carrying a brand and how seller activity changes.
- Market position: How a brand's products perform relative to competitors within relevant subcategories and search results.
That scope distinguishes digital shelf analytics from more narrowly focused reporting. Retail media reporting might tell a team how an ad campaign performed, while marketplace dashboards may show sales or inventory for the brand's own account.
First-party Amazon reporting can tell brands a great deal about their own catalog, shoppers, and advertising performance. Digital shelf and marketplace intelligence adds the external view: how competitors rank, price, advertise, gain share, and sell through the marketplace around you.
The goal is not simply to collect more KPIs. Effective digital shelf analytics software helps teams understand what changed, where it happened, and what deserves investigation.
Why Digital Shelf Analytics Matters for Enterprise Amazon Brands
Tracking a few ASINs manually is manageable. Enterprise brands may need to monitor hundreds or thousands of products across categories, seller relationships, search terms, pricing strategies, and retail media activity, often with different teams responsible for each piece.
NIQ identifies availability as a foundational digital shelf metric because out-of-stock products cannot effectively appear in search or generate sales. More broadly, shelf metrics are interconnected, so a decline in revenue or visibility may originate somewhere else in the customer journey.
Revenue and Conversion Impact
Changes in search placement, availability, pricing, content, or Buy Box ownership can all affect conversion. Digital shelf analytics helps teams trace a performance decline back to the conditions surrounding the product rather than treating revenue as an isolated result.
Competitive Visibility and Market Share Impact
Amazon performance is relative to the wider market. A brand can grow sales while still losing market share if the category is growing faster or competitors are gaining share.
Tracking Amazon market share by category, rankings, pricing, seller coverage, and advertising activity helps brands determine whether the problem sits within their own catalog or reflects a wider competitive shift.
Cross-Team Decision-Making Impact
Digital shelf changes rarely belong to one function. Ecommerce may see declining conversion while retail media sees weaker efficiency, Sales notices reseller pressure, and Supply Chain is managing an availability issue behind all three.
A shared view of marketplace signals helps enterprise teams work from the same diagnosis, prioritize the right response, and avoid optimizing one channel while the underlying issue sits somewhere else.
Which Digital Shelf Analytics Metrics Matter Most?
There is no single digital shelf metric that defines Amazon performance. Enterprise teams need a combination of indicators that assess whether products are available, discoverable, competitive, compelling, and effectively positioned in the market.
The most useful approach is to pair each metric with the business question it helps answer.
The key is to avoid treating any one metric as the diagnosis. Lost share of search may stem from ranking changes, inventory problems, stronger competitor advertising, or weaker conversion. Likewise, Buy Box loss can be due to pricing, fulfillment, or seller issues.
Broader Amazon search trends can also help teams distinguish short-term ranking changes from larger shifts in demand, competition, and category momentum.
Digital Shelf Analytics Software on Amazon
Amazon adds several layers of complexity that generic ecommerce monitoring may not capture well. A single product can have Amazon Retail and third-party sellers competing for sales. One brand may participate across dozens of subcategories.
Paid and organic search results compete for the same shopper attention. Sellers, prices, promotions, search rankings, and category share can all change independently. For enterprise Amazon teams, the real value comes from seeing how those signals affect one another.
Seller Activity and Buy Box Context
Knowing that an ASIN lost the Buy Box only tells part of the story. Amazon teams also need to know which seller gained it, whether pricing changed, how widespread the issue is across the catalog, and whether the same seller is appearing elsewhere.
For enterprise brands, seller analysis should extend beyond identifying who currently owns the Buy Box. Teams may need to understand whether the same seller appears across multiple ASINs, how much of the catalog is affected, whether pricing behavior is spreading, and how Amazon Retail participation changes the picture.
Seller monitoring can therefore reveal more than an isolated reseller. Brands can see whether distribution is shifting across multiple products, sellers, or subcategories.
Keyword and Search Movement
Changes in search performance should also be interpreted competitively. A ranking decline could mean the product itself weakened, but it could also reflect rising competitors, changing shopper demand, or increased sponsored competition.
Search-term visibility becomes more useful when teams can compare the products, brands, and ads competing around the same query.
This makes Amazon keyword research more useful than looking at search volume or rankings alone, because teams can evaluate which brands, products, and ads are competing around the same terms.
Brand, Subcategory, and Advertising Context
The final layer is market structure. SmartScout indexes more than 40,000 Amazon subcategories and allows teams to examine brands, products, market share, sellers, pricing, and growth within them. Teams can then move from a category into the brands and products shaping it instead of evaluating an ASIN without its competitive surroundings.
Competitive ad research can show where brands are investing in sponsored visibility, which search terms they are targeting, and how their presence changes over time. Teams can also track competitor ads on Amazon to identify keyword gaps and shifts in share of voice.
What Buyers Should Look for in Digital Shelf Analytics Software
The right platform depends on the problem the team needs to solve. A brand focused primarily on product content may value different capabilities than one investigating seller networks, category share, pricing pressure, or Amazon competitive intelligence.
When comparing digital shelf analytics platforms, start with the decisions your team actually needs the data to support.
Use this checklist:
- Data scope: Does the platform cover the products, brands, sellers, keywords, and categories your team actually analyzes?
- Amazon depth: Can it account for Amazon-specific dynamics such as sellers, Buy Box changes, subcategories, keywords, and sponsored placements?
- Competitive context: Can you compare performance with competing products and brands rather than monitoring only your own catalog?
- Seller visibility: Can teams identify who is selling a product or brand and see how that seller activity changes?
- Historical analysis: Can you distinguish a temporary fluctuation from a longer-term market shift?
- Reporting and access: Can teams move from portfolio-level trends into underlying products, sellers, keywords, or categories and share those findings with different stakeholders?
- Workflow fit: Does the platform make the next investigation easier, or simply add another dashboard to check?
- Scale: Can the platform support the number of brands, ASINs, categories, sellers, and markets your organization needs to monitor?
For Amazon teams, having more data matters less if the platform cannot connect a change in performance to the sellers, keywords, products, or competitors behind it.
How SmartScout Helps Teams Understand the Full Digital Shelf
Digital shelf monitoring can show that a ranking, price, seller, or share metric changed. Amazon market intelligence helps explain what drove that change.
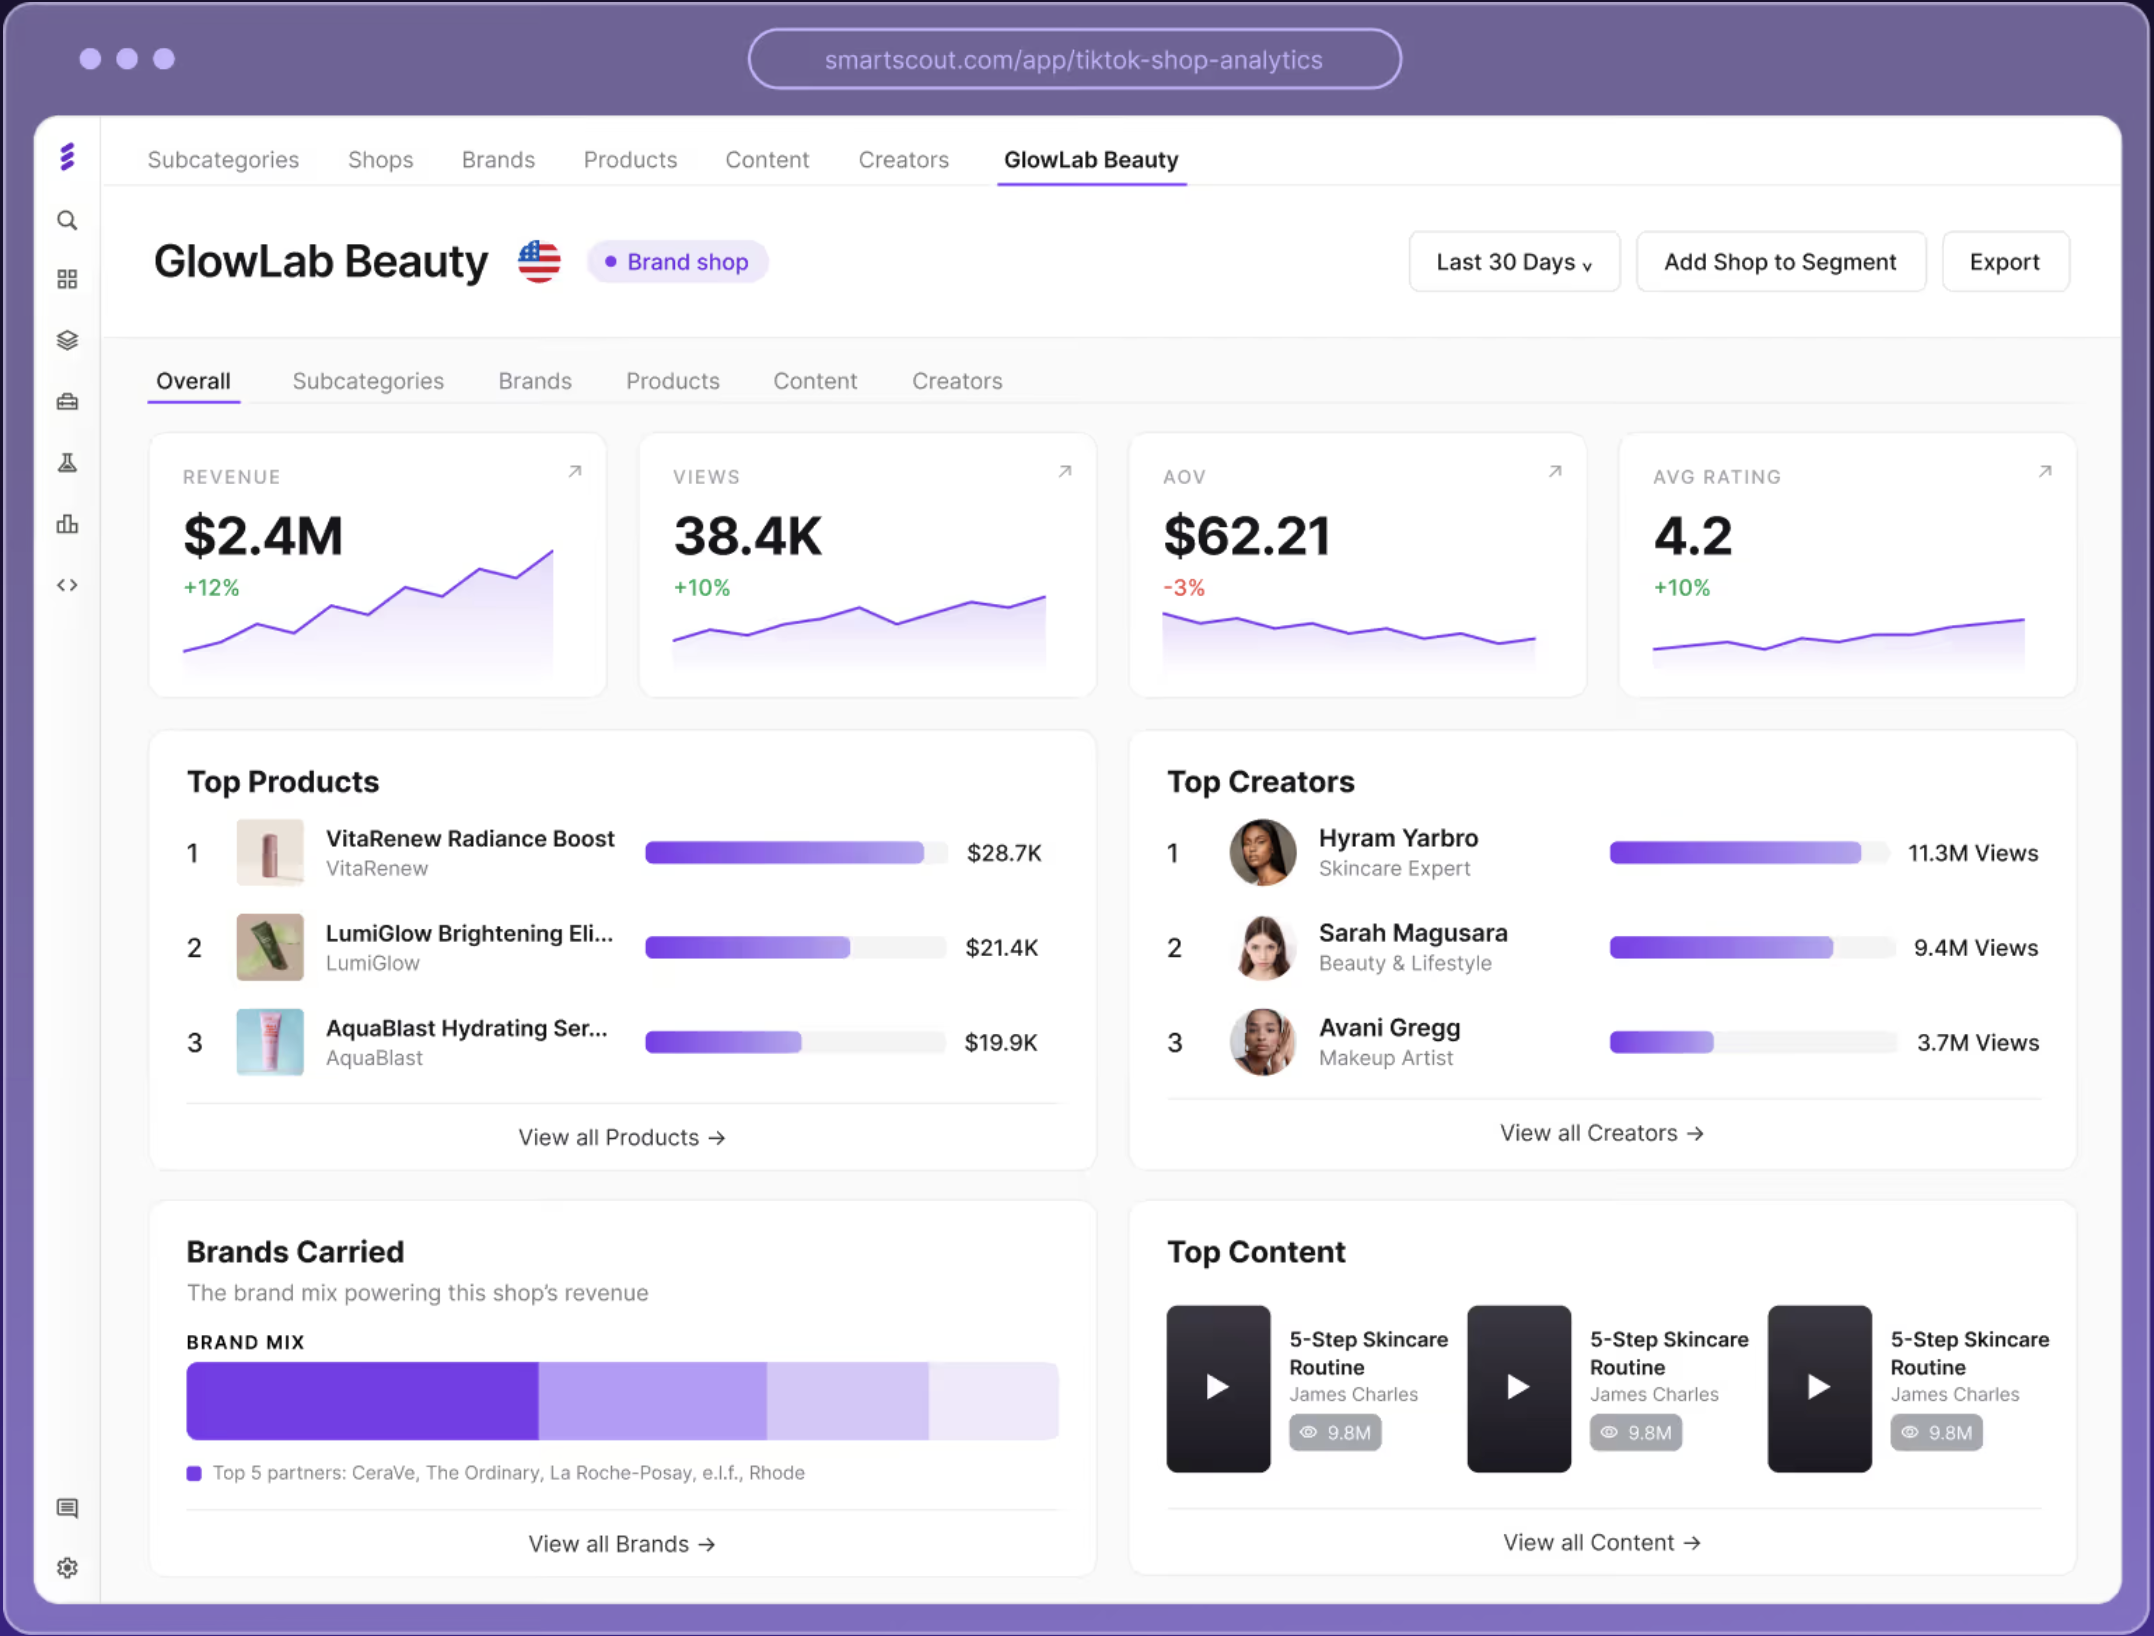
SmartScout is designed for that deeper investigation. Rather than requiring teams to research products independently, SmartScout connects Amazon brands, sellers, products, subcategories, search terms, and advertising activity into a broader marketplace view.
Teams can use that ecosystem to:
- Measure brand position: Compare estimated revenue, market share, competing products, search visibility, and seller presence.
- Map seller activity: See who sells a brand, how sellers overlap across products, and where distribution patterns are changing.
- Analyze subcategories: Compare market size, growth, pricing, competition, and brand share across more than 40,000 Amazon subcategories.
- Research keyword competition: See which products and brands compete for important searches and how rankings change over time.
- Track advertising activity: Identify where competitors are investing in sponsored visibility and which search terms they target.
For larger organizations, the value also comes from scale and continuity. Historical data, seller exports, Share of Voice analysis, and custom dashboards or alerts can help marketplace teams move from one-off research into repeatable competitive monitoring across brands, categories, and portfolios.
Use SmartScout's Amazon brand list software to research brands, sellers, products, and market position in one connected Amazon intelligence platform.
Ready to build a more complete view of your Amazon market? Contact SmartScout to see how enterprise teams can connect brand, seller, category, keyword, and advertising intelligence across their Amazon portfolio.
FAQs
What Does Digital Shelf Analytics Measure?

Digital shelf analytics typically measures availability, price and promotions, product content, ratings and reviews, search visibility, and competitive performance. On Amazon, teams may also monitor Buy Box ownership, seller activity, subcategory share, and sponsored visibility.
How Is Digital Shelf Analytics Different From Retail Media Reporting?
Digital shelf analytics monitors the conditions surrounding a product's visibility and performance, while retail media reporting focuses primarily on advertising activity and results. The two overlap because paid placement affects the digital shelf, and shelf conditions such as availability, price, and content can influence advertising performance.
What Is Share of Search in Digital Shelf Analytics?
Share of search measures how much visibility a brand or product captures across relevant search results compared with competitors. On Amazon, teams can use it alongside keyword rankings, sponsored placements, and category share to understand whether discoverability is improving or declining.
Can Digital Shelf Analytics Help Identify Unauthorized Seller Pressure?
Yes. Seller and Buy Box monitoring can reveal when new sellers begin carrying products, winning the Buy Box, or affecting price consistency. Seller intelligence can then provide additional context around who those sellers are and what other products or brands they carry.
What Should Enterprise Teams Compare When Choosing a Platform?
Compare marketplace coverage, Amazon-specific data, competitive intelligence, seller visibility, historical depth, reporting flexibility, and workflow fit. The strongest option is the one that connects the metrics your team monitors with the context needed to decide what to investigate or change next.

.jpg)