SmartScout is now available as a Model Context Protocol (MCP) connector for Anthropic's Claude. Connect once, and you can ask Claude about any Amazon product, brand, seller, subcategory, or keyword and get back live data from SmartScout's coverage of the Amazon marketplace.
No more switching tabs between Claude and the SmartScout dashboard. No more copy-pasting ASINs into search boxes. If you can describe the question, Claude can fetch the answer.
What you can do
The SmartScout MCP server exposes 20 read-only tools across products, brands, sellers, subcategories, search terms, and ad-spy data. A few examples of what that unlocks:
Keyword analysis. "Run a keyword analysis on Creatine" — Claude returns estimated search volume, CPC, competing brand count, and the sponsored-ad landscape for the term.
Full brand reports. "Give me a full brand report on Sol Brush" — Claude fans out in a single call to pull the brand's revenue history, sales breakdown by subcategory, top 10 products, and competitive set.
Competitive landscape. "What does the competitive landscape look like for pickleball paddles?" — Claude identifies the subcategory, returns total monthly revenue, leading brands by share, the Amazon-vs-third-party revenue split, and average price points.
Organic search rankings. "Show me the organic rankings for this protein powder ASIN" — Claude returns every keyword the product ranks for, its rank position, and the search volume behind each term.
Category trend discovery. "Show me the fastest-growing Amazon categories" or "Which categories have a summer slowdown?" — Claude scans across thousands of subcategories and surfaces growth leaders and seasonality patterns.
These are real questions our customers ask every day. The connector makes them one prompt away.
Getting started
You'll need:
An active SmartScout Buisness or Enterprise subscription.
An active subscription to Claude Desktop, Claude.ai, or Claude Code.
Our server is now compatible with OpenAI, Microsoft, Cursor, and Gemini LLMs.
Connecting in Claude Desktop
Open Settings → Connectors → Add custom connector.
Paste this URL: https://mcp.smartscout.com/
Leave Client ID and Client Secret blank, the server handles registration automatically.
Name the connector "SmartScout".
Click Save. A browser window opens to the SmartScout authorization page.
That's it. The SmartScout tools appear in the tools tray of any new chat, and Claude can call them on your behalf.
Data handling
The SmartScout MCP server is read-only, it cannot modify your SmartScout account, create resources, or write any data. Every request requires your explicit authorization, and your queries are forwarded to the SmartScout API exactly as Claude composes them, with no rewriting or content collection by the server itself.
Questions and support
For help with the SmartScout MCP server, or your account, contact support@smartscout.com.
For technical issues or feature requests specific to the MCP connector, include "MCP" in your subject line so we can route your message to the right team.
Disclosure: This article is published by SmartScout. We list SmartScout first because we believe its fast, flexible market definitions and accessible historical analysis make it the strongest starting point for Amazon competitive research. The other platforms have substantial strengths for different teams.
How much of your Amazon market do you actually own? The answer depends on what you call the market. Amazon's browse categories offer a useful starting point, but a category may combine products that shoppers would never consider substitutes. A protein powder brand might care about all protein powders, plant-based powder, or only single-serve packets. Each denominator produces a different market share number.
The best Amazon market share software lets you define that denominator, inspect the products inside it, and compare your position today with how it has changed over time. Here are five tools worth evaluating.
Tool
Best for
Distinguishing strength
1. SmartScout
Brands and agencies that need fast category or custom market analysis
On-demand snapshot and historical share, inspectable ASINs and categories, competitive pricing, and MCP access
2. Jungle Scout Cobalt
Enterprise Amazon intelligence and custom benchmarking
Unlimited segmentation, historical market data, pricing analysis, and MCP
3. Stackline Atlas
Large brands with cross-retailer sales intelligence needs
Market share and product intelligence across Amazon and other major retailers
4. Profitero+
CPG teams connecting share to digital shelf execution
Retail media teams linking share changes to action
Category and customizable segment analysis integrated with pricing, keywords, and ads
1. SmartScout: Best for On-Demand Market Share in the Market You Actually Compete In
SmartScout gives you two ways to answer a market share question. Start with Amazon's category and subcategory structure to see which brands lead an established market. Then useCustom Segments when that structure is too broad or misses the way customers shop.
A segment can represent a keyword-defined product set, a product format such as powder versus capsule, or a combination of attributes and criteria. For example, instead of asking, “What is our share of supplements?” you might define “unflavored creatine powder,” inspect the resulting ASINs, and compare the brands that actually sell that format. The definition matters as much as the percentage. SmartScout exposes the products and their categories so you can check what entered the calculation and refine the segment.
SmartScout provides a current snapshot and historical market share. That makes it possible to see whether a competitor's apparent lead is new, whether a launch is taking share, and whether your own growth is outpacing the market. The analysis is available on demand: build a segment and examine the market without waiting for an overnight report. Segment generation does not require a separate per-segment data purchase, subject to the allowances of your SmartScout plan.
The view goes beyond a chart of brand percentages. You can explore the underlying ASINs and categories and usePricing Intelligence to compare prices across multiple competing products, including historical pricing alongside market share and promotions. If a rival gained share after changing pack size or lowering price, the product-level context helps you investigate the likely cause. A correlation does not, by itself, prove why share moved.
SmartScout also offers anMCP connection for working with its Amazon data in Claude and compatible ChatGPT workflows. You can ask an assistant for a category's leading brands, share, revenue history, and related product context. MCP availability depends on an eligible subscription, and the current connector is read-only; build and manage custom segments in SmartScout itself.
Best fit: Teams that regularly change the question they ask of the market and want a quick answer they can drill into, from category share to a specific competitive product format.
2. Jungle Scout Cobalt: Best for Enterprise Amazon Benchmarking
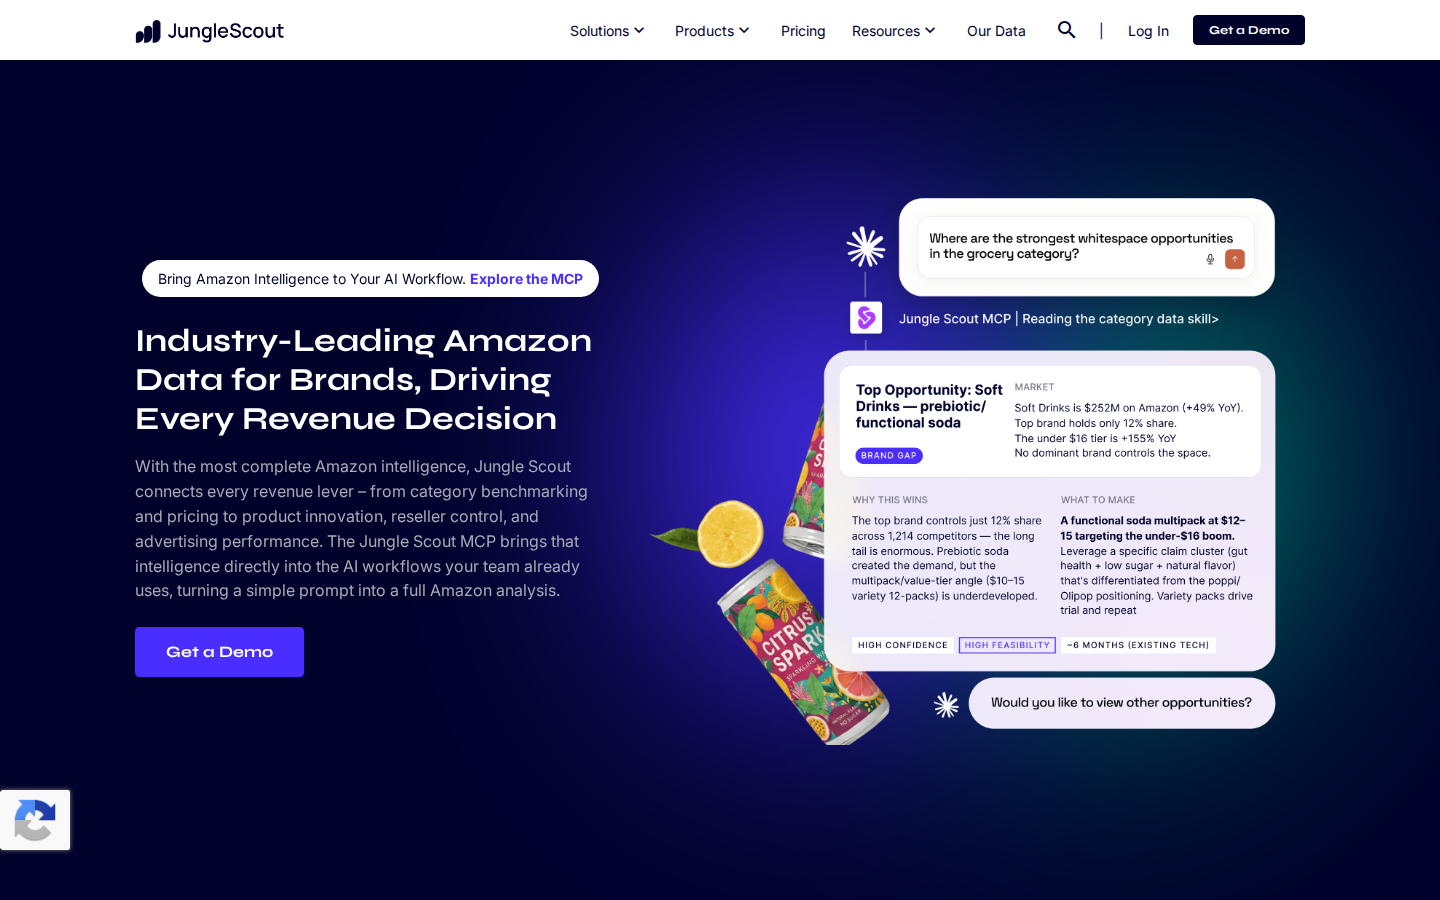
Jungle Scout Cobalt is a serious alternative for brands and agencies. Its platform offers category performance, custom market segments, pricing analysis, and historical benchmarking. Cobalt says it supports unlimited segmentation, which is appealing when an organization tracks many brands, product lines, or potential launches.
Jungle Scout also offers anMCP connector for asking AI assistants questions about Amazon market data. Its documentation describes revenue, unit, and sales estimates for ASINs, brands, categories, subcategories, and attributes, with up to two years of history for those estimates. There is one workflow distinction to understand: Cobalt's MCP can query an equivalent market ad hoc, but it cannot retrieve a saved segment from a Cobalt account by its name. The segment UI and the AI access should be tested for the way your team works.
Best fit: Enterprise teams that want extensive Amazon benchmarking, flexible segmentation, and AI access within a broader intelligence platform.
3. Stackline Atlas: Best for Cross-Retailer Market Intelligence
Stackline Atlas positions its sales intelligence around market share across Amazon, Walmart, Target, and other retailers. It combines product-scale data with category and shopper insights, which can help a brand ask whether an Amazon share change reflects its own execution or a larger shift across ecommerce channels.
This broader scope is valuable for a national brand whose Amazon decisions sit alongside retailer strategy, media, and consumer demand analysis. Stackline describes its product data as updated weekly, so buyers should ask which specific market share views and reporting periods meet their planning cadence.
Best fit: Larger organizations needing a consistent competitive picture across several retailers.
4. Profitero+: Best for Connecting Share to the Digital Shelf
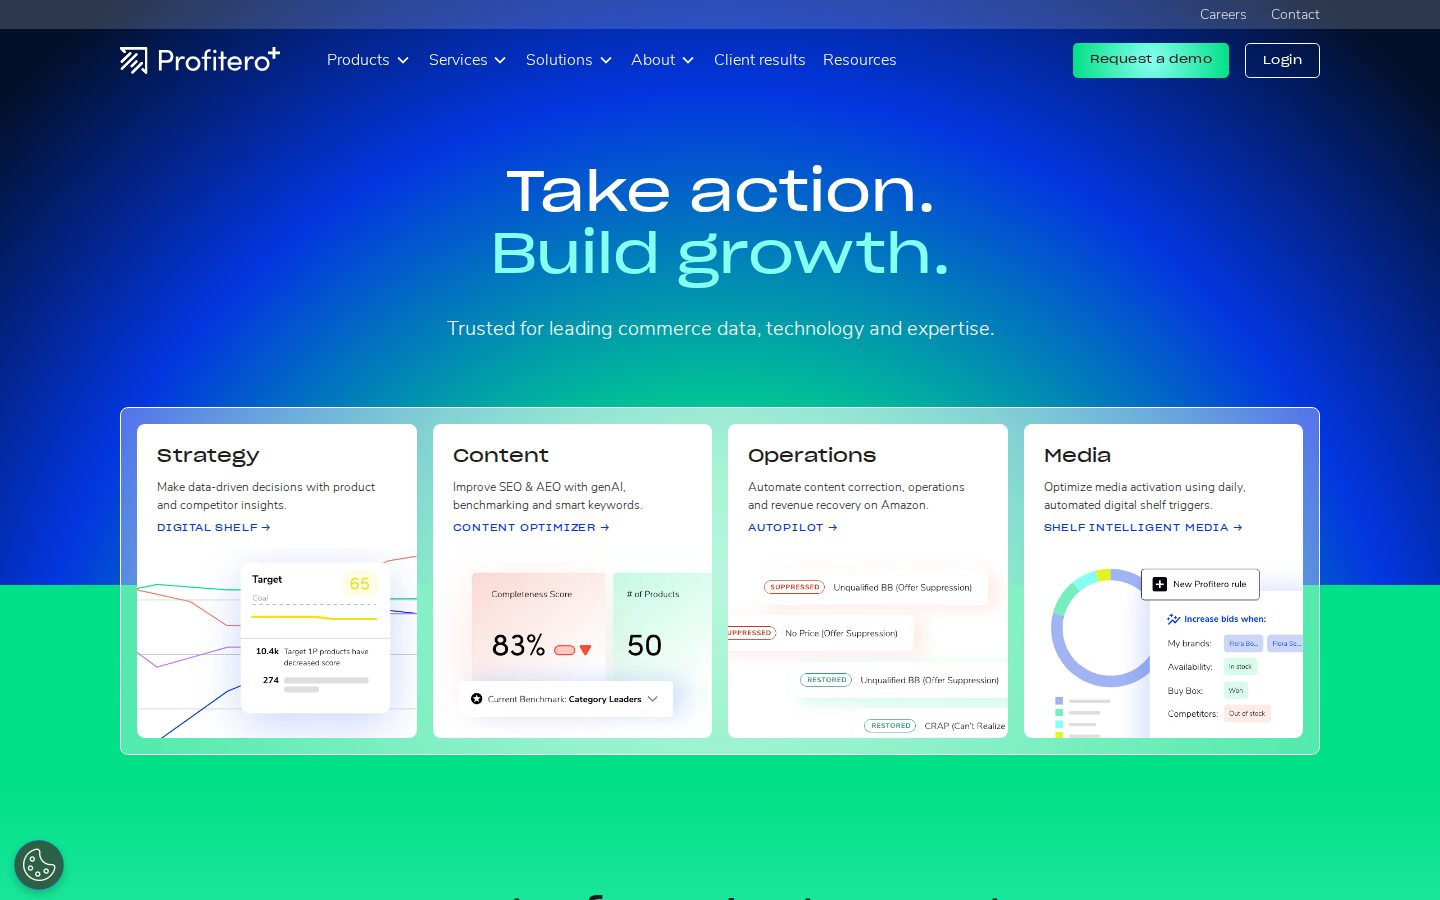
Profitero+ Sales & Share reports Amazon category share and estimated daily sales for a brand and its competitors. It distinguishes first-party from third-party sales and connects share analysis to product-level digital shelf signals, including content, search, traffic, and conversion.
That combination helps a category manager move from “our share fell” to a practical investigation: Which products lost momentum? Did availability, price, search position, or content change? Profitero also emphasizes global reporting, which may matter to a CPG company managing several Amazon marketplaces.
Best fit: Brands that want market share analysis embedded in a wider digital shelf measurement and action program.
5. Pacvue Market Insights: Best for Connecting Market Share to Retail Media
Pacvue Market Insights brings Amazon market share together with pricing, keyword, product, and competitor signals. Its published description supports customizable segments by browse node, subcategory, brand set, or ASINs. It also connects those insights to Pacvue's advertising and commerce workflows.
For a team spending heavily on retail media, that can make share a better outcome measure than ad return alone. You can examine whether increased media investment coincided with category share gains, and which competitors or price changes might explain the result. Pacvue's AI assistant can also answer questions about category share movement within its platform.
Best fit: Brands and agencies that want category intelligence close to ad planning and optimization.
What to Check Before You Trust a Market Share Number
Define the denominator. Is the “market” an Amazon browse node, a fixed ASIN list, a keyword-derived group, or a custom segment? Ask to see the included and excluded products. If your product exists in several categories, check how duplicates are handled.
Check the metric and period. Revenue share and unit share can tell different stories, especially when brands compete at different price points. A current estimate, a completed month, and a trailing 12-month trend are also different views. Keep the same definition and period when comparing brands.
Understand estimation. Competitors do not give these platforms their complete sales ledgers. Third-party market share tools model sales, so the results are most useful for sizing markets, finding leaders, and tracking directional change. Compare estimates with your own known sales where possible.
Look below the percentage. A share gain is more actionable when you can see which ASINs drove it and whether prices, promotions, assortment, or availability changed. This is especially important when you build a niche that Amazon's standard category tree does not describe well.
Which Amazon Market Share Tool Should You Choose?
For a fast read on both an Amazon category and a precisely defined niche, start withSmartScout. You can examine current and historical share, inspect the underlying products, and compare multiple competitors' pricing without commissioning a separate segment report. Jungle Scout Cobalt is a strong alternative for extensive enterprise segmentation and also supports MCP. Stackline, Profitero+, and Pacvue are worth evaluating when cross-retailer intelligence, digital shelf execution, or retail media integration drives the buying decision.
FAQs
5 Best Amazon Market Share Tools for Brands and Agencies
TikTok Shop crossed $50 billion in global GMV in just the first half of 2026. That puts it on track to surpass $100 billion for the full year, making it the fastest e-commerce platform to ever reach that milestone.
What started as a social commerce experiment inside a video app is now a top-tier global retail channel, one that added more GMV in 18 months than most marketplaces generate in a decade.
At SmartScout, we track TikTok Shop data at the category, shop, and product level. For this report, we combined publicly available data from industry trackers with our own proprietary data on category revenue, shop performance, and market structure.
Here is everything you need to know about TikTok Shop in 2026, backed by numbers.
Key TikTok Shop Statistics 2026
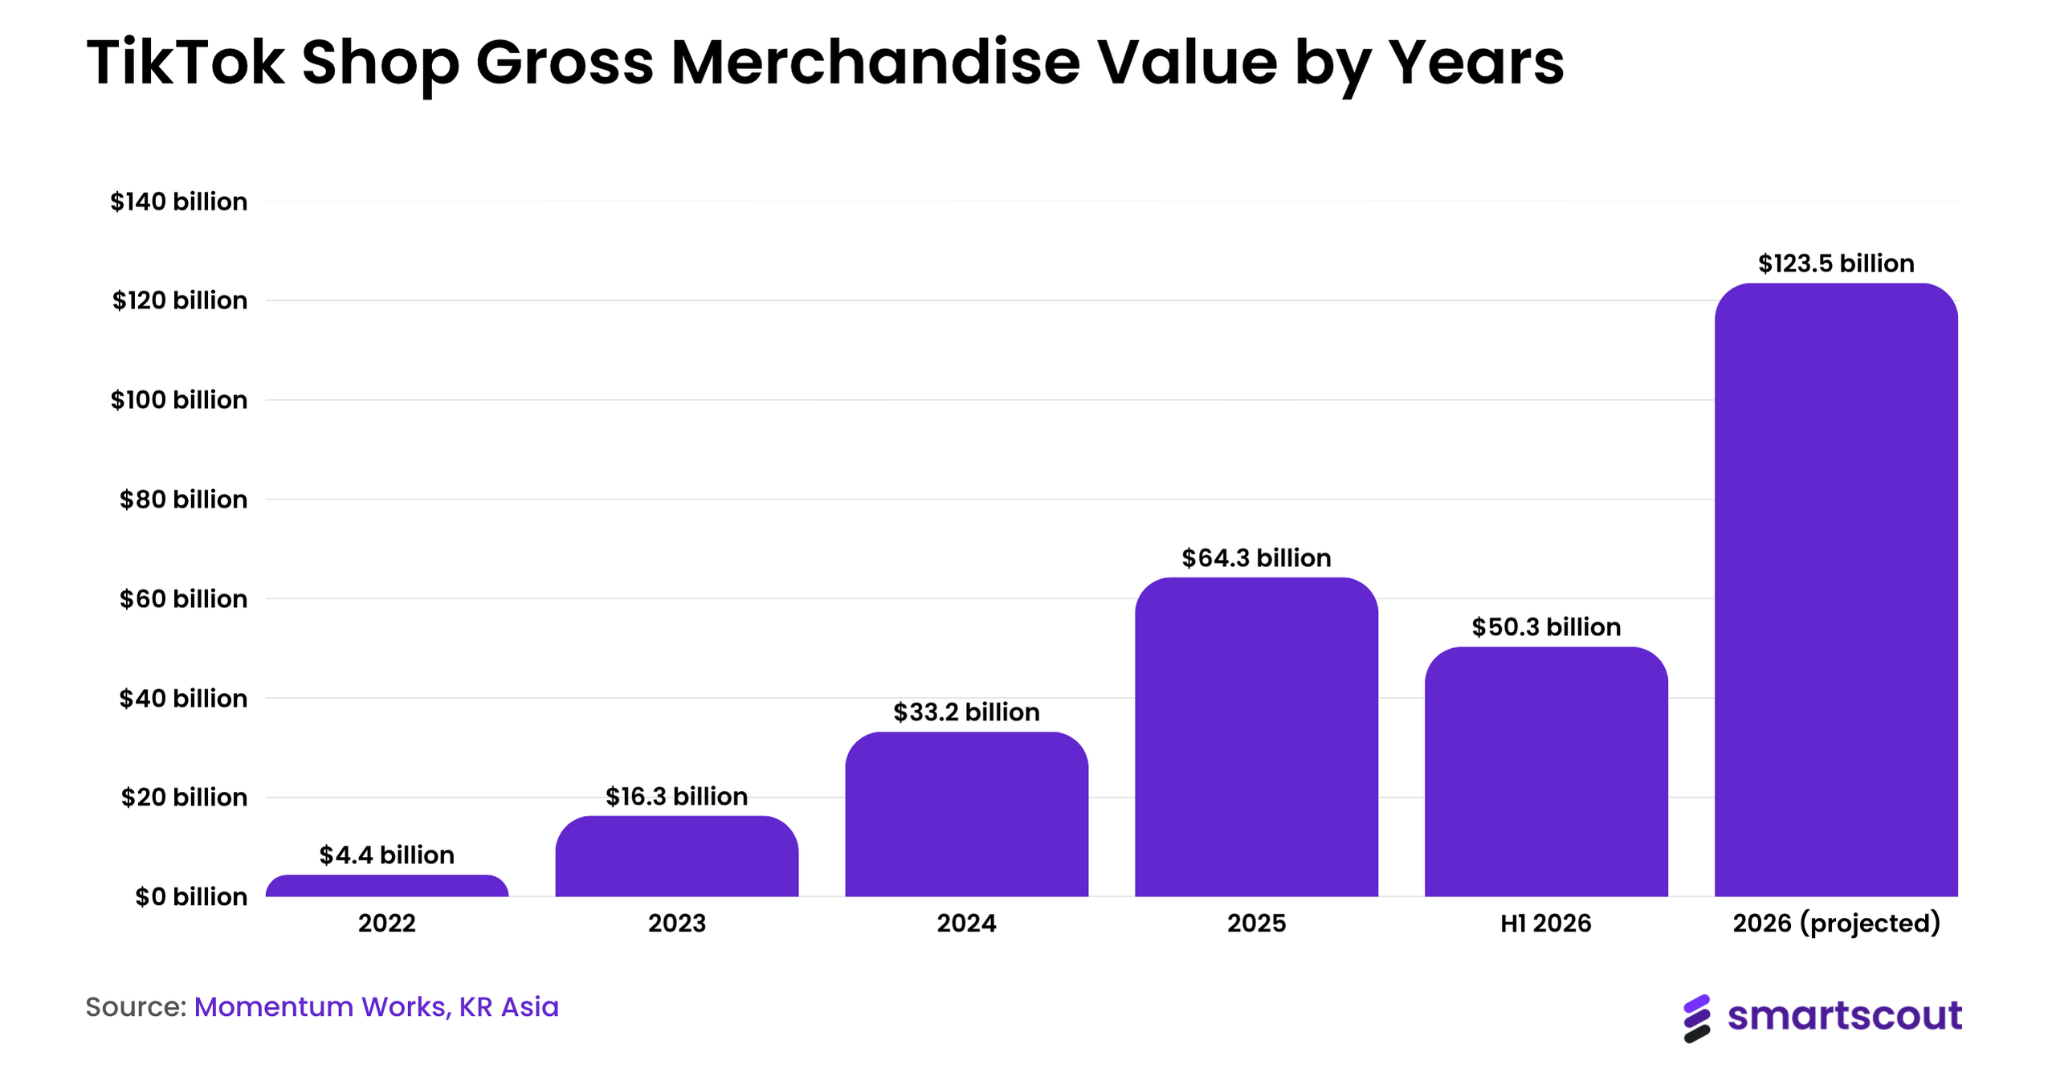
TikTok Shop's global GMV reached $50.3 billion in H1 2026, up 92% year-over-year.
The platform is projected to reach $123.5 billion in global GMV for full-year 2026.
US GMV hit $11.8 billion in H1 2026, growing 103% year-over-year.
There are over 15 million sellers on TikTok Shop globally.
The US has 803,500 registered stores, though more than half recorded no sales.
More than 5,700 US stores crossed $1 million in GMV in H1 2026, an 8x increase year-over-year.
Beauty & Personal Care is the largest category, generating over $9.7 billion in lifetime revenue.
TikTok Shop captured 18.2% of all US social commerce sales in 2025.
53.2 million US buyers purchased on TikTok in 2025, projected to reach 57.7 million in 2026.
Affiliate-driven content accounts for 42% of total US TikTok Shop GMV.
Shop tab now drives 51.4% of attributed GMV in the US, overtaking video and live.
97% of TikTok Shop customers in the US also shop on Amazon.
How Many TikTok Shops Are There?
TikTok Shop hosts more than 15 million sellers globally as of 2026. The platform operates in 16 countries as of mid-2026, with four more expected by year-end.
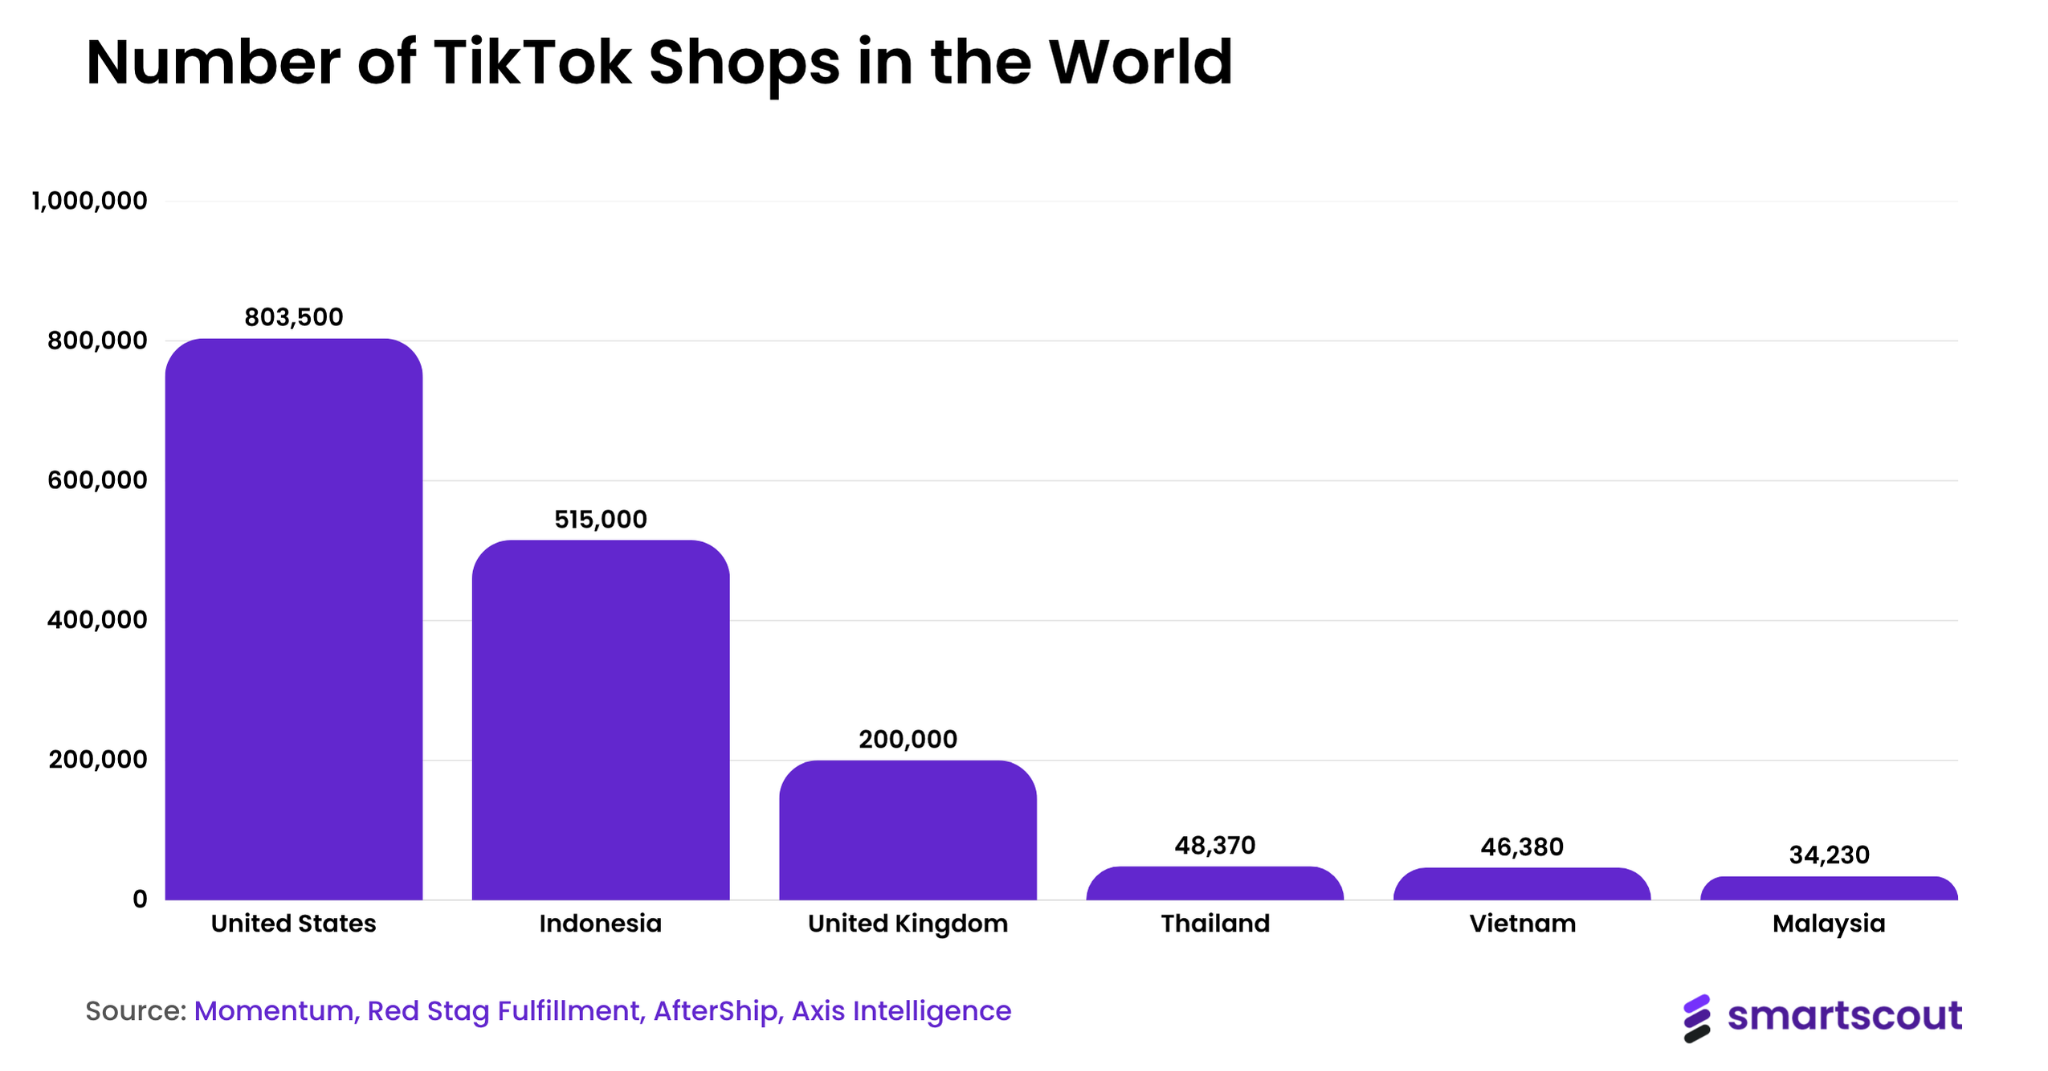
The US market saw the most dramatic expansion. Shop count grew from 4,450 in mid-2023 to 803,500 by the end of 2025. In the same period, US GMV went from near zero to $15.1 billion.
Country
Number of Shops
United States
803,500
Indonesia
515,000
United Kingdom
200,000
Thailand
48,370
Vietnam
46,380
Malaysia
34,230
Southeast Asia still dominates total shop count. Indonesia alone has more registered shops than the entire US market, driven by TikTok's integration with Tokopedia and the region's deeply established social commerce behavior.
New markets launched in 2025 include Germany, France, Italy, and Brazil. Brazil launched in May 2025 and grew its monthly GMV from $1 million to $25.7 million within three months, reaching $46.1 million by August 2025.
TikTok Shop generated $64.3 billion in global GMV in 2025, nearly doubling its 2024 performance. In just the first half of 2026, that number already crossed $50.3 billion.
Here is how TikTok Shop's GMV has grown since launch:
Note: GMV figures represent gross transaction values before returns and cancellations. TikTok does not publicly report net revenue from Shop, so all figures are estimates from third-party trackers.
TikTok Shop in the United States
TikTok Shop launched in the US in September 2023. It reached $9 billion in GMV within 16 months.
US GMV reached $15.1 billion in 2025, a 68% increase from $9 billion in 2024. In H1 2026 alone, the US hit $11.8 billion, growing 103% year-over-year. TikTok Shop captured 18.2% of all US social commerce sales in 2025.
A major structural shift happened in the US during H1 2026. The Shop tab (TikTok's in-app marketplace) now accounts for 51.4% of attributed GMV, up from 36% in 2025. Video dropped to 40.4%, and Live narrowed to just 8.2%.
The 2025 BFCM four-day shopping period generated over $500 million in sales in the US, with shoppers up 50% year-over-year.
TikTok recorded 3.8 billion visits in August 2026, making it the 5th most-visited social media website in the world. Since the platform registers this much traffic, selling on this platform makes it much easier.
Monthly Visits
TikTok Shop (seller.tiktok) had 3 million visitors in August, with a decline of 26.37% from July 2026. An average person stays on the website for 1 minute 43 seconds and visits 1.45 pages on average.
Traffic Share by Country
The United States drives the most traffic among all the countries, with 29.78% of the total traffic. Vietnam and Indonesia come in second and third place in terms of traffic.
Country
Share of Traffic
United States
29.78%
Vietnam
12.02%
Indonesia
9.99%
Brazil
8.04%
Mexico
5.84%
Rest of the World
34.33%
(Data as of September 2026)
Age Distribution
People aged between 25 and 34 years account for the most traffic on TikTok Shop, with 32.66% of the traffic.
Age Group
Traffic
18-24
16.48%
25-34
32.66%
35-44
21.6%
45-54
15.7%
55-64
8.77%
65+
4.77%
Gender Share
Male shoppers on TikTok Shop slightly dominate the platform by accounting for 50.94% of the audience. Female shoppers are also very close, at 49.06%.
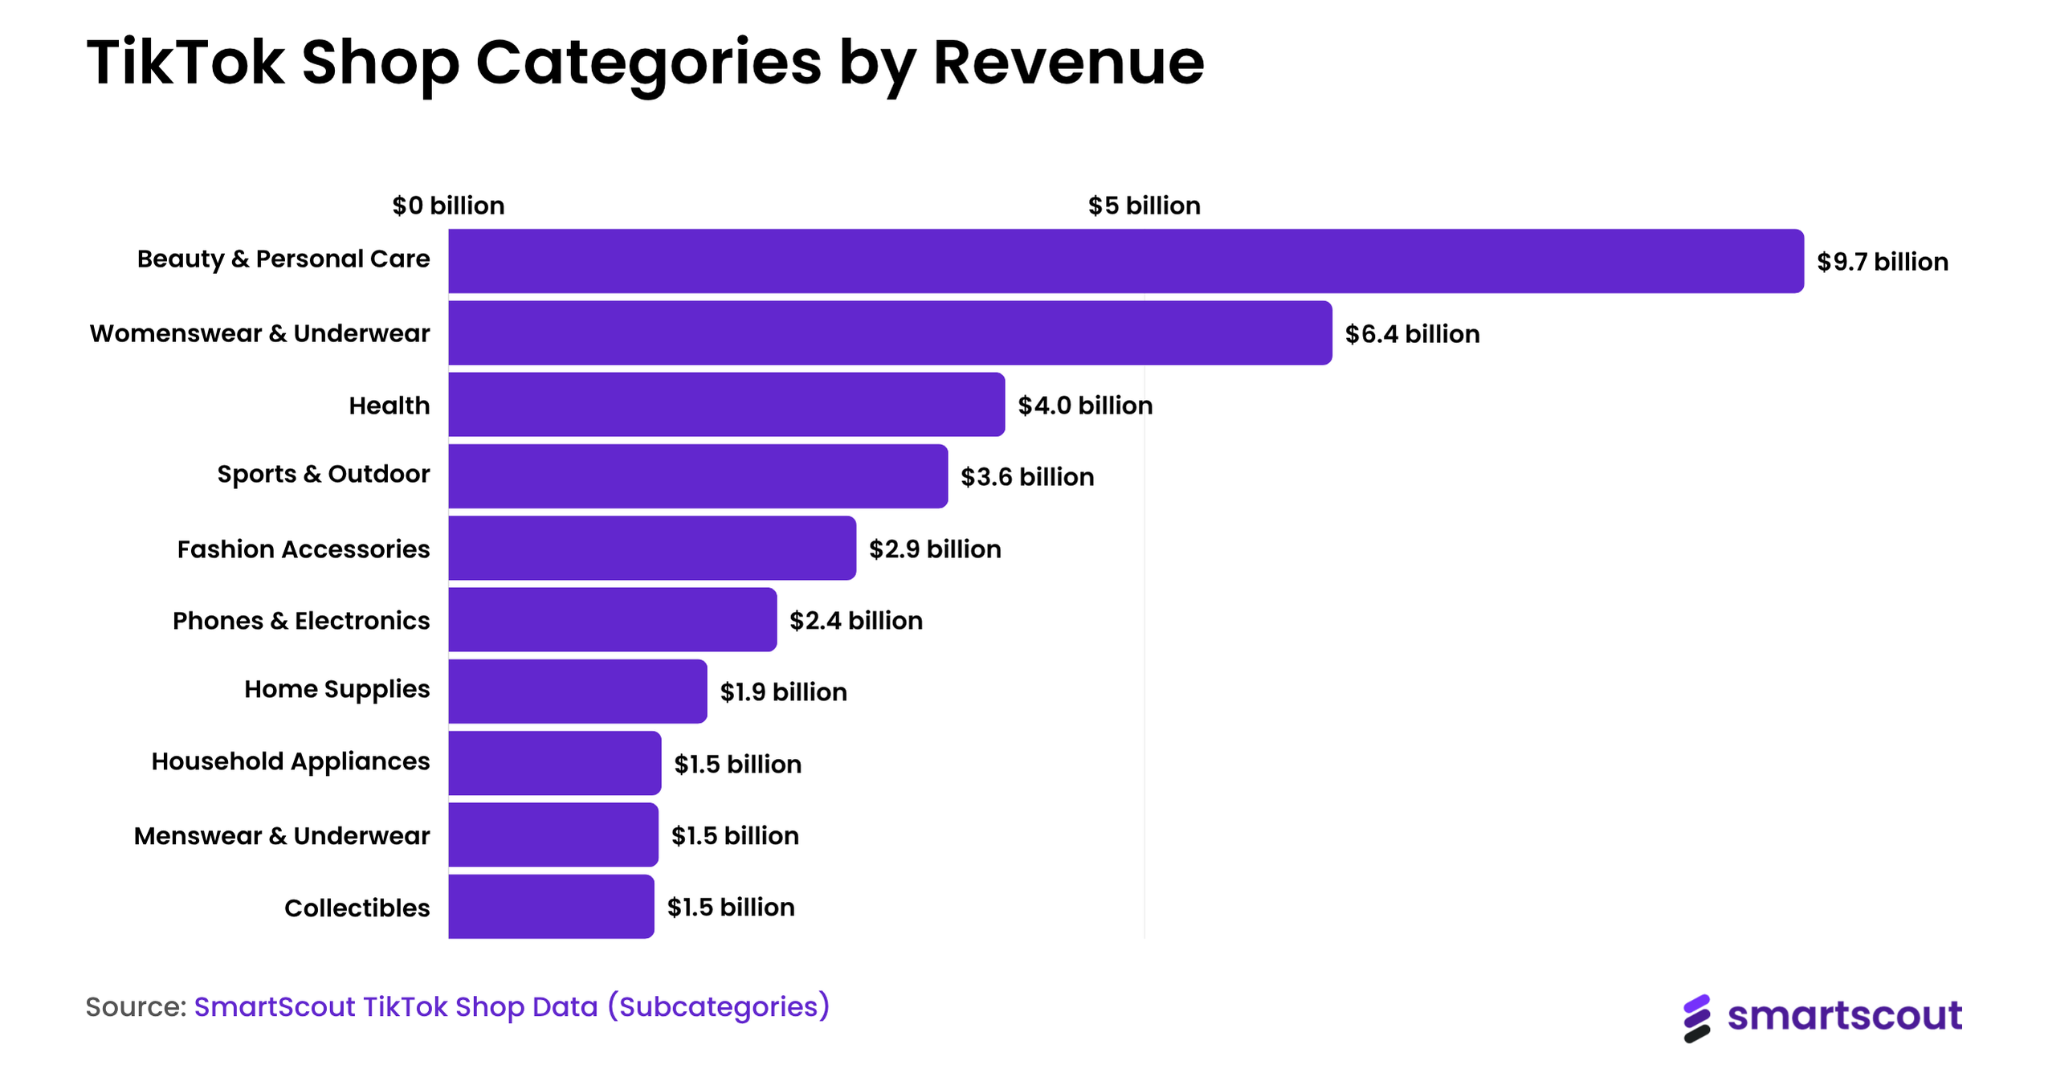
Beauty & Personal Care dominates TikTok Shop by a wide margin. It has generated over $9.7 billion in lifetime revenue, nearly $3.4 billion more than the second-place category. Monthly revenue alone tops $515 million, more than the next two categories combined.
Womenswear & Underwear holds second place with $6.3 billion in lifetime revenue and nearly $378 million per month. Together, the top two categories account for more than 40% of all tracked category revenue on the platform.
Here are the top 10 TikTok Shop categories ranked by lifetime revenue:
Rank
Category
Lifetime Revenue
Monthly Revenue
1
Beauty & Personal Care
$9.74 billion
$515.1 million
2
Womenswear & Underwear
$6.35 billion
$377.5 million
3
Health
$4.00 billion
$148.7 million
4
Sports & Outdoor
$3.59 billion
$202.1 million
5
Fashion Accessories
$2.93 billion
$147.1 million
6
Phones & Electronics
$2.36 billion
$114.1 million
7
Home Supplies
$1.86 billion
$113.0 million
8
Household Appliances
$1.53 billion
$72.6 million
9
Menswear & Underwear
$1.51 billion
$103.2 million
10
Collectibles
$1.48 billion
$78.8 million
Source: SmartScout TikTok Shop Data (Subcategories)
Top 10 TikTok Shops in the US
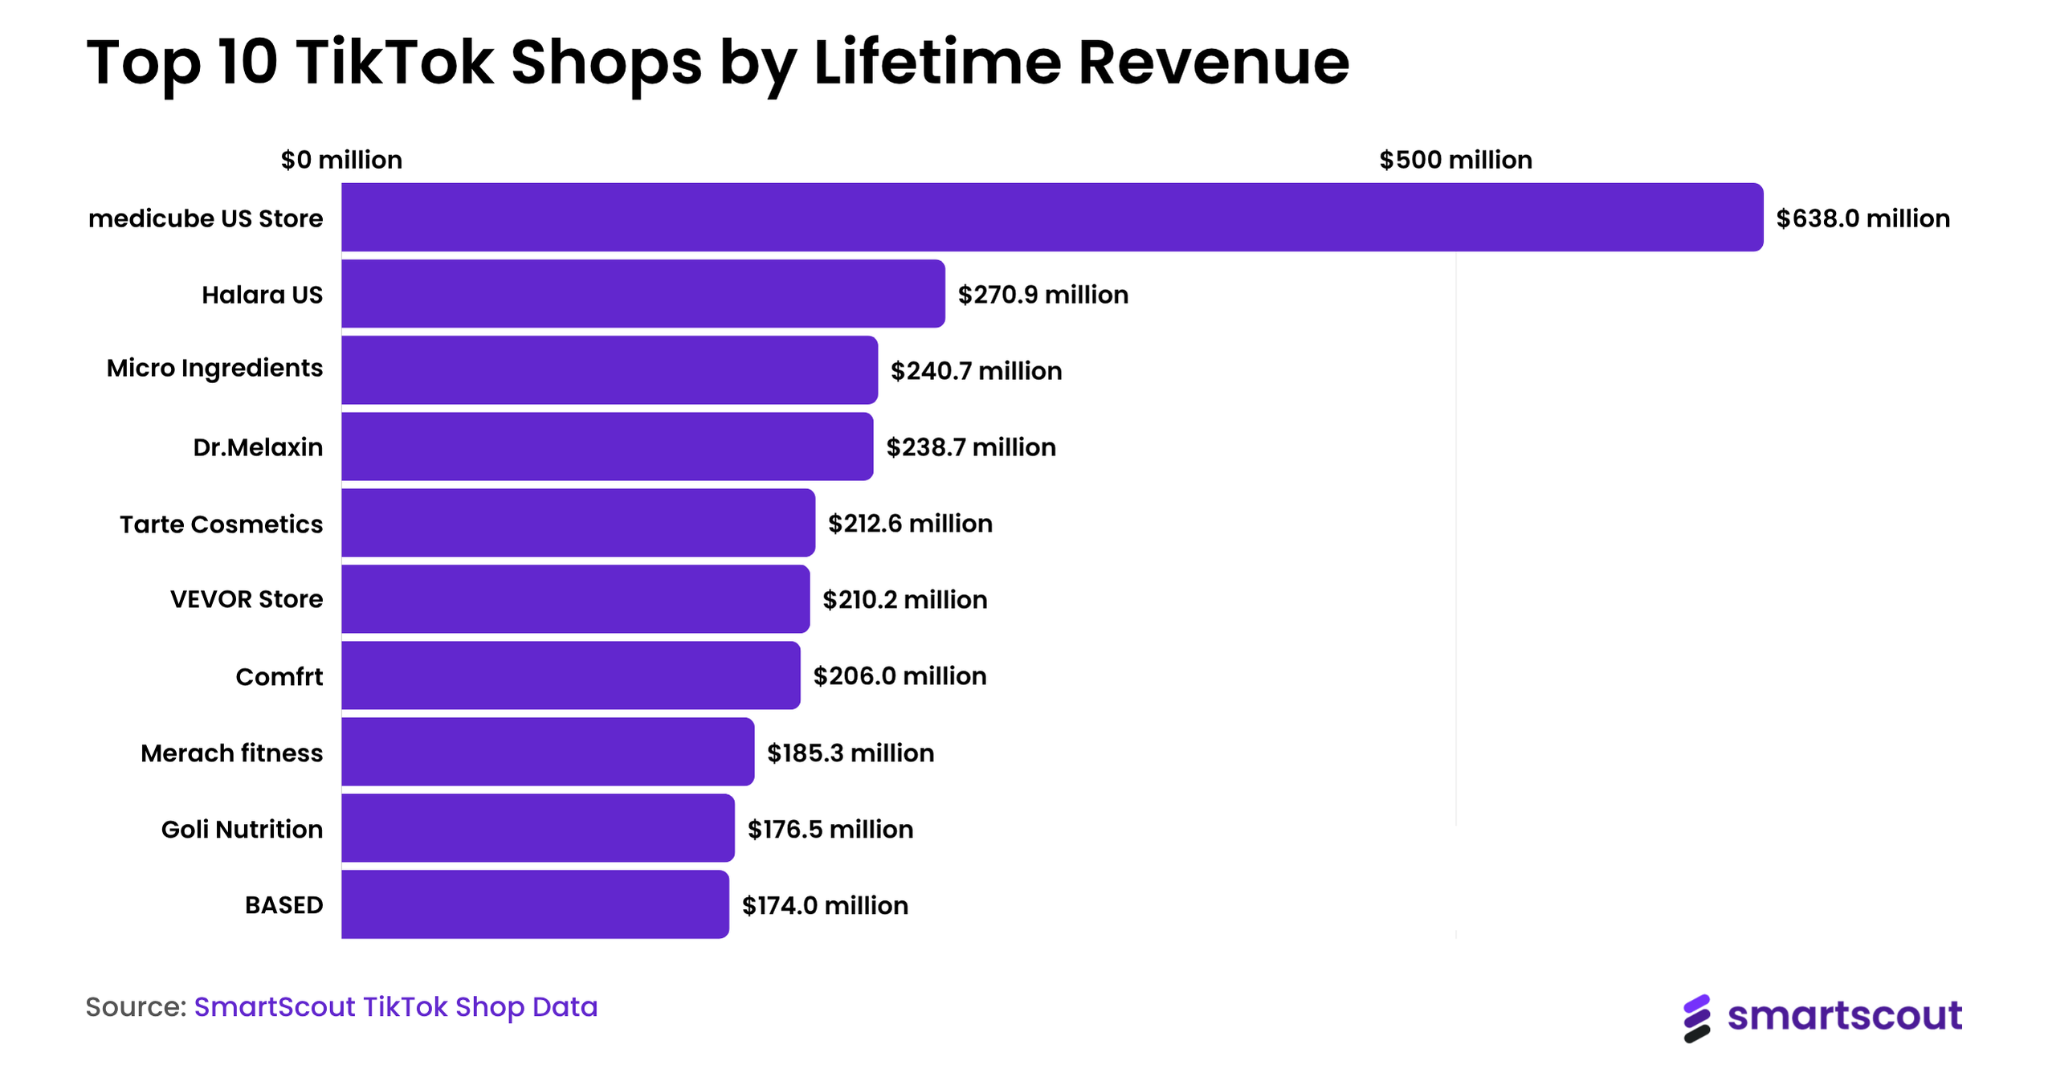
medicube US Store is the highest-earning shop on TikTok, pulling in $39.6 million in monthly revenue and $638 million in lifetime revenue. It sells skin care kits and has built a dominant position through consistent creator-driven content and aggressive product launches.
Nine of the top 10 shops are based in the US. The only exception is Halara US, which is registered in China but sells primarily to US consumers.
All 10 are classified as Official Shops, meaning they are brand-operated storefronts rather than third-party resellers.
Rank
Shop Name
Primary Sub Category
Lifetime Revenue
Monthly Revenue
1
medicube US Store
Skin Care Kits
$638.0 million
$39.6 million
2
Dr.Melaxin
Skin Care Kits
$238.7 million
$22.4 million
3
Comfrt
Women's Hoodies
$206.0 million
$13.5 million
4
BASED
Mousse & Gel
$174.0 million
$11.9 million
5
Tarte Cosmetics
Lipstick & Lip Gloss
$212.6 million
$11.4 million
6
VEVOR Store
Storage Boxes
$210.2 million
$9.5 million
7
Halara US
Women's Sports Leggings
$270.9 million
$8.9 million
8
Micro Ingredients
Vitamins Supplements
$240.7 million
$6.6 million
9
Merach fitness
Vibration Trainers
$185.3 million
$5.7 million
10
Goli Nutrition
Vitamins Supplements
$176.5 million
$2.1 million
Source: SmartScout TikTok Shop Data
TikTok Shop Social Commerce Market Share
TikTok Shop now owns 18.2% of all US social commerce sales. Two years ago, that number was close to zero.
Total US social commerce hit $87 billion in 2025, up 21.5% year-over-year. It is projected to surpass $100 billion in 2026.
Year
US Social Commerce (Total)
TikTok Shop's Share
2025
$87 billion
18.2%
2026 (projected)
$100 billion+
22%
2027 (projected)
$110 billion+
24.1%
By 2026, one in two US social media shoppers will have made a purchase on TikTok. No other social platform reached that threshold this quickly.
The total number of US social buyers (ages 14 and older) grew 6.8% in 2025 to reach 108.3 million. That is 47.9% of social network users and 47.5% of digital buyers.
TikTok Shop consistently outperforms traditional e-commerce and other social commerce platforms on conversion.
Platform / Channel
Average Conversion Rate
Instagram Shopping
1.9-2.1%
Traditional E-commerce (Shopify average)
2.0-3.0%
TikTok Shop (overall)
3.2-4.7%
TikTok Shop (in-app checkout)
5-8%
TikTok Shop (Live sessions)
5-12%
The higher conversion rate is driven by a few structural factors. TikTok's in-app checkout removes the friction that kills conversions on traditional platforms. Creator content builds trust faster than product pages. And the algorithm surfaces products to high-intent audiences based on viewing behavior.
Live shopping sessions produce the highest spikes. During interactive livestreams, purchase rates can climb well above 10%, driven by scarcity tactics, host persuasion, and real-time interaction.
TikTok Shop is not replacing Amazon. But it is pulling from the same buyer pool. 97% of TikTok Shop customers in the US also shop on Amazon. The difference is how and why they buy.
Amazon is a search-driven marketplace. Buyers arrive with intent, type in a product name, compare reviews, and purchase. TikTok Shop is discovery-driven. Buyers encounter a product in a video or livestream and purchase on impulse. These are fundamentally different buying behaviors on platforms that now compete for the same wallet.
TikTok is heading into late 2026 and 2027 with a huge shift in social commerce.
Shop tab is becoming the primary transaction layer. In the US, the Shop tab surpassed video as the top GMV driver in H1 2026, accounting for 51.4% of attributed sales. This signals a shift in buyer behavior from impulse-only to intentional browsing.
Average prices fell in 21 of 27 categories in H1 2026. More sellers entering the platform means tighter margins and a stronger need for product differentiation.
AI-generated content is accelerating. AI-produced videos and livestreams are becoming more common on TikTok Shop, lowering the content creation barrier but also increasing noise.
TikTok Shop launched in Germany, France, and Italy in March 2025 and entered Brazil in May 2025. As of mid-2026, the platform operates in 16 countries with plans to add four more by year-end.
The $100 billion threshold is within reach. Momentum Works projects full-year 2026 GMV at $123.5 billion based on H1 momentum.
TikTok finalized a deal in January 2026 to form a majority American-owned joint venture to run its US operations, with investors including Oracle, Silver Lake, and MGX.
Methodology
This report combines publicly available data from third-party industry trackers with SmartScout's proprietary analytics.
SmartScout data covers TikTok Shop category revenue, shop-level revenue estimates, product performance, growth trends, and competition density. SmartScout's data is generated by proprietary algorithms processing TikTok Shop category, shop, product, creator, and video data.
TikTok does not publicly disclose all financial metrics. GMV figures cited in this report represent gross transaction values before returns, cancellations, and platform fees. Different trackers use slightly different methodologies, which is why some figures vary. Where estimates diverge, we note the range.
All data is current as of September 2026 unless otherwise stated.
Published by SmartScout. We place our own product first because we believe its broad keyword history and placement-level advertising intelligence make it a strong choice for competitive research. The other tools have real strengths, which we describe below.
Search results are the storefront most Amazon shoppers see first. If a rival brand takes more of the visible positions for your most important keywords, it can win attention before a shopper ever reaches your listing. Amazon share of voice (SOV) helps you measure that competition over time.
The catch is that “share of voice” does not have one universal formula. A tool might count appearances, weight positions by likely clicks, measure ad impressions, or aggregate a chosen set of keywords. Before comparing two percentages, check the keywords, placements, time period, and weighting behind each one.
Organic vs. Sponsored Share of Voice
Organic SOV measures how much visibility your products or brand earn in non-ad search results. A higher organic ranking for an important query may improve it, but rank alone is not the whole story: several ASINs from one brand can appear on the same page, and the first result tends to matter more than a result far below it.
Sponsored SOV measures visibility in paid placements. Sponsored Products, Sponsored Brands, and Sponsored Brands video can put a brand in different parts of the results page. The prominent first Sponsored Products slot deserves particular attention. Winning that position can be more valuable than merely appearing somewhere among the sponsored results.
There is also a useful distinction between visibility share and spend share. An observed ad position or modeled share of clicks is not an advertiser's actual bill. Competitive ad spend requires estimates of search volume, click-through rate (CTR), cost per click (CPC), and how often a brand wins each placement. Treat a competitor spend number as directional intelligence, not access to its Amazon Ads account.
Tool
Best fit
What stands out
1. SmartScout
Brands and agencies researching competitors across a broad keyword universe
Historical SOV, ad-format win rates, top Sponsored Products position, and modeled competitor spend
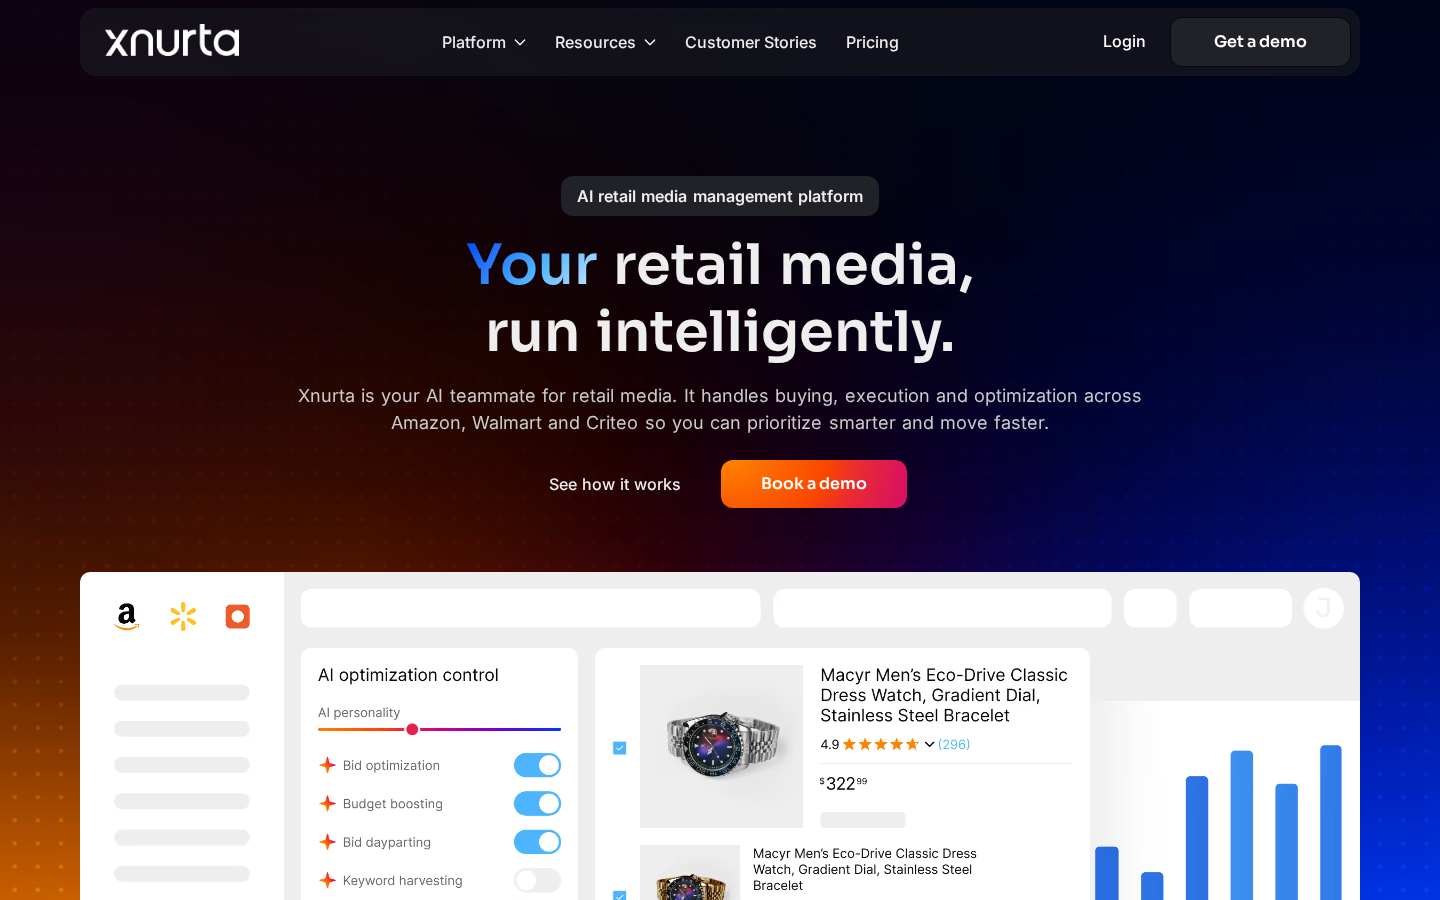
2. Xnurta
Advertising teams that want brand and product SOV alongside campaign management
Organic and sponsored search coverage, including Sponsored Brands video, across the top three search pages
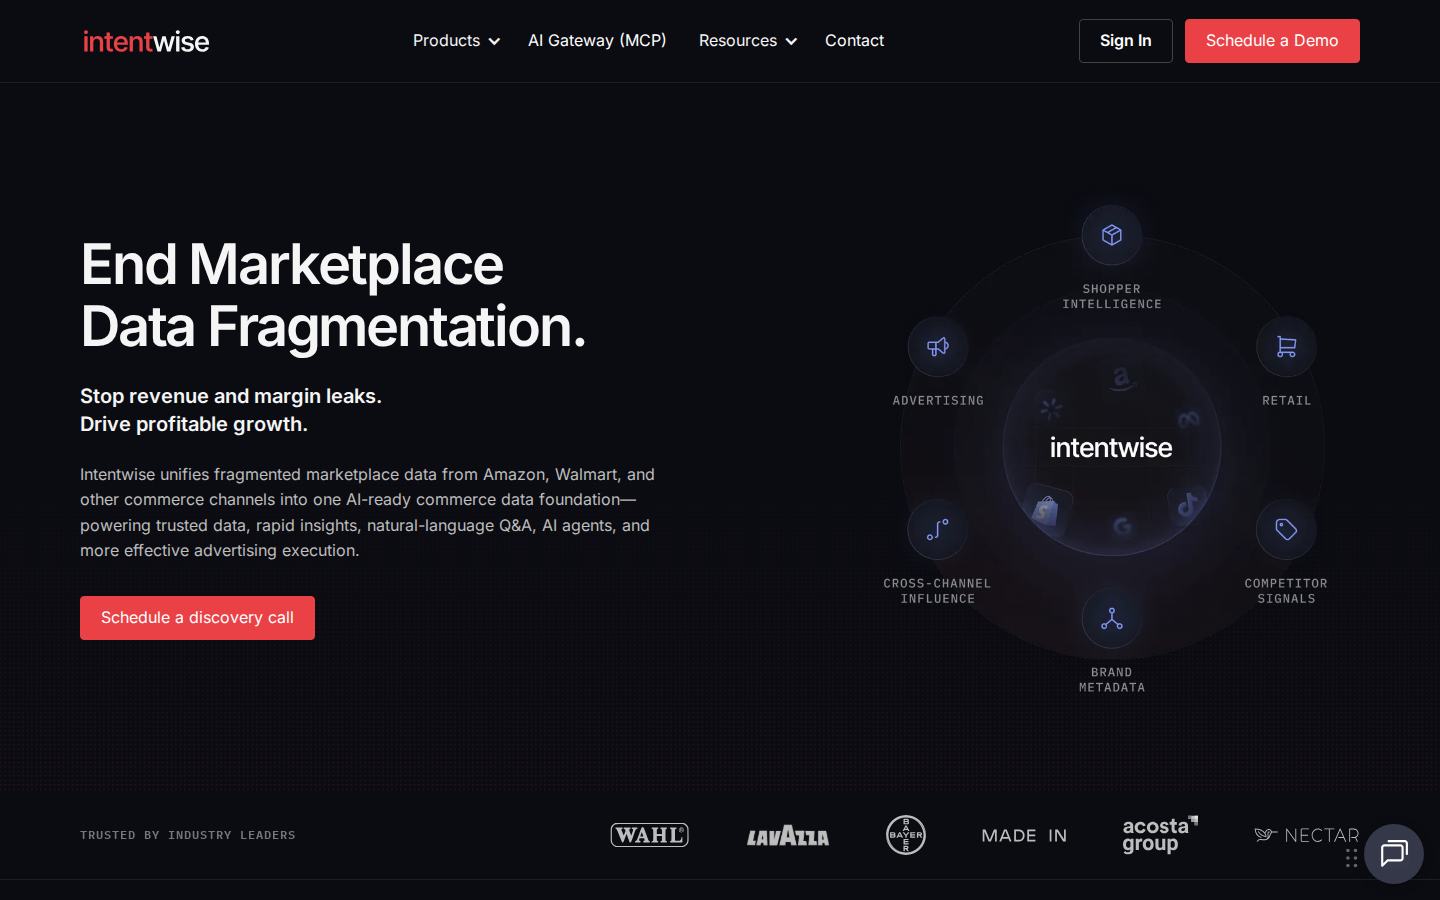
3. Intentwise
Teams monitoring a defined keyword set and linking visibility to advertising analysis
Separate organic, ad, and total SOV with multiple daily search captures
4. Pacvue
Enterprise brands managing retail media across retailers
Organic and paid SOV connected to category intelligence and campaign workflows
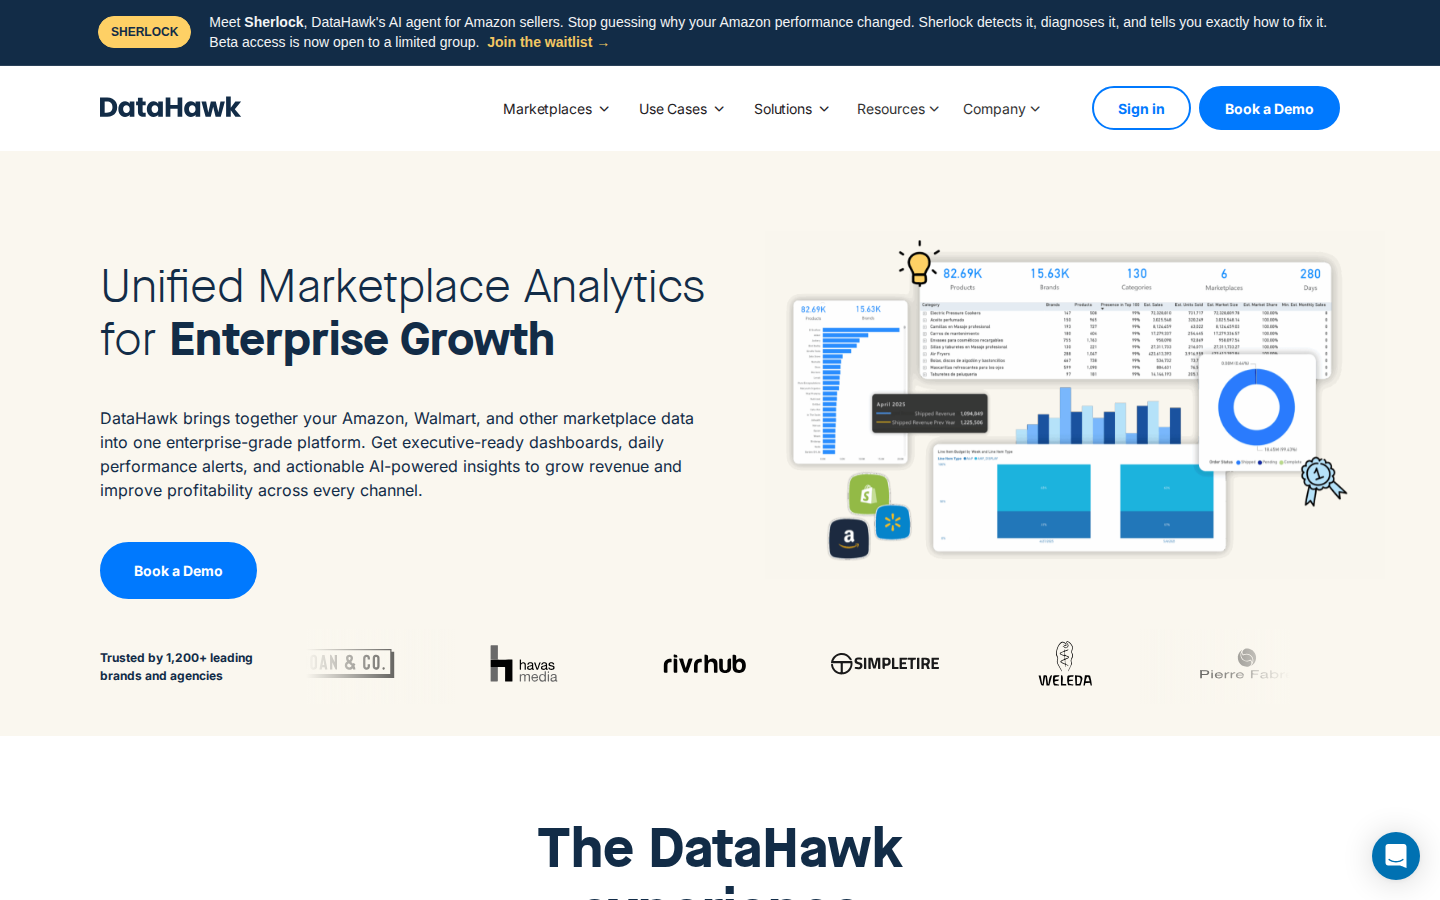
5. DataHawk
Analytics teams building keyword dashboards and BI reports
Rank-based organic SOV, sponsored rank coverage through Premium Keywords, and reporting integrations
1. SmartScout: Best for Broad Competitive Visibility and Estimated Ad Spend
SmartScout connects keyword visibility to brands, products, categories, and advertising. We track more than 2 million Amazon keywords with a 24-month history, giving teams a way to look beyond a short list of manually monitored terms. You can study a single search term or trends across a collection of keywords and see how a brand's organic and paid presence changes over time.
OurAdSpy separates key paid positions: Sponsored Brands, Sponsored Products, and Sponsored Brands video. It also tracks the top Sponsored Products position on its own line. That specific spot is too valuable to bury in an average across every sponsored placement. Placement-level win rates show how consistently a brand appears, and searches can be captured multiple times a day to reduce the risk of treating one auction snapshot as the whole market.
SmartScout models CTR by placement, then combines keyword search volume, placement win rates, and estimated CPC to produce directional competitive ad spend.
This helps answer practical questions: Which competitor is consistently buying your category's most important terms? Is it defending its own brand? Is its presence in the top sponsored slot growing? Which keywords appear to consume the largest budget?
Where it fits best: Teams that need a wide competitive map, historical trends, and an estimate of where rivals direct search ad dollars. Its search-result-based spend estimate does not include every Amazon advertising surface: product detail page ads, Sponsored Display, DSP, and ads beyond the tracked search placements are outside that model. The estimates are useful for comparing patterns, not auditing another company's actual spend.
2. Xnurta: Best for Tying SOV Research to Ad Operations
Xnurta SOV Insights provides brand- and product-level views of visibility for selected search terms. Its published description says it monitors the top three pages of Amazon results and includes organic rankings, Sponsored Products, Sponsored Brands, and Sponsored Brands video. Teams can compare brands and products, view placement-specific SOV, and study changes over time.
Xnurta also connects SOV analysis to its broader Sponsored Ads management platform, making it a sensible evaluation for advertisers who want competitive monitoring near bidding and budget workflows. Ask how its keyword selection, time sampling, and SOV denominator compare with the terms and placements your team cares about. Where it fits best: Brands and agencies that want to act on SOV findings in the same advertising environment.
3. Intentwise: Best for Frequent Monitoring of a Chosen Keyword Set
Intentwise Share of Voice breaks out total, organic, and ad SOV at the brand, keyword, and product levels. Its documentation says it captures the first page of selected Amazon searches four times daily across U.S. regions. It also reports best and average organic and ad positions, plus daily, weekly, and monthly trends.
Intentwise describes its total SOV as a brand's share of all page-one appearances, including organic, sponsored, and branded placements. That clear definition is useful when a team needs to explain exactly what a headline percentage means. Its emphasis on a selected keyword set makes the choice and maintenance of that set especially important.
Where it fits best: Operators who already know which search terms to monitor and want regular competitive position reporting.
4. Pacvue: Best for Large, Cross-Retailer Teams
Pacvue Market and Competitive Insights measures organic and paid SOV on Amazon and other supported retail networks. It lets teams benchmark visibility by keyword, product, and category and connect those signals with demand, pricing, and media decisions.
For a brand selling through several retailers, that scope is attractive: the same group can examine where visibility is shifting across channels and bring the findings into its retail media workflow. Pacvue is worth evaluating when Amazon SOV is one part of a larger enterprise measurement and activation program. Confirm the exact retailer, ad placement, reporting, and historical coverage needed for your account in a demo.
Where it fits best: Established brands and agencies with cross-retailer media operations.
5. DataHawk: Best for Keyword Reporting and BI Workflows
DataHawk builds SOV analysis from tracked keyword rankings on Amazon and Walmart. Its documentation describes daily organic rank monitoring and sponsored rank coverage through Premium Keywords, with options to move the resulting metrics into BI tools such as Power BI.
That makes it a useful choice when your team wants defined keyword groups, a consistent trend line, and flexible reporting. If sponsored visibility is central to the project, verify that your plan and tracked keywords include the paid rank coverage you need.
Where it fits best: Analytics teams that want SOV alongside keyword rank tracking and custom dashboards.
How To Choose an Amazon SOV Tool
Start with the decision you need to make.
For organic growth, ask which terms and ASINs are gaining positions and whether the metric weights prominent results more heavily.
For advertising, ask whether the platform distinguishes Sponsored Products, Sponsored Brands, video, and the first sponsored slot.
For competitor budgets, ask how the provider turns observed placements into estimated clicks and spend.
Then compare the measurement design: How many relevant keywords are available? Can you bring your own list? How often is each search checked? How far back does history go? Does the tool count appearances or estimate likely clicks? A 30% SOV figure can mean different things under different methods.
For brands that want a wide view of Amazon competition and a way to connect who wins visibility with where paid search dollars may be going, start withSmartScout's Share of Voice and AdSpy.
If your priority is managing campaigns within the same platform, explore Xnurta or Pacvue. If you need regular reporting on a defined keyword set, evaluate Intentwise and DataHawk.
FAQs
5 Best Amazon Share of Voice Tools for Brands and Agencies
Lorem ipsum dolor sit amet, consectetur adipiscing elit, sed do eiusmod tempor incididunt ut labore et dolore magna aliqua. Ut enim ad minim veniam, quis nostrud exercitation ullamco laboris nisi ut aliquip ex ea commodo consequat. Duis aute irure dolor in reprehenderit in voluptate velit esse cillum dolore eu fugiat nulla pariatur.
Lorem ipsum dolor sit amet, consectetur adipiscing elit, sed do eiusmod tempor incididunt ut labore et dolore magna aliqua. Ut enim ad minim veniam, quis nostrud exercitation ullamco laboris nisi ut aliquip ex ea commodo consequat. Duis aute irure dolor in reprehenderit in voluptate velit esse cillum dolore eu fugiat nulla pariatur.
Lorem ipsum dolor sit amet, consectetur adipiscing elit, sed do eiusmod tempor incididunt ut labore et dolore magna aliqua. Ut enim ad minim veniam, quis nostrud exercitation ullamco laboris nisi ut aliquip ex ea commodo consequat. Duis aute irure dolor in reprehenderit in voluptate velit esse cillum dolore eu fugiat nulla pariatur.




.png)