How To Find Amazon Sellers as an Agency Using SmartScout
25 多个 “如何在亚马逊上开店” 课程、指导和培训
Cameron McDonald
In the dynamic world of Amazon commerce, agencies seeking to collaborate with sellers need efficient tools to identify and connect with potential partners. SmartScout's Sellers Tool offers a comprehensive solution, enabling agencies to discover Amazon sellers across various scales—big, medium, and small. This guide will walk you through the process of leveraging the Sellers Tool to find Amazon sellers effectively.
Why Finding the Right Amazon Sellers Matters
For agencies that specialize in services such as brand management, advertising, logistics, or operational support, identifying the right Amazon sellers can make all the difference. Whether you’re looking for high-revenue sellers who need scaling solutions or smaller brands seeking guidance on marketplace strategy, SmartScout provides the granular data necessary to make informed outreach decisions.
Understanding the SmartScout Sellers Tool
SmartScout’s Sellers Tool tracks over two million Amazon sellers across multiple marketplaces, offering detailed insights into their performance, revenue, brand affiliations, fulfillment methods, and growth trends. This makes it an invaluable resource for agencies looking to find and engage with sellers who match their ideal client profile.
Key Features of the SmartScout Sellers Tool:
Comprehensive Database: Access data on over 2 million Amazon sellers worldwide.
Revenue Insights: See estimated monthly revenue and trends.
Brand Affiliation: Discover whether sellers are resellers or private label brands.
Geographic Filtering: Identify sellers based on country or region.
Fulfillment Methods: Determine if sellers use Fulfilled by Amazon (FBA), Fulfilled by Merchant (FBM), or both.
Begin by logging into your SmartScout account and navigating to the Sellers Tool dashboard. Here, you’ll find a vast database of Amazon sellers with key metrics displayed in a spreadsheet-style format.
2. Use Filters to Narrow Down Sellers
One of the most powerful aspects of SmartScout is its filtering capabilities. These allow you to pinpoint sellers based on specific criteria that align with your agency’s objectives.
Revenue-Based Filtering
To find sellers within a specific revenue range, set a minimum and maximum revenue threshold:
To find big sellers, set a revenue filter to $500,000+ per month.
For medium-sized sellers, adjust the filter to $100,000 - $500,000 per month.
If targeting small sellers, set the filter to $10,000 - $100,000 per month.
Filtering by Number of Brands
Sellers with 1-2 brands are usually private label brands.
Sellers with 5+ brands are typically resellers.
Adjust these filters depending on whether you want to work with direct brand owners or wholesale sellers.
Geographic Filtering
If your agency operates within specific regions, use the Country filter to find sellers in your target location. For instance, selecting “United States” will display sellers based in the U.S., making it easier to find local businesses to partner with.
Filtering by Fulfillment Type
FBA Sellers: These sellers use Amazon’s fulfillment services and may need help with advertising, logistics, or expansion.
FBM Sellers: These sellers handle their own fulfillment and could benefit from warehouse or operational support.
Hybrid Sellers: A mix of FBA and FBM, often scaling brands that require a variety of services.
3. Analyze Seller Profiles for Opportunities
Once you’ve applied filters, SmartScout will generate a refined list of sellers. Click on individual sellers to view more detailed information, including:
Growth Trends: Assess whether their business is expanding or contracting over time.
Brand Portfolio: Examine the brands they sell and their market share.
Seller History: Review past performance, feedback ratings, and longevity on Amazon.
Buy Box Ownership: Understand their dominance over their listed products, which can indicate potential pain points or opportunities.
4. Export Seller Data for Outreach
SmartScout allows users to export their filtered list of sellers. This feature enables agencies to import seller data into their CRM or lead generation tools. The exported list will include business names, addresses, and relevant seller information.
To gather contact details, use tools like:
Apollo.io
ZoomInfo
Seamless.ai
These platforms help enrich your data by providing direct emails, phone numbers, and LinkedIn profiles of seller contacts.
Best Practices for Agency Outreach
Once you have a refined list of sellers, follow these best practices to maximize your outreach efforts:
Personalize Your Messaging
Rather than using a generic sales pitch, tailor your communication to highlight how your services align with the seller’s specific needs. For example:
For growing private label brands: Focus on how your agency can optimize their listings and boost advertising performance.
For resellers: Highlight services like logistics optimization or supply chain support.
Leverage Data Insights to Demonstrate Value
Use SmartScout’s seller insights to showcase your expertise. For example, mentioning that a seller’s growth rate has slowed or that their Buy Box share is declining can be a compelling way to introduce how your agency can help.
Highlight Mutual Benefits
Instead of a hard sell, focus on how a partnership can help sellers scale, increase profitability, or improve operational efficiency. Showcase case studies or testimonials from similar clients to build credibility.
Follow Up Strategically
Most sellers won’t respond to the first outreach. Implement a follow-up strategy that includes:
Providing additional value (e.g., sending a quick audit of their Amazon store)
Timing follow-ups based on their business cycles (e.g., before major shopping seasons)
Conclusion
Finding the right Amazon sellers as an agency doesn’t have to be a guessing game. SmartScout’s Sellers Tool simplifies the process, providing deep insights into over two million sellers. By strategically using filters, analyzing seller data, and refining outreach techniques, agencies can build high-value partnerships that drive mutual success.
Whether you’re targeting high-revenue sellers needing scaling solutions, medium-sized brands seeking Amazon expertise, or small businesses looking for growth, SmartScout empowers you to find the perfect clients efficiently.
Start using the Sellers Tool today and unlock new opportunities in the Amazon marketplace!
How To Find Amazon Sellers as an Agency Using SmartScout
Amazon Marketing
Selling on Amazon
2.21.25
0
Min
In the dynamic world of Amazon commerce, agencies seeking to collaborate with sellers need efficient tools to identify and connect with potential partners. SmartScout's Sellers Tool offers a comprehensive solution, enabling agencies to discover Amazon sellers across various scales—big, medium, and small. This guide will walk you through the process of leveraging the Sellers Tool to find Amazon sellers effectively.
Why Finding the Right Amazon Sellers Matters
For agencies that specialize in services such as brand management, advertising, logistics, or operational support, identifying the right Amazon sellers can make all the difference. Whether you’re looking for high-revenue sellers who need scaling solutions or smaller brands seeking guidance on marketplace strategy, SmartScout provides the granular data necessary to make informed outreach decisions.
Understanding the SmartScout Sellers Tool
SmartScout’s Sellers Tool tracks over two million Amazon sellers across multiple marketplaces, offering detailed insights into their performance, revenue, brand affiliations, fulfillment methods, and growth trends. This makes it an invaluable resource for agencies looking to find and engage with sellers who match their ideal client profile.
Key Features of the SmartScout Sellers Tool:
Comprehensive Database: Access data on over 2 million Amazon sellers worldwide.
Revenue Insights: See estimated monthly revenue and trends.
Brand Affiliation: Discover whether sellers are resellers or private label brands.
Geographic Filtering: Identify sellers based on country or region.
Fulfillment Methods: Determine if sellers use Fulfilled by Amazon (FBA), Fulfilled by Merchant (FBM), or both.
Begin by logging into your SmartScout account and navigating to the Sellers Tool dashboard. Here, you’ll find a vast database of Amazon sellers with key metrics displayed in a spreadsheet-style format.
2. Use Filters to Narrow Down Sellers
One of the most powerful aspects of SmartScout is its filtering capabilities. These allow you to pinpoint sellers based on specific criteria that align with your agency’s objectives.
Revenue-Based Filtering
To find sellers within a specific revenue range, set a minimum and maximum revenue threshold:
To find big sellers, set a revenue filter to $500,000+ per month.
For medium-sized sellers, adjust the filter to $100,000 - $500,000 per month.
If targeting small sellers, set the filter to $10,000 - $100,000 per month.
Filtering by Number of Brands
Sellers with 1-2 brands are usually private label brands.
Sellers with 5+ brands are typically resellers.
Adjust these filters depending on whether you want to work with direct brand owners or wholesale sellers.
Geographic Filtering
If your agency operates within specific regions, use the Country filter to find sellers in your target location. For instance, selecting “United States” will display sellers based in the U.S., making it easier to find local businesses to partner with.
Filtering by Fulfillment Type
FBA Sellers: These sellers use Amazon’s fulfillment services and may need help with advertising, logistics, or expansion.
FBM Sellers: These sellers handle their own fulfillment and could benefit from warehouse or operational support.
Hybrid Sellers: A mix of FBA and FBM, often scaling brands that require a variety of services.
3. Analyze Seller Profiles for Opportunities
Once you’ve applied filters, SmartScout will generate a refined list of sellers. Click on individual sellers to view more detailed information, including:
Growth Trends: Assess whether their business is expanding or contracting over time.
Brand Portfolio: Examine the brands they sell and their market share.
Seller History: Review past performance, feedback ratings, and longevity on Amazon.
Buy Box Ownership: Understand their dominance over their listed products, which can indicate potential pain points or opportunities.
4. Export Seller Data for Outreach
SmartScout allows users to export their filtered list of sellers. This feature enables agencies to import seller data into their CRM or lead generation tools. The exported list will include business names, addresses, and relevant seller information.
To gather contact details, use tools like:
Apollo.io
ZoomInfo
Seamless.ai
These platforms help enrich your data by providing direct emails, phone numbers, and LinkedIn profiles of seller contacts.
Best Practices for Agency Outreach
Once you have a refined list of sellers, follow these best practices to maximize your outreach efforts:
Personalize Your Messaging
Rather than using a generic sales pitch, tailor your communication to highlight how your services align with the seller’s specific needs. For example:
For growing private label brands: Focus on how your agency can optimize their listings and boost advertising performance.
For resellers: Highlight services like logistics optimization or supply chain support.
Leverage Data Insights to Demonstrate Value
Use SmartScout’s seller insights to showcase your expertise. For example, mentioning that a seller’s growth rate has slowed or that their Buy Box share is declining can be a compelling way to introduce how your agency can help.
Highlight Mutual Benefits
Instead of a hard sell, focus on how a partnership can help sellers scale, increase profitability, or improve operational efficiency. Showcase case studies or testimonials from similar clients to build credibility.
Follow Up Strategically
Most sellers won’t respond to the first outreach. Implement a follow-up strategy that includes:
Providing additional value (e.g., sending a quick audit of their Amazon store)
Timing follow-ups based on their business cycles (e.g., before major shopping seasons)
Conclusion
Finding the right Amazon sellers as an agency doesn’t have to be a guessing game. SmartScout’s Sellers Tool simplifies the process, providing deep insights into over two million sellers. By strategically using filters, analyzing seller data, and refining outreach techniques, agencies can build high-value partnerships that drive mutual success.
Whether you’re targeting high-revenue sellers needing scaling solutions, medium-sized brands seeking Amazon expertise, or small businesses looking for growth, SmartScout empowers you to find the perfect clients efficiently.
Start using the Sellers Tool today and unlock new opportunities in the Amazon marketplace!
The Helium 10 vs. Jungle Scout debate has remained relevant for more than a decade.
These two platforms have dominated the Amazon seller tool space since 2015, and nearly every FBA seller has used one or both at some point. But the question that keeps coming up in every Amazon seller community, subreddit, and Facebook group is the same: which one should you actually pay for?
Both tools have changed significantly in 2026. Helium 10 removed its affordable Starter plan, raised prices across the board, and expanded into Walmart and TikTok Shop. Jungle Scout rebranded its entire plan structure under the "Catalyst" name, refined its AI tools, and doubled down on what it has always done well: helping sellers find and launch products on Amazon.
Both platforms look similar on the surface. They're not. Here's exactly where they differ and which one is worth your money in 2026.
Helium 10 vs Jungle Scout: Quick Verdict
Jungle Scout Catalyst is the better choice for beginners, budget-conscious sellers, and anyone focused on product research and validation. Its simplified workflows, superior supplier database, and lower pricing make it the smarter entry point into Amazon selling.
Helium 10 is the better choice for experienced sellers who need advanced keyword research, PPC automation, and multi-channel selling across Amazon, Walmart, and TikTok Shop. Its tool depth is unmatched, but the pricing reflects that.
That said, both tools share a common gap: neither provides brand-level market intelligence, subcategory revenue analysis, or seller mapping. Sellers who need that strategic market view often pair Helium 10 or Jungle Scout with a dedicated market intelligence platform like SmartScout, using it to identify opportunities at the brand, category, and seller level before moving into product research and optimization.
Here is a side-by-side snapshot of how both tools stack up across every major capability. Pay attention to the three rows near the bottom (Brand Intelligence, Traffic Analysis, Seller Mapping), as they highlight where both platforms have blind spots.
Parameter
Helium 10
Jungle Scout Catalyst
Specialization
All-in-one seller suite with 20+ tools
Beginner-friendly product research and launch platform
Best For
Experienced sellers and scaling operations
New sellers, SMBs, and product validation
Product Research
Black Box with advanced filters
Product Database and Opportunity Finder
Keyword Research
Cerebro and Magnet with deep ASIN-level data
Keyword Scout with simpler, actionable insights
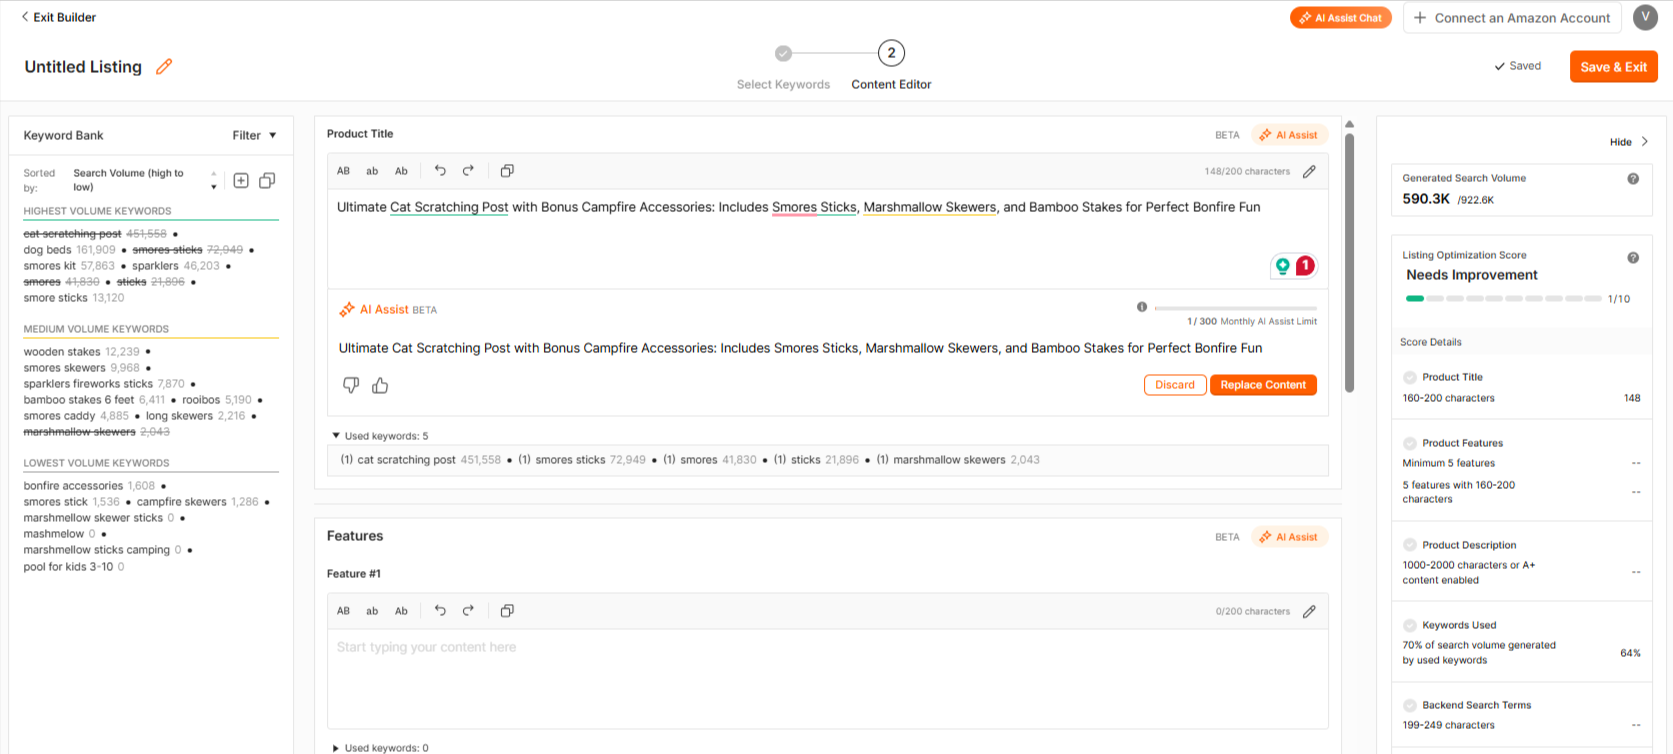
Listing Optimization
Scribbles and AI Listing Builder with ChatGPT
Listing Builder with AI Assist
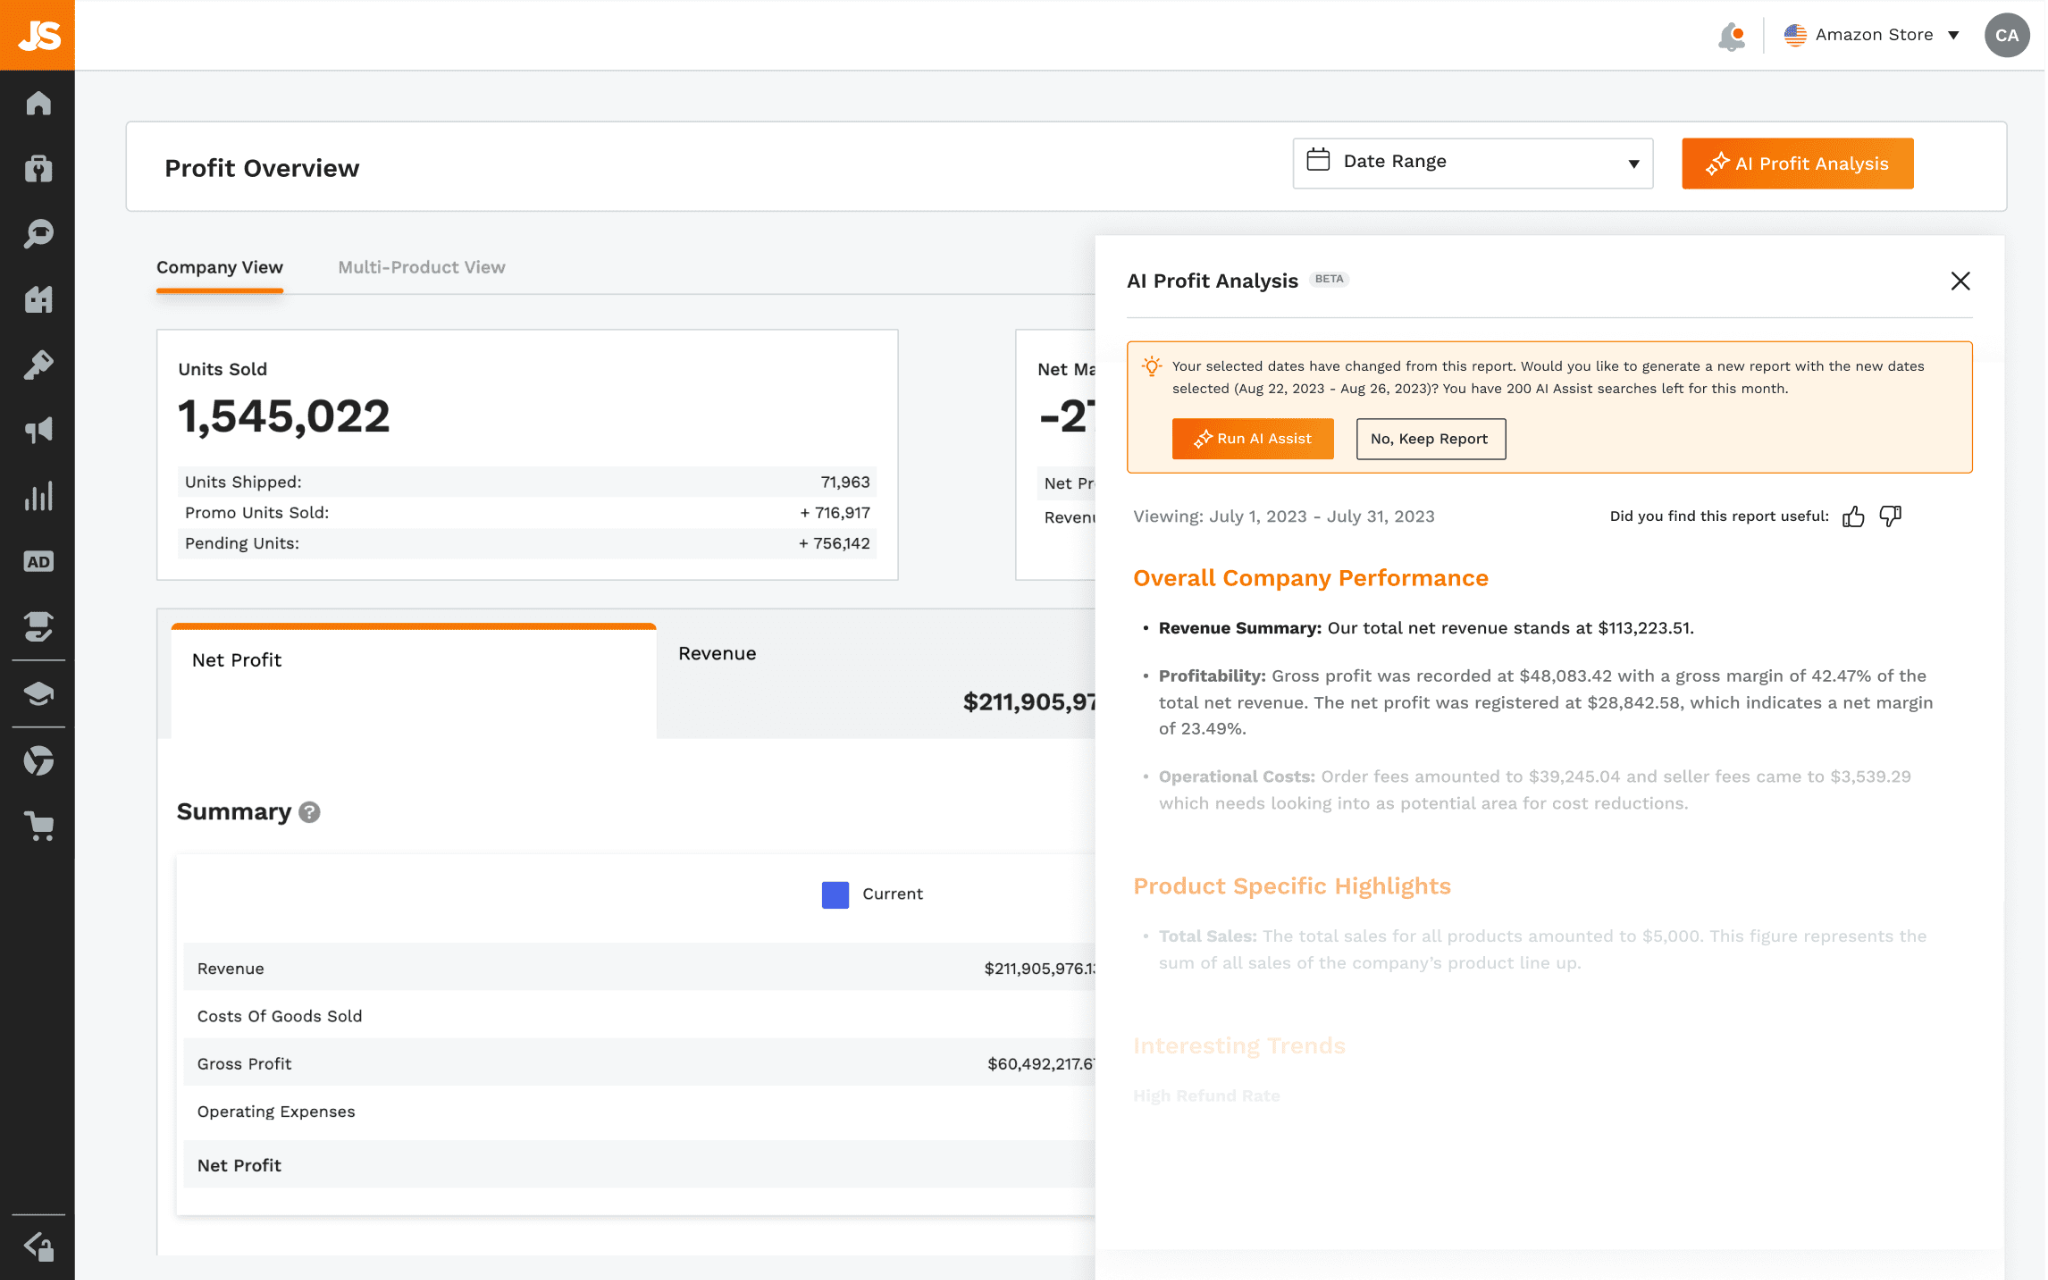
PPC Management
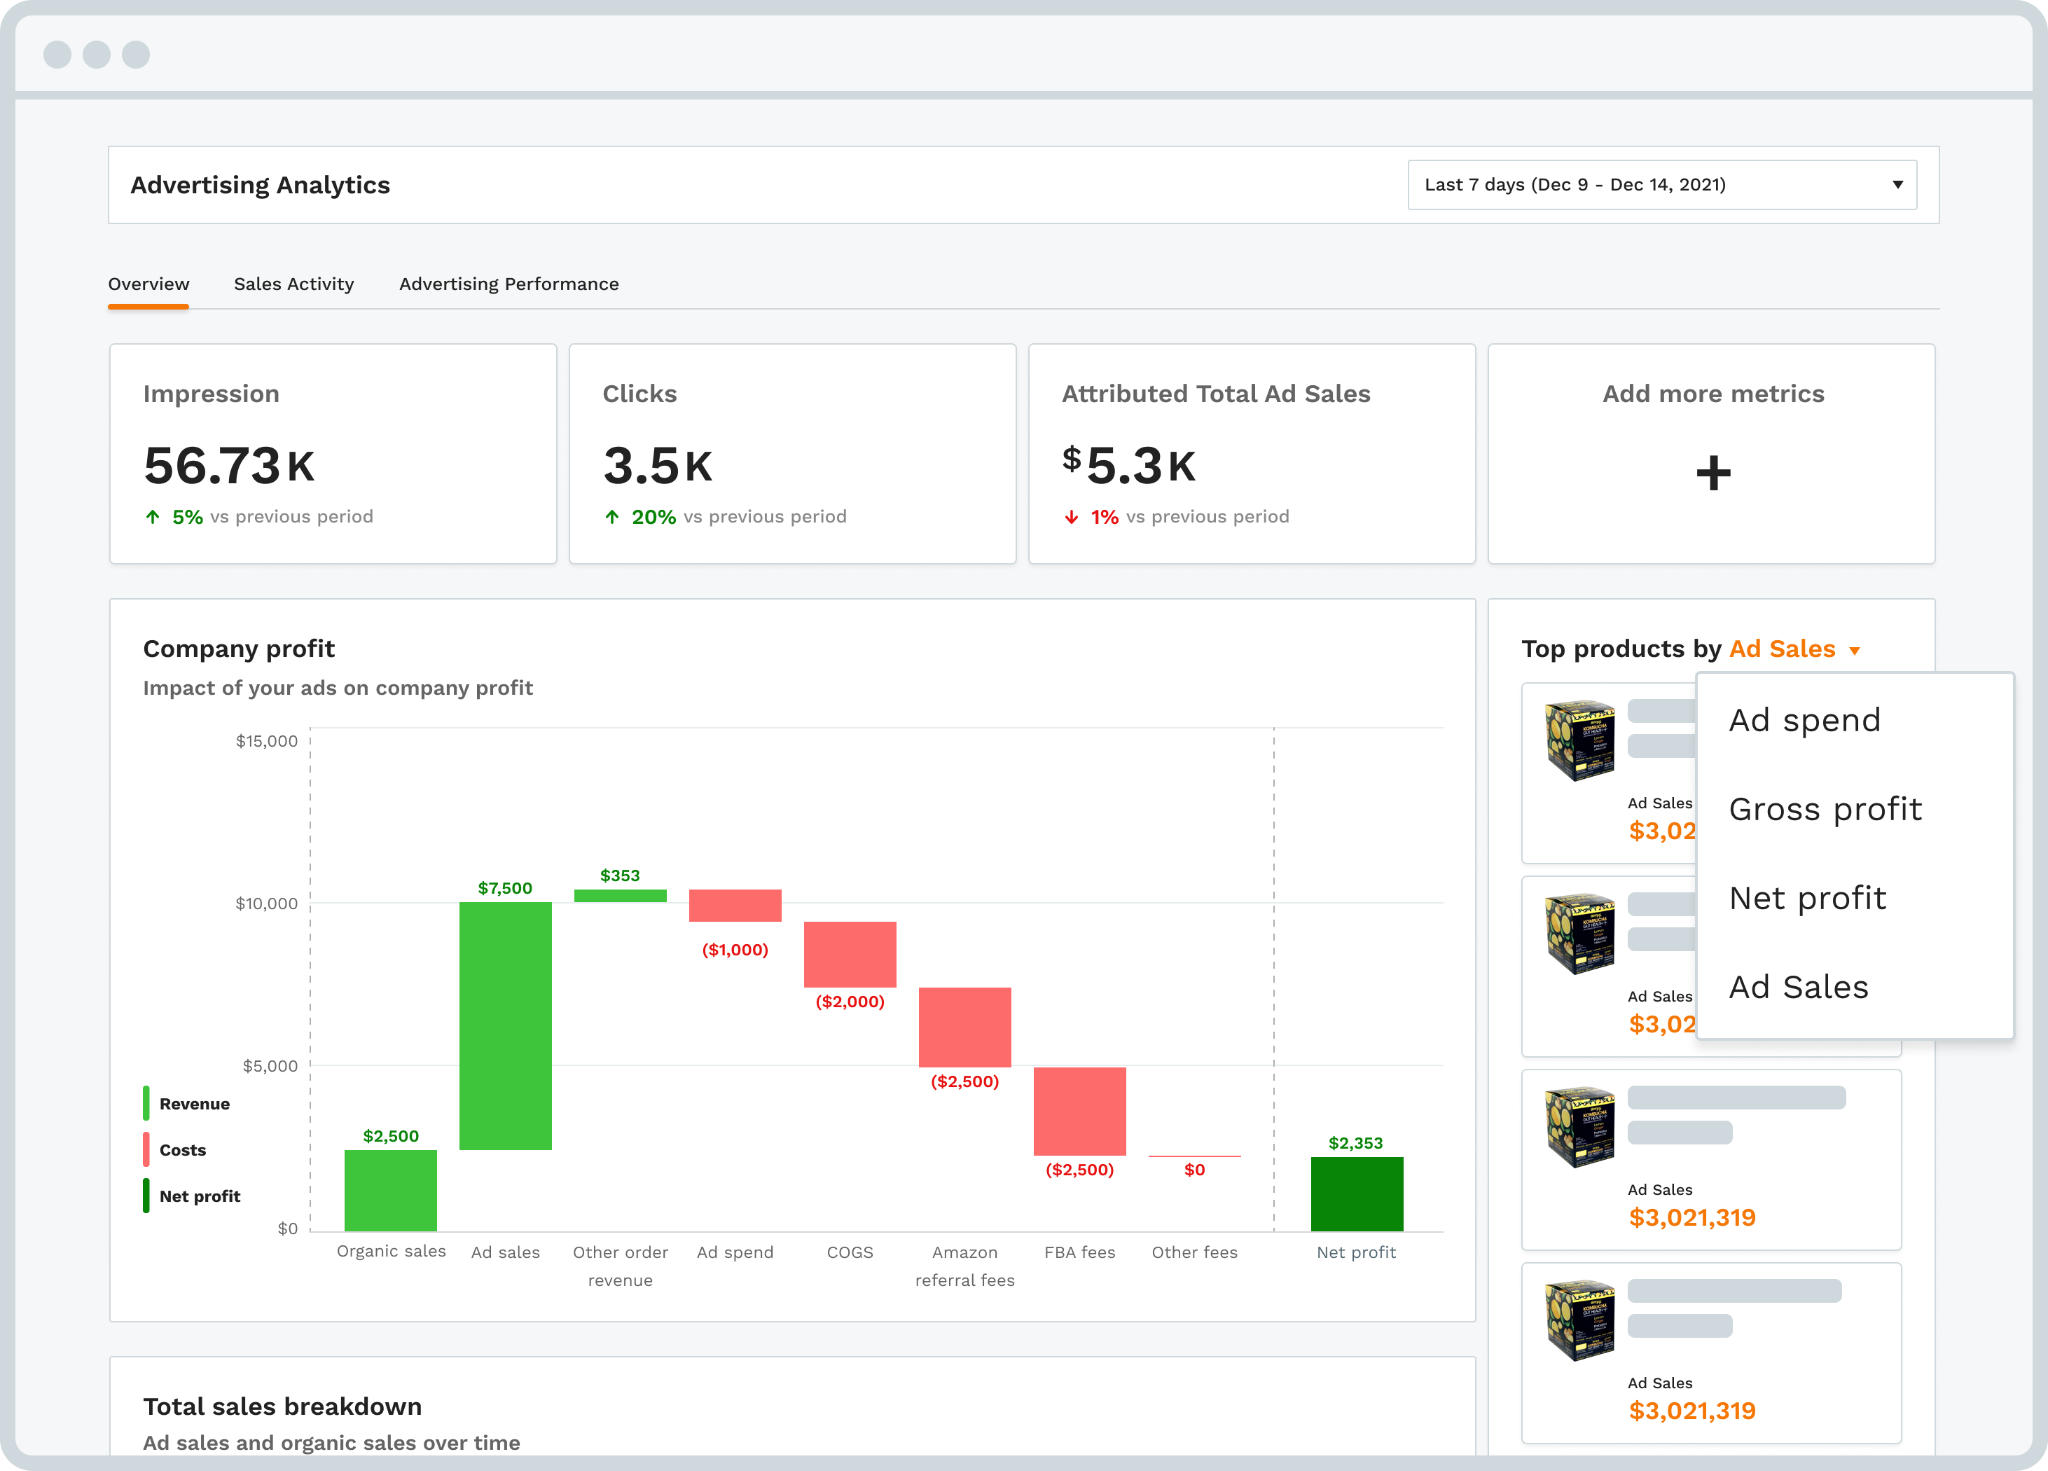
Adtomic with full automation and AI-driven campaign support
Advertising Analytics through Growth Accelerator+
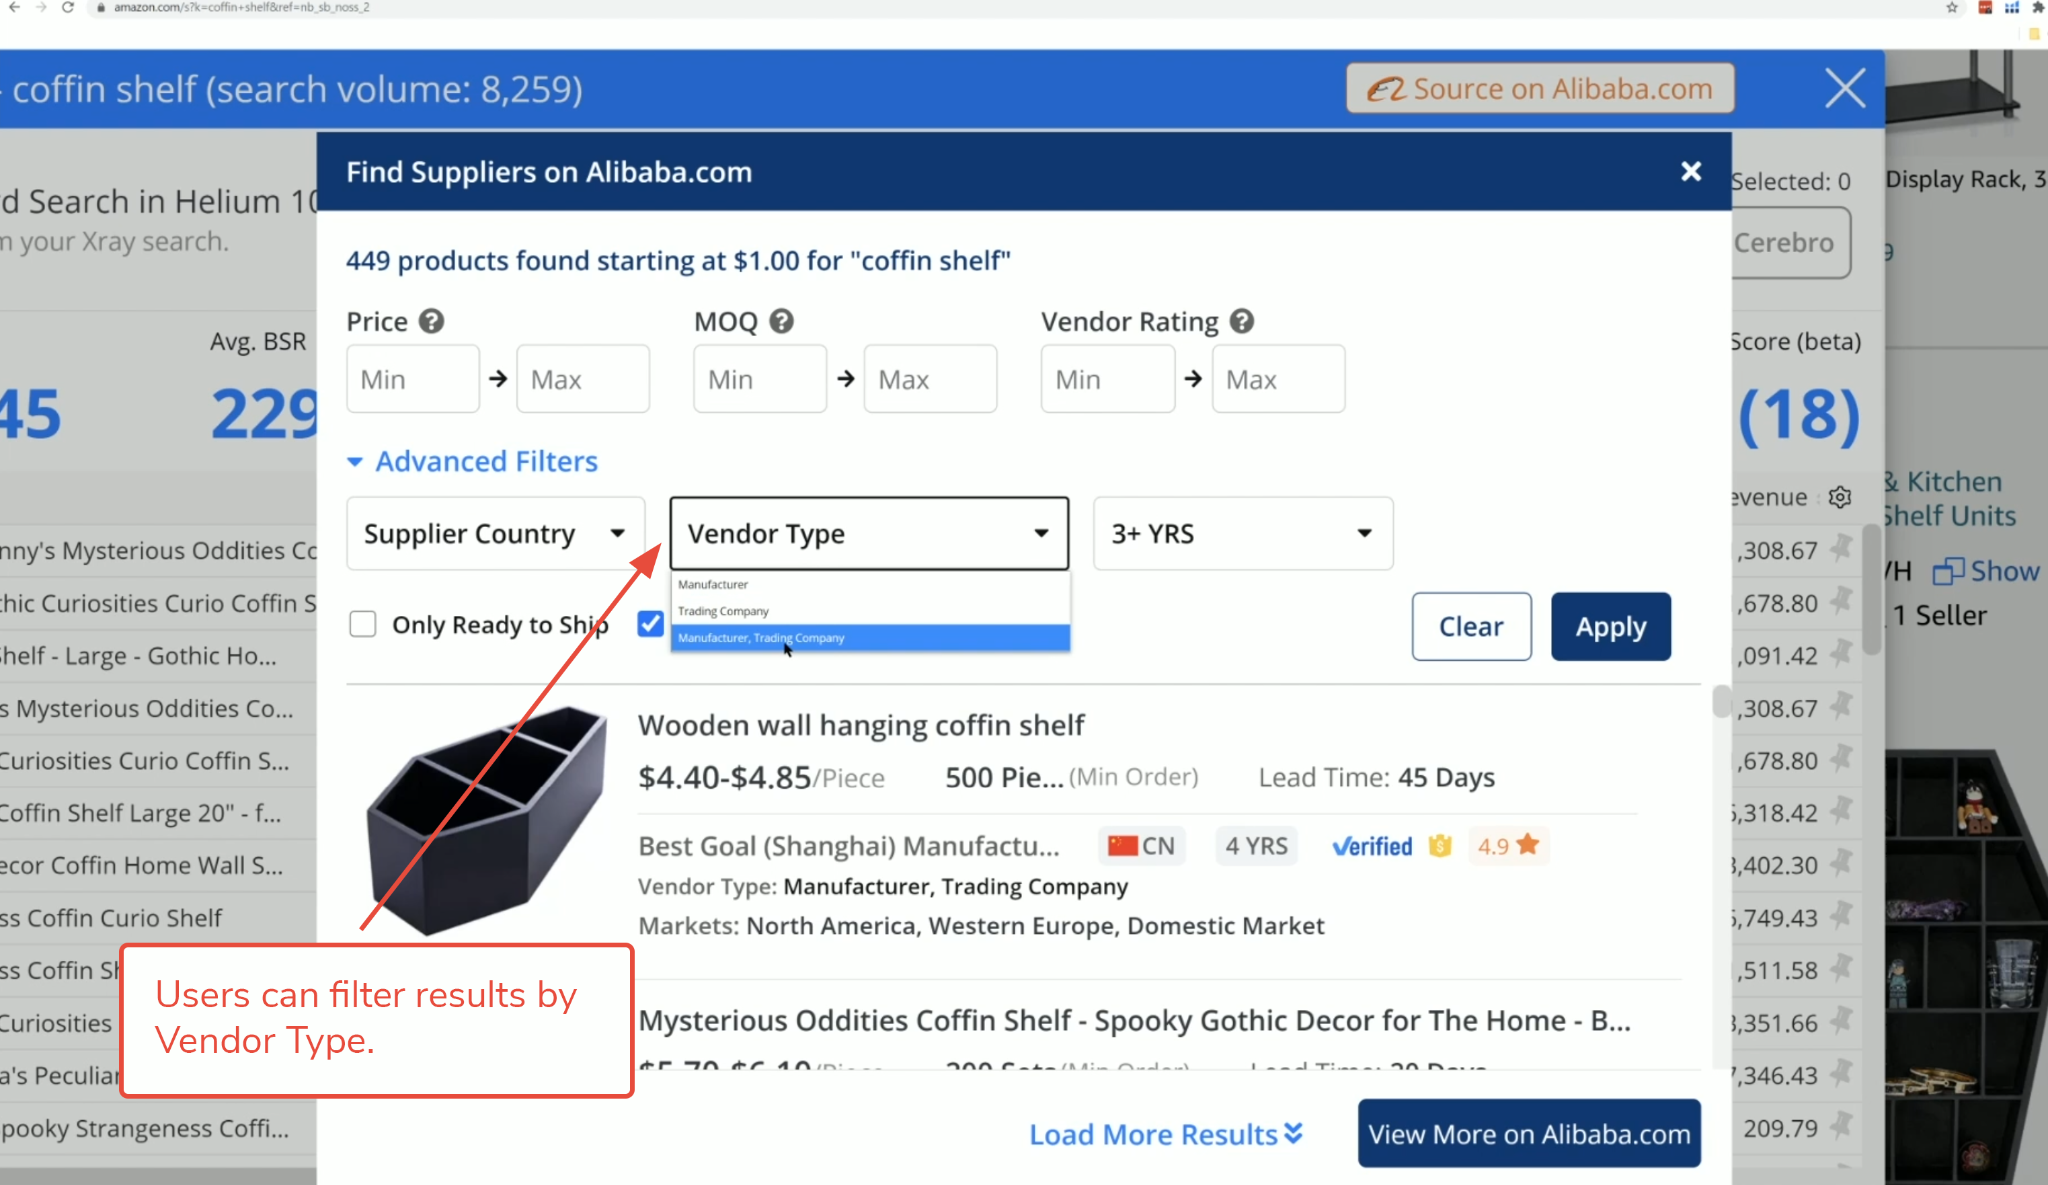
Supplier Sourcing
Supplier Finder through Alibaba via Chrome extension
Supplier Database with global, vetted suppliers and shipment data
Review Automation
No built-in tool
Yes, through Growth Accelerator+
Rank Tracking
Up to 2,500 keywords per product with daily updates
Rank Tracker with relevancy scoring
Inventory Management
Yes, through the Diamond plan
Inventory Manager through Growth Accelerator+
Chrome Extension
Xray, paid and Chrome only
Free extension for Chrome and Firefox
Brand Intelligence
Market Tracker at the product level
No brand-level analytics
Traffic Analysis
No equivalent
No equivalent
Seller Mapping
No equivalent
No equivalent
AI Tools
AI chat, listing builder, and PPC automation
AI Assist for chat, listings, review analysis, and analytics
Free Trial
Free plan with limited access
7-day money-back guarantee
Starting Price
$129/month for the Platinum plan
$49/month for the Starter plan
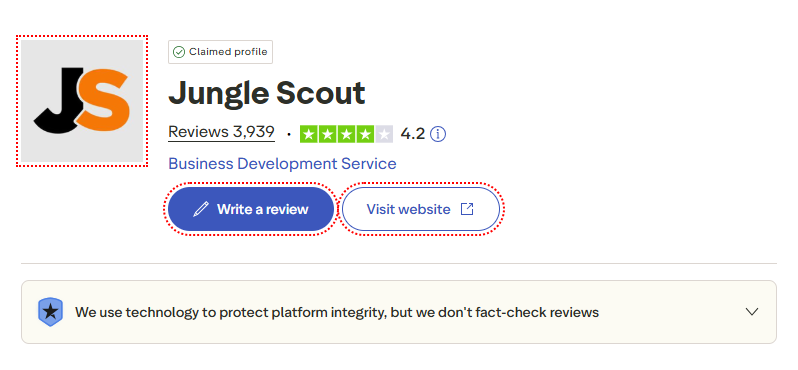
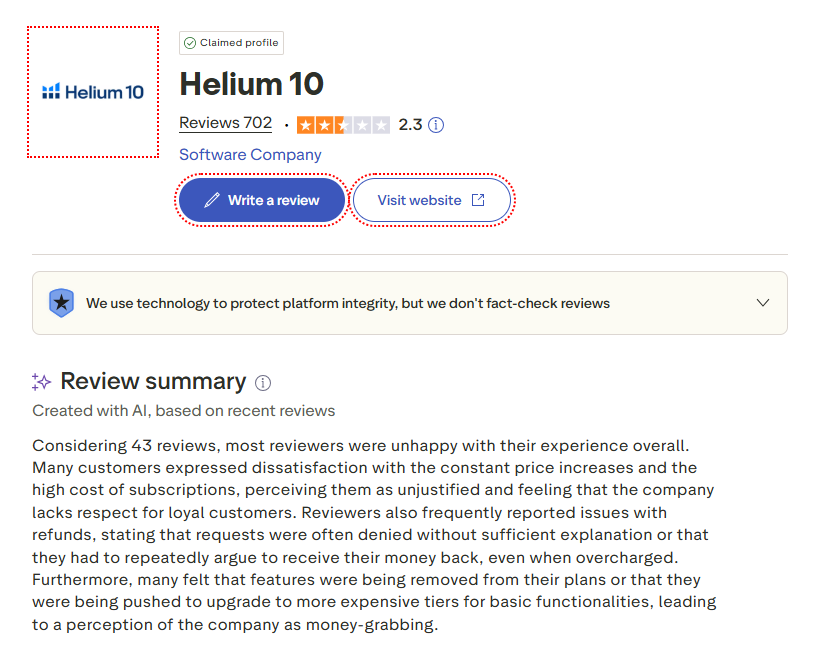
Trustpilot Rating
2.3/5 from 700+ reviews
4.2/5 from 3,900+ reviews
The table makes one thing clear: these tools overlap in many areas but differ sharply in philosophy. Helium 10 goes wide and deep. Jungle Scout keeps things focused and accessible. And both leave market-level intelligence off the table entirely.
Who Should Choose Helium 10?
Go with Helium 10 if:
You already have an established Amazon business and want advanced optimization tools
You sell on Walmart or TikTok Shop in addition to Amazon
You want granular keyword data with Cerebro's IQ Score and advanced filtering
You need full PPC campaign automation, not just analytics
You manage multiple seller accounts and need the Diamond plan's multi-user access
Skip Helium 10 if:
You are launching your first product and want a guided workflow
You are on a tight budget (no plan under $129/month)
You need a built-in supplier database for sourcing products
You find 20+ tools overwhelming and prefer a streamlined interface
You want brand-level competitive intelligence or seller mapping (consider SmartScout instead)
Who Should Choose Jungle Scout?
Go with Jungle Scout if:
You are a new Amazon seller learning the ropes
You want product research, supplier sourcing, and listing tools in one affordable package
You run a small-to-medium business and need solid data without enterprise complexity
You want automated review requests built into your plan
You prefer a clean, intuitive interface with a shorter learning curve
Skip Jungle Scout if:
You sell on Walmart or TikTok Shop (Jungle Scout is Amazon-only)
You need advanced PPC bid automation and campaign management
You want the deepest possible keyword research with ASIN-level reverse lookups
You need to analyze entire brand ecosystems and wholesale opportunities
Helium 10 vs Jungle Scout: Platform Overviews
Helium 10 and Jungle Scout have been the biggest competitors against each other for the last decade. Millions of seller trust both tools for their capabilities. Let’s know more about them.
Helium 10 Overview
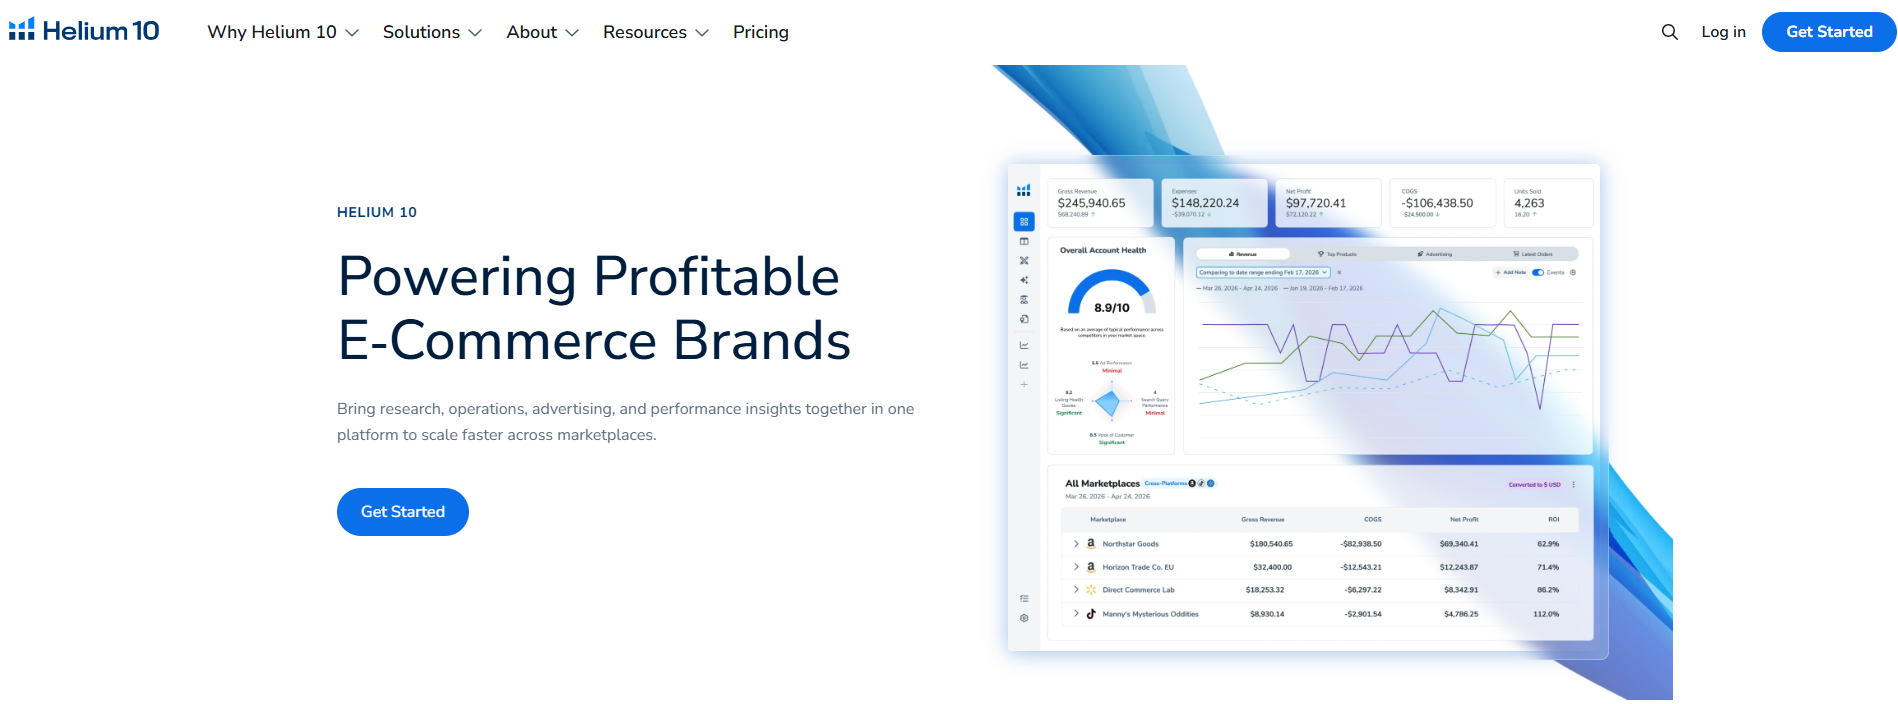
Helium 10 launched in 2015 as a Chrome extension built by Manny Coats and Guillermo Puyol. The idea was simple: give Amazon sellers the most accurate marketplace data available. Over the years, it expanded into a massive suite of 20+ integrated tools covering product research, keyword analysis, listing creation, PPC management, inventory tracking, and refund recovery.
In 2026, Helium 10 made two significant moves. First, it retired the $39 to $49 Starter plan, making Platinum ($129/month) the cheapest paid option. Second, it expanded beyond Amazon with full Walmart marketplace support and TikTok Shop tools, including a listing converter, influencer finder, and profitability calculator. The platform now positions itself as a multi-channel e-commerce toolkit rather than a pure Amazon tool.
Training comes via the Freedom Ticket course by Kevin King, included free with every paid plan. The course is regularly updated and remains one of the most comprehensive Amazon FBA training programs available.
Related: See how Helium 10 compares to SmartScout's market intelligence in our SmartScout vs Helium 10 comparison.
Jungle Scout Overview
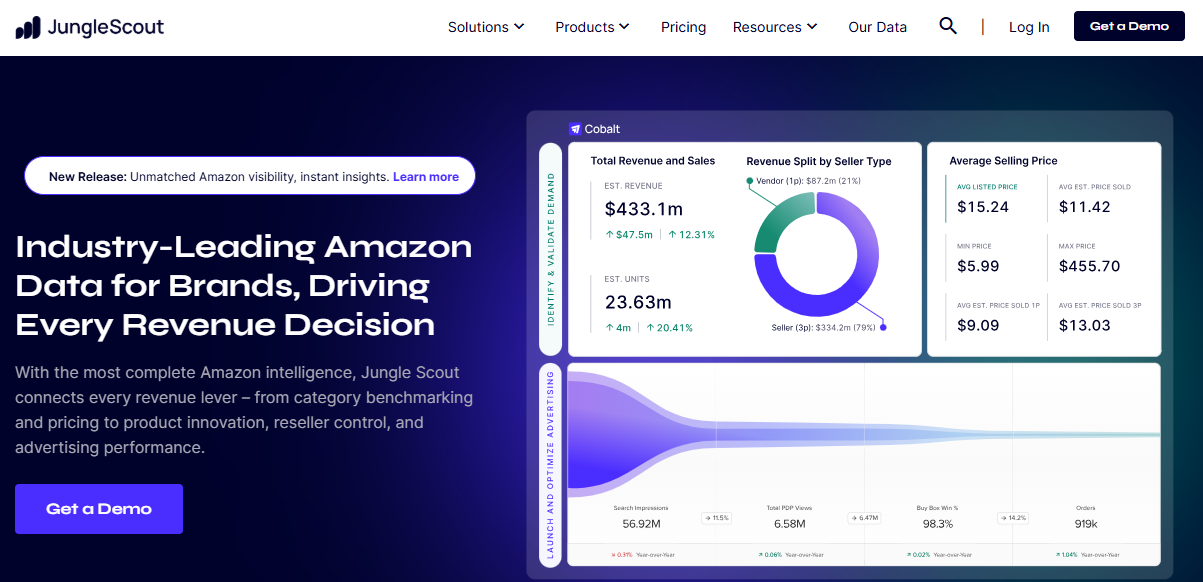
Jungle Scout also launched in 2015, founded by Greg Mercer after his early experience selling supplements on Amazon. The platform started with a singular focus: helping sellers find profitable products to sell. That DNA still runs through everything Jungle Scout builds.
In 2026, Jungle Scout rebranded its seller plans under the "Catalyst" umbrella. The old Basic, Suite, and Professional tiers are now Starter ($49/month), Growth Accelerator ($79/month), and Brand Owner ($149/month). For enterprise brands doing over $5 million annually, Jungle Scout offers Cobalt, a separate competitive intelligence platform with custom pricing.
Jungle Scout tracks over 600 million ASINs and uses 11 years of refined sales estimation algorithms. The AI Assist feature now spans four areas: sales analytics, review analysis, listing building, and an always-on Q&A chat. The Jungle Scout Academy provides free training modules for every plan.
Helium 10 vs Jungle Scout: Feature-by-Feature Comparison
Both tools promise to help you sell more on Amazon. But their approaches differ in meaningful ways. Here is how they compare across every feature that actually matters to your bottom line.
1. Product Research
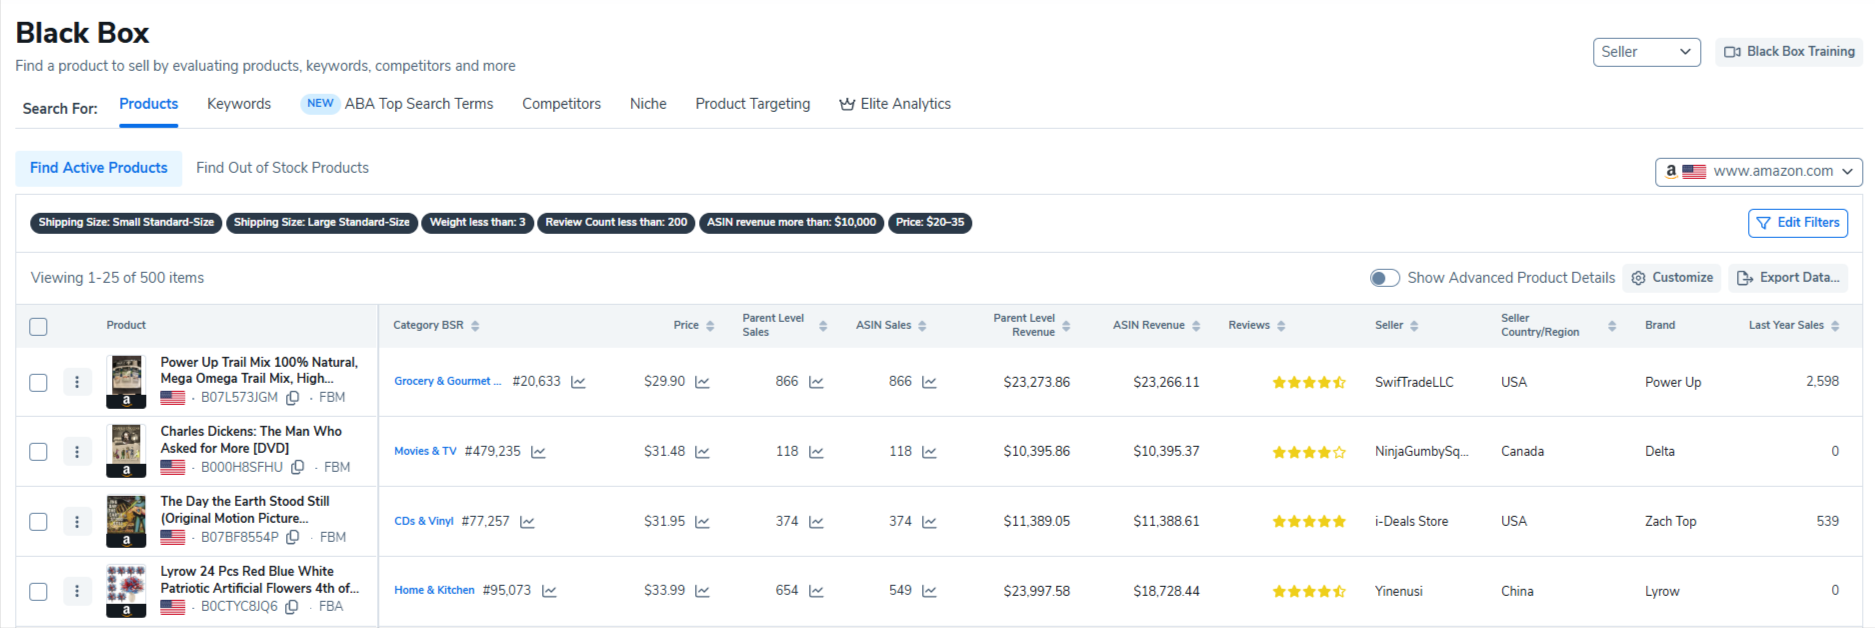
Helium 10: Black Box
Black Box is Helium 10's primary product research tool. It uses advanced filters, including price range, monthly revenue, review count, weight, category, and BSR to generate a list of product opportunities. The filters are highly configurable, and experienced sellers can create very specific search criteria to uncover niche products.
One advantage of Black Box is its integration with the broader Helium 10 suite. You can run a product search, click through to Cerebro for keyword analysis, and then move directly into the Listing Builder without leaving the platform.
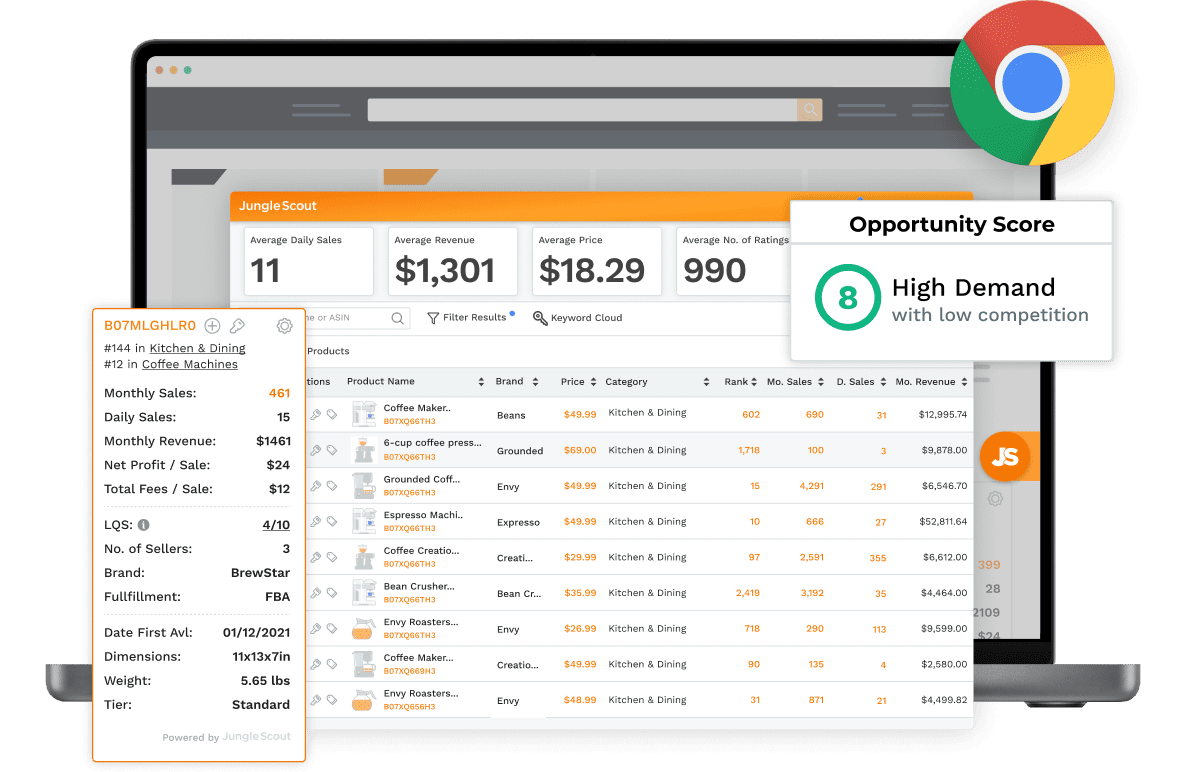
Jungle Scout: Product Database + Opportunity Finder
Jungle Scout splits its product research across two complementary tools. The Product Database works similarly to Black Box with filters for demand, competition, revenue, and category. Beginners who have no idea where to start can use preset filters to discover profitable categories immediately.
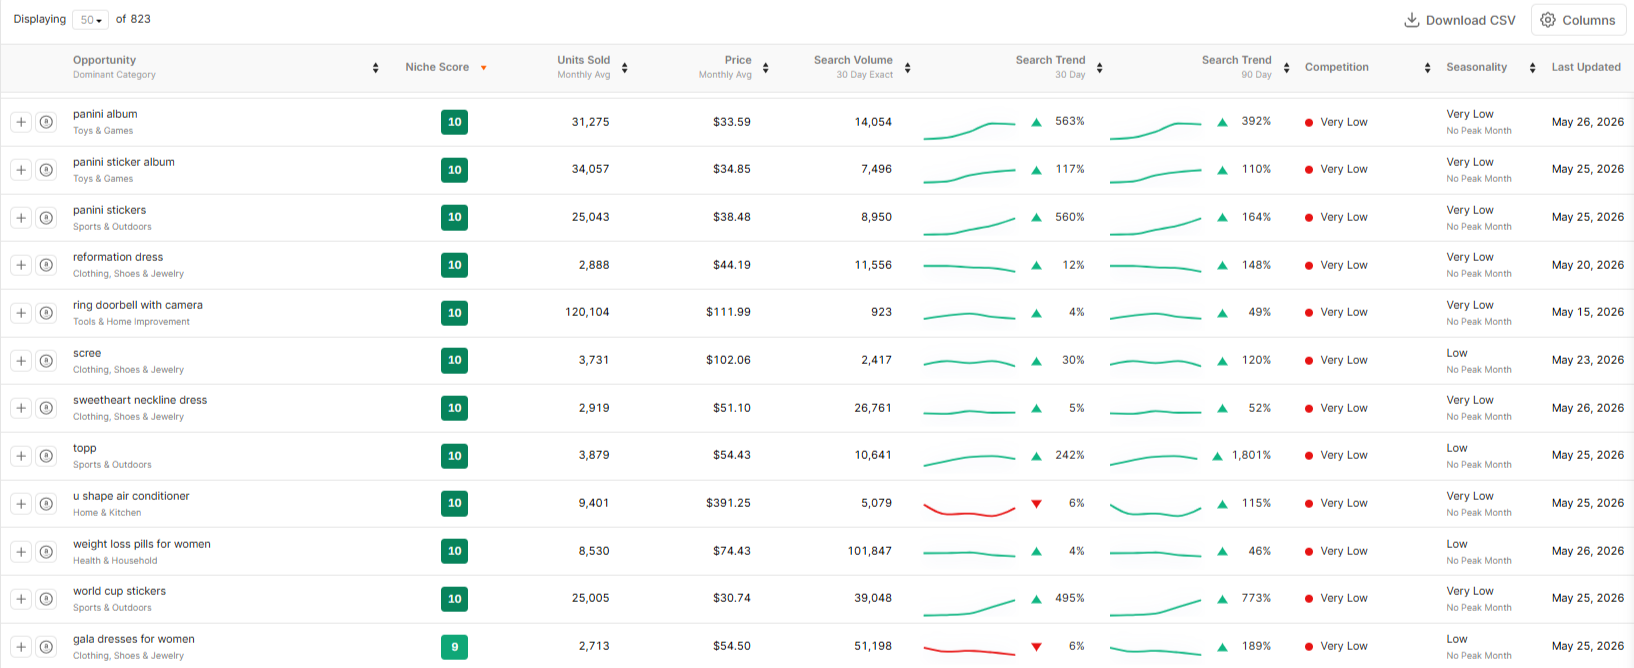
The Opportunity Finder adds something Black Box does not offer: a dedicated niche scoring system. The tool assigns a Niche Score from 1 to 10 based on demand, competition, and listing quality within a subcategory. Sellers targeting low-competition, high-demand products should aim for scores between 7 and 10.
Our Verdict: Jungle Scout wins for beginners and niche discovery thanks to the Opportunity Finder and its scoring system. Helium 10 wins for experienced sellers who want maximum filter control and tight integration with keyword tools.
Going deeper: Both tools approach product research from the bottom up, starting with individual products. SmartScout's Subcategories tool takes the opposite approach: start with 40,000+ subcategories, view revenue data and brand distribution, and then drill into individual products. This top-down method helps sellers discover profitable niches that product-level filters would never surface. See how it works in our resource guide.
Also Read: For a three-way comparison including market intelligence capabilities, check out our detailed SmartScout vs Helium 10 vs Jungle Scout breakdown.
2. Keyword Research
Helium 10: Cerebro and Magnet
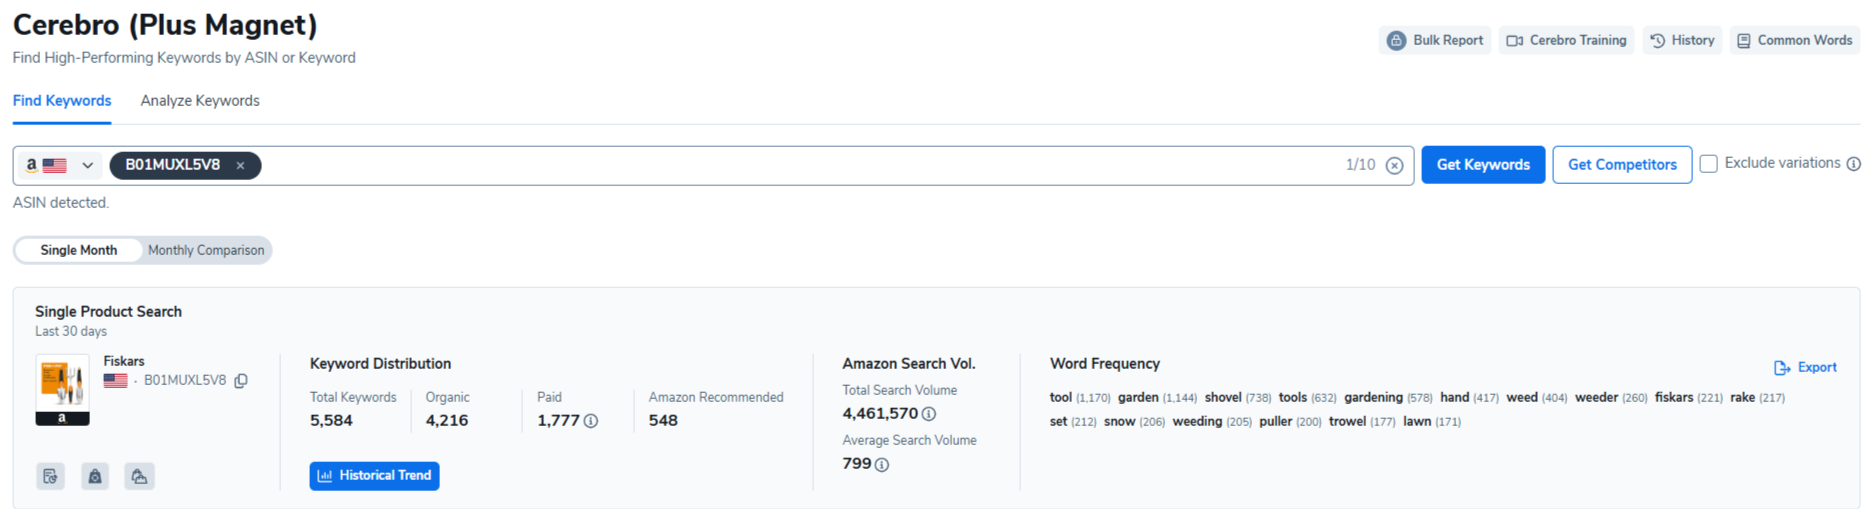
Cerebro is the most advanced Amazon keyword research tool on the market. Enter a competitor's ASIN, and Cerebro returns a complete keyword profile with search volume, organic and sponsored rank positions, the proprietary IQ Score, word frequency analysis, and top 10 title density. The IQ Score is particularly useful: a high score means strong search volume with low competition.
Magnet complements Cerebro by expanding seed keywords into comprehensive lists with monthly search volume data, trending direction, and related keyword suggestions. Both tools update their data daily.
Jungle Scout: Keyword Scout
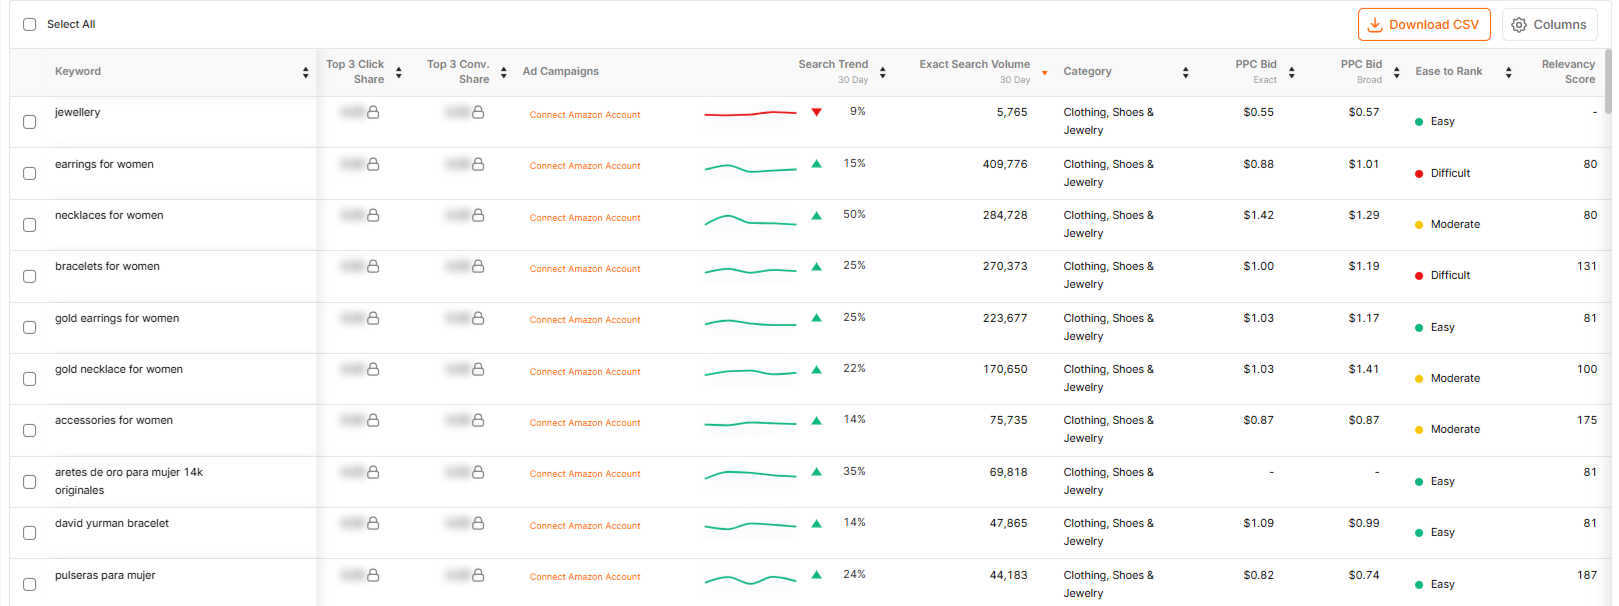
Keyword Scout provides keyword research through seed keywords or ASIN-based reverse lookup (up to 10 ASINs). You get estimated monthly searches, trend direction (up, down, or flat), competition level, and an Opportunity Score that combines volume and competition into a single metric.
Keyword Scout also shows top advertisers bidding on each keyword and provides PPC cost estimates. For sellers running or planning sponsored campaigns, this advertising context is immediately actionable. The trade-off is that Keyword Scout does not offer the same depth of filtering or the granular distribution data that Cerebro provides.
Our Verdict: Helium 10 wins. Cerebro and Magnet together represent the gold standard for Amazon keyword research. The IQ Score, daily data updates, and advanced filtering options give experienced sellers tools that Keyword Scout cannot match in raw depth. That said, Keyword Scout's simpler approach with the built-in Opportunity Score works perfectly for sellers who want actionable data without a steep learning curve.
Complementary approach: SmartScout's Keyword Detective and Search Terms Relevancy tools answer a different question than Cerebro or Keyword Scout. Instead of just showing search volume, they map the relevancy and intent behind search terms at the product and category level. Sellers who want to understand why customers search for certain products, not just how often, find this layer of context invaluable for PPC targeting and listing strategy.
3. Listing Optimization
Helium 10: Scribbles and Listing Builder
Helium 10 approaches listing optimization as a two-step process. Scribbles analyzes keyword distribution across your listing components, showing where important keywords are missing from your title, bullets, description, and backend search terms. The Listing Builder then uses ChatGPT integration to generate optimized copy for each section.
For existing listings, Helium 10 provides green and red health indicators highlighting sections that need attention. The combination is powerful for sellers who already have products live and want to improve their organic rankings.
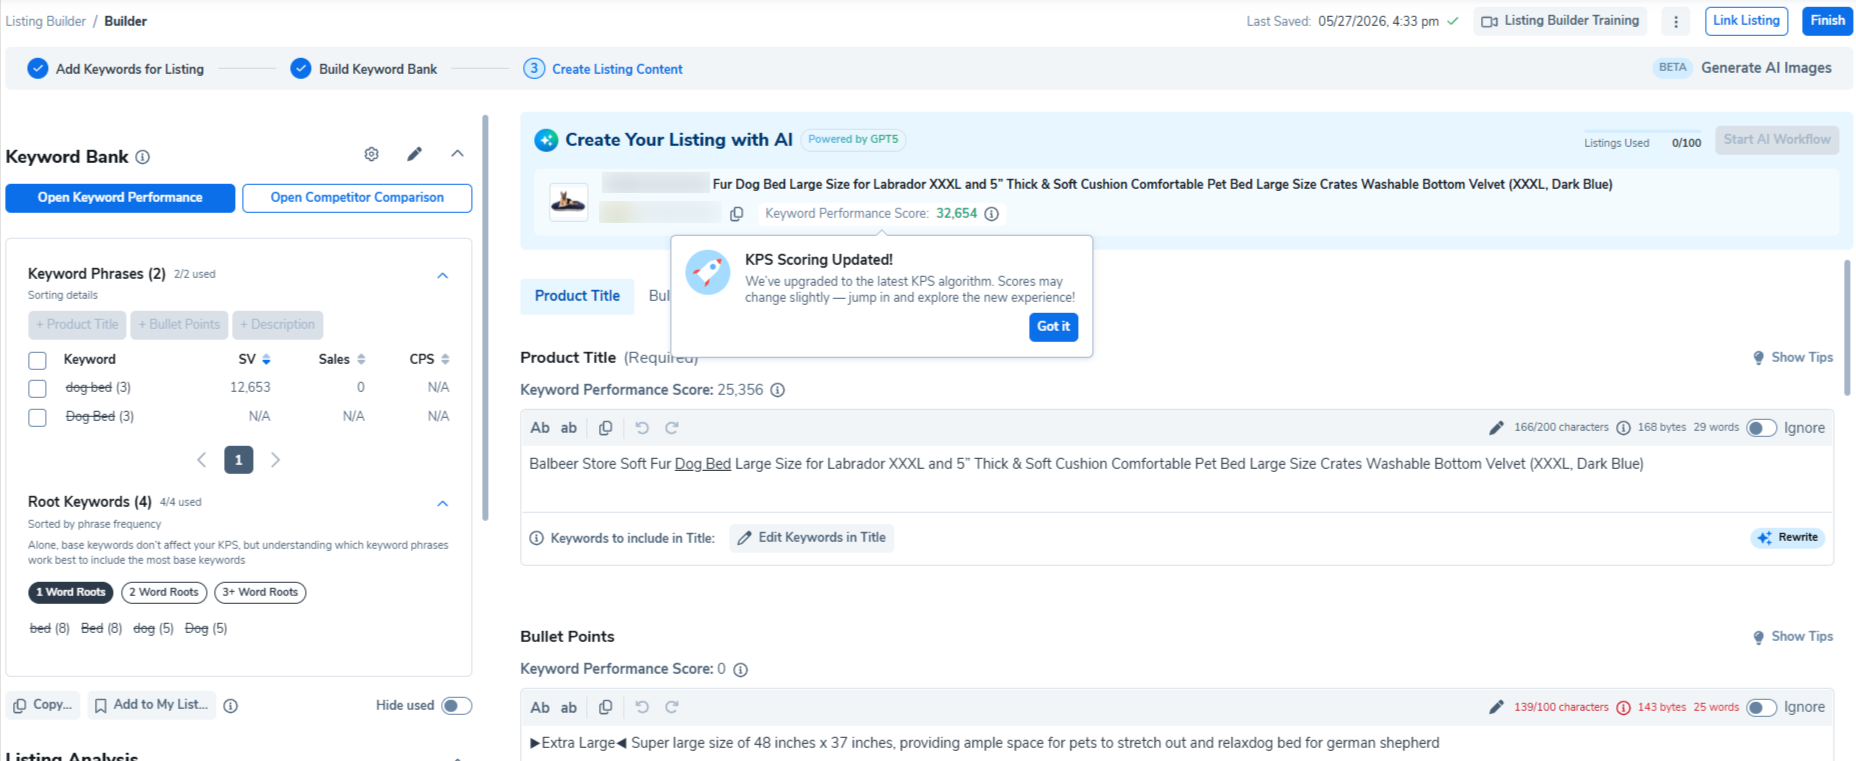
Jungle Scout: Listing Builder with AI Assist
Jungle Scout's Listing Builder pulls keywords from Keyword Scout and uses AI Assist to generate titles, bullet points, descriptions, and backend terms. The AI has improved significantly through 2025 and into 2026, now offering customer sentiment analysis and copy improvement suggestions.
One advantage Jungle Scout holds here is that AI Assist works for creating listings from scratch. You do not need an existing listing to optimize. For new product launches, you can go from keyword research to a fully drafted listing in minutes. Helium 10's Scribbles, by contrast, focuses primarily on optimizing existing listings.
Our Verdict: Tie. Helium 10 has the edge for optimizing existing listings with its detailed keyword distribution analysis and health scoring. Jungle Scout has the edge for creating new listings from scratch with AI Assist. Both platforms get the job done.
Related: SmartScout'sAI Listing Architect creates listings that combine keyword data with competitive positioning insights from SmartScout's brand and subcategory intelligence, giving your copy a strategic angle that standalone listing builders miss.
4. PPC Management
Helium 10: Adtomic (Helium 10 Ads)
Adtomic is a full-featured PPC management platform with AI-driven bid optimization, campaign structuring, budget guardrails, dayparting, and performance tracking. It integrates with Cerebro's keyword data to align targeting with search demand.
There is a catch, though. Adtomic is only fully included with the Diamond plan ($359/month). Platinum users can access basic ad features but not the full automation suite. On top of the subscription, Helium 10 charges a 2% management fee on all PPC spend managed through the platform. For sellers spending $10,000 per month on ads, that is an extra $200 in fees.
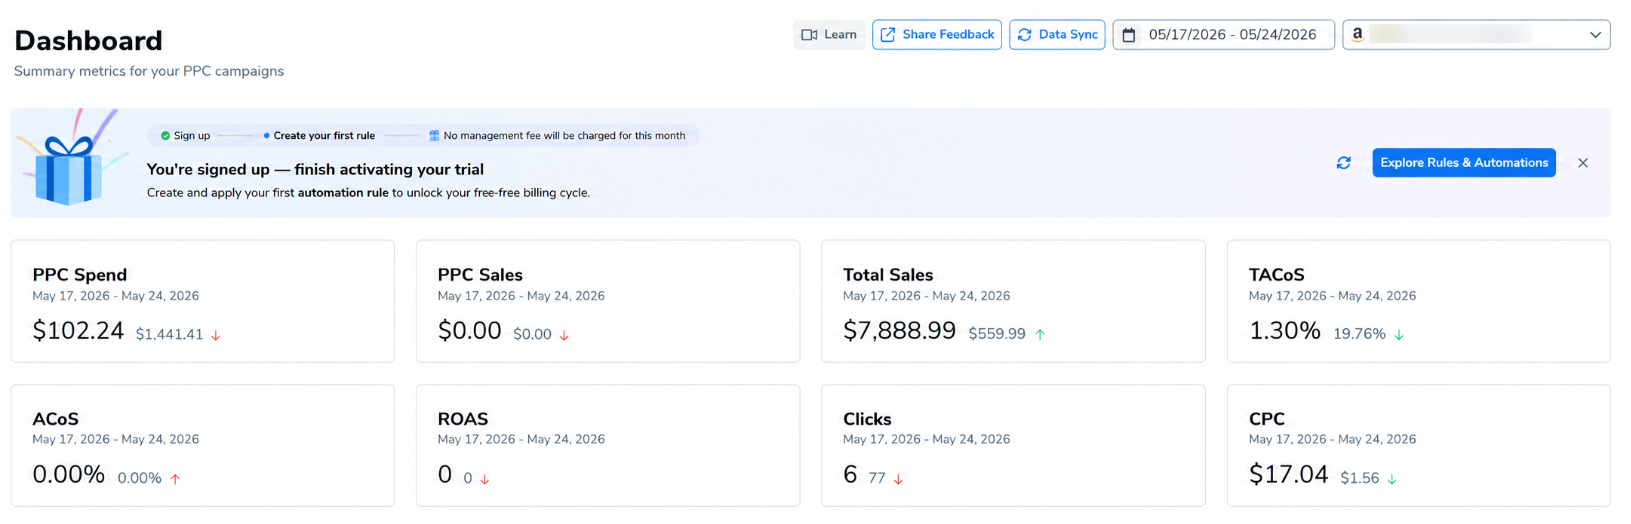
Jungle Scout: Advertising Analytics
Jungle Scout offers Advertising Analytics on Growth Accelerator plans and above. It provides campaign performance tracking, keyword-level ad data, and spending breakdowns. For enterprise brands, Jungle Scout Cobalt's Ad Accelerator adds rule-based bid automation, dayparting, and multi-account management.
The standard Catalyst plans focus on analytics and reporting rather than automated campaign management. If you want hands-off PPC optimization comparable to Adtomic, you need Cobalt's enterprise pricing.
Our Verdict: Helium 10 wins for PPC automation. Adtomic is the more mature and feature-complete PPC tool, and it is available at the Diamond tier without needing a custom enterprise quote. Jungle Scout's advertising analytics are useful for monitoring, but serious PPC management requires either manual work or upgrading to Cobalt.
PPC intelligence gap: Neither Adtomic nor Jungle Scout's Advertising Analytics shows you what your competitors are actually doing with their ad spend. SmartScout's Ad Spy fills that gap by revealing competitor keyword bidding patterns, estimated ad spend, and campaign structures. Understanding the competitive ad landscape before you set up campaigns makes every dollar you spend on Adtomic or any PPC tool more effective. Learn how to build a repeatable competitor analysis workflow.
5. Supplier Sourcing
Helium 10: Supplier Finder
Helium 10's Supplier Finder is a Chrome extension feature that shows supplier information when you browse Alibaba.
You can filter by price, minimum order quantity, and ratings. It is convenient for quick lookups, but it only covers Alibaba. There is no global supplier database, no shipment history data, and no way to vet suppliers within the Helium 10 platform itself.
Jungle Scout: Supplier Database
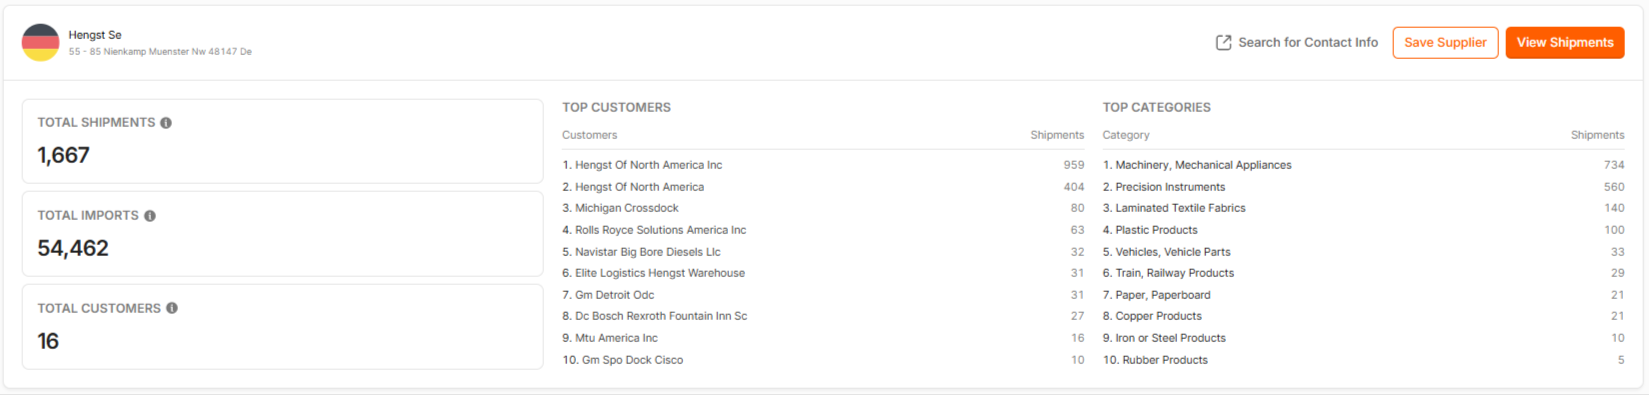
The Supplier Database is one of Jungle Scout's standout features. It gives you access to import records for a reported 98% of Amazon sellers. You can search by product, brand, or supplier name and see exactly which manufacturers are supplying which products, along with shipment volumes, pricing, and the identity of top US customers.
This level of sourcing intelligence is invaluable for sellers who want to verify a supplier's legitimacy before placing orders. No other mainstream Amazon tool provides this depth of supplier intelligence within its standard plans.
Our Verdict: Jungle Scout wins convincingly. The Supplier Database is a genuine competitive advantage that goes far beyond Helium 10's Alibaba-only extension. For any seller who sources products from manufacturers, this single feature can justify the Jungle Scout subscription.
6. Brand and Market Intelligence
This is where both Helium 10 and Jungle Scout share a significant blind spot.
Helium 10's Market Tracker monitors competitor ASINs and tracks market share changes at the product level.
It is useful for keeping an eye on specific competitors, but it does not provide brand-wide revenue estimates, seller dynamics, or category-level competitive intelligence.
Jungle Scout's Brand Owner + CI plan ($149/month) includes competitive benchmarking and market share analysis.
Cobalt takes this further with enterprise-level intelligence. But even at these higher tiers, neither tool maps entire brand ecosystems, provides a proprietary brand health score, or visualizes how customer traffic flows between related products.
For wholesale buyers deciding which brands to approach, online arbitrage sellers evaluating seller density, or agencies pitching potential clients, product-level data alone is not enough. You need to understand brand-level dynamics: revenue distribution, seller count trends, Amazon's own in-stock rate, and competitive positioning across subcategories.
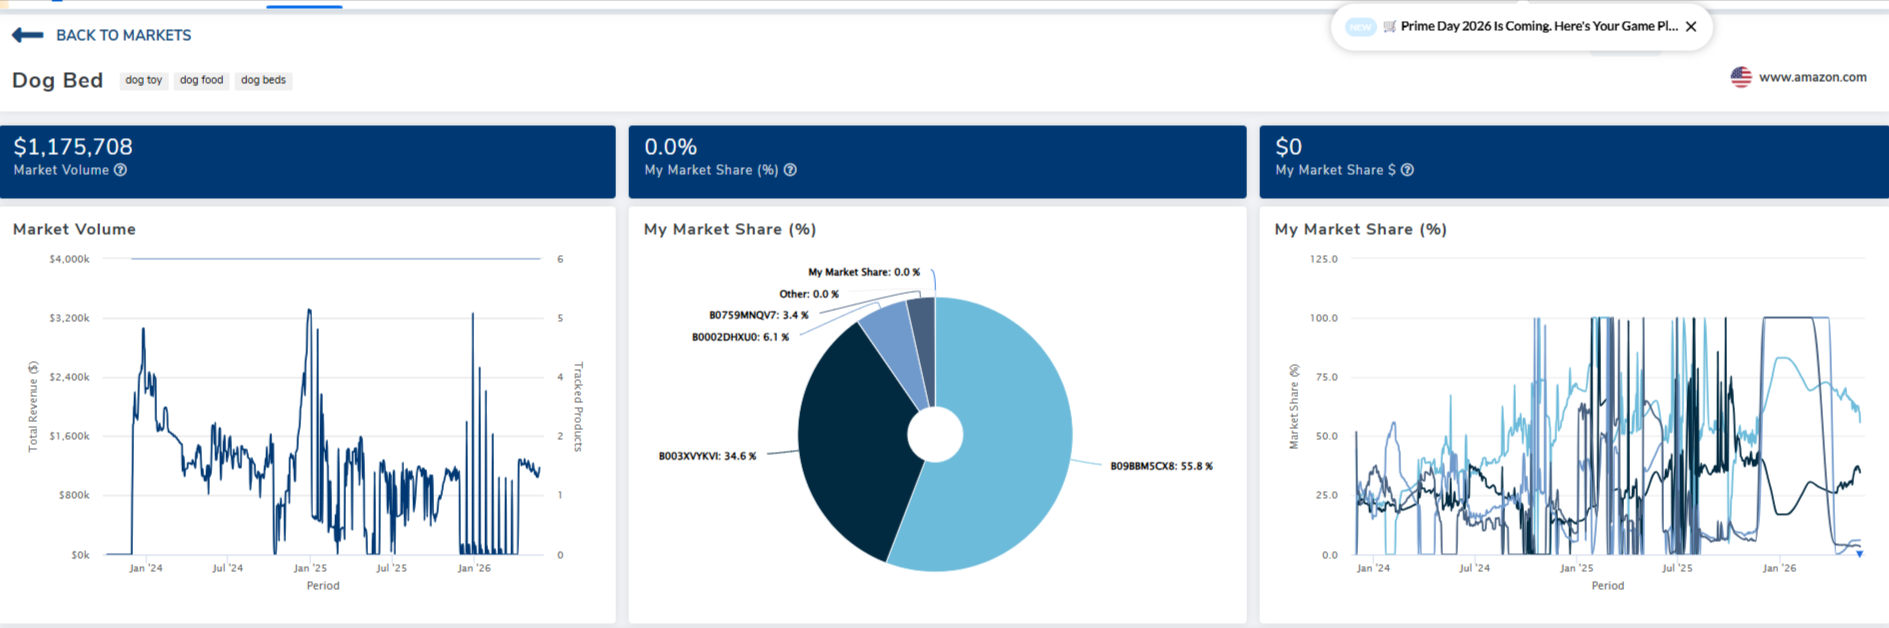
This is SmartScout's core strength. The Brand Database lets you filter through 1.5 million+ Amazon brands using 30+ parameters. The Traffic Graph visualizes how customer traffic flows between products. The Seller Map shows you exactly where Amazon sellers are located, what they sell, and how much revenue they generate. No other Amazon tool, including Helium 10 and Jungle Scout, provides this level of market intelligence. Explore the full Amazon software comparison to see where each tool fits.
7. Review Automation
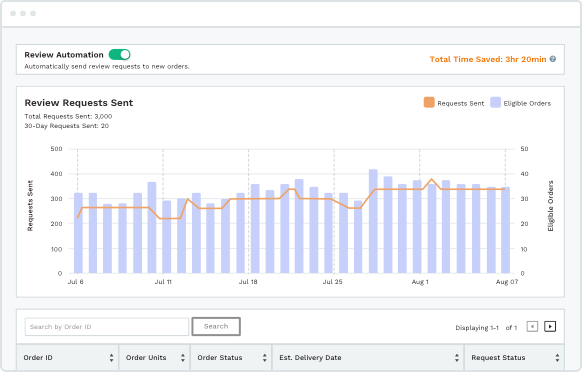
Jungle Scout includes automated review request functionality on Growth Accelerator plans and above. You can set up automated requests that follow Amazon's Terms of Service, helping you build social proof faster without manual effort.
Helium 10 does not have a built-in review automation tool. Sellers using Helium 10 need to request reviews manually through Seller Central or use a third-party service, which adds cost and complexity.
Our Verdict: Jungle Scout wins. Review automation is a core operational feature for Amazon sellers, and having it built into the platform saves both time and money. The absence of this feature in Helium 10 is a notable gap.
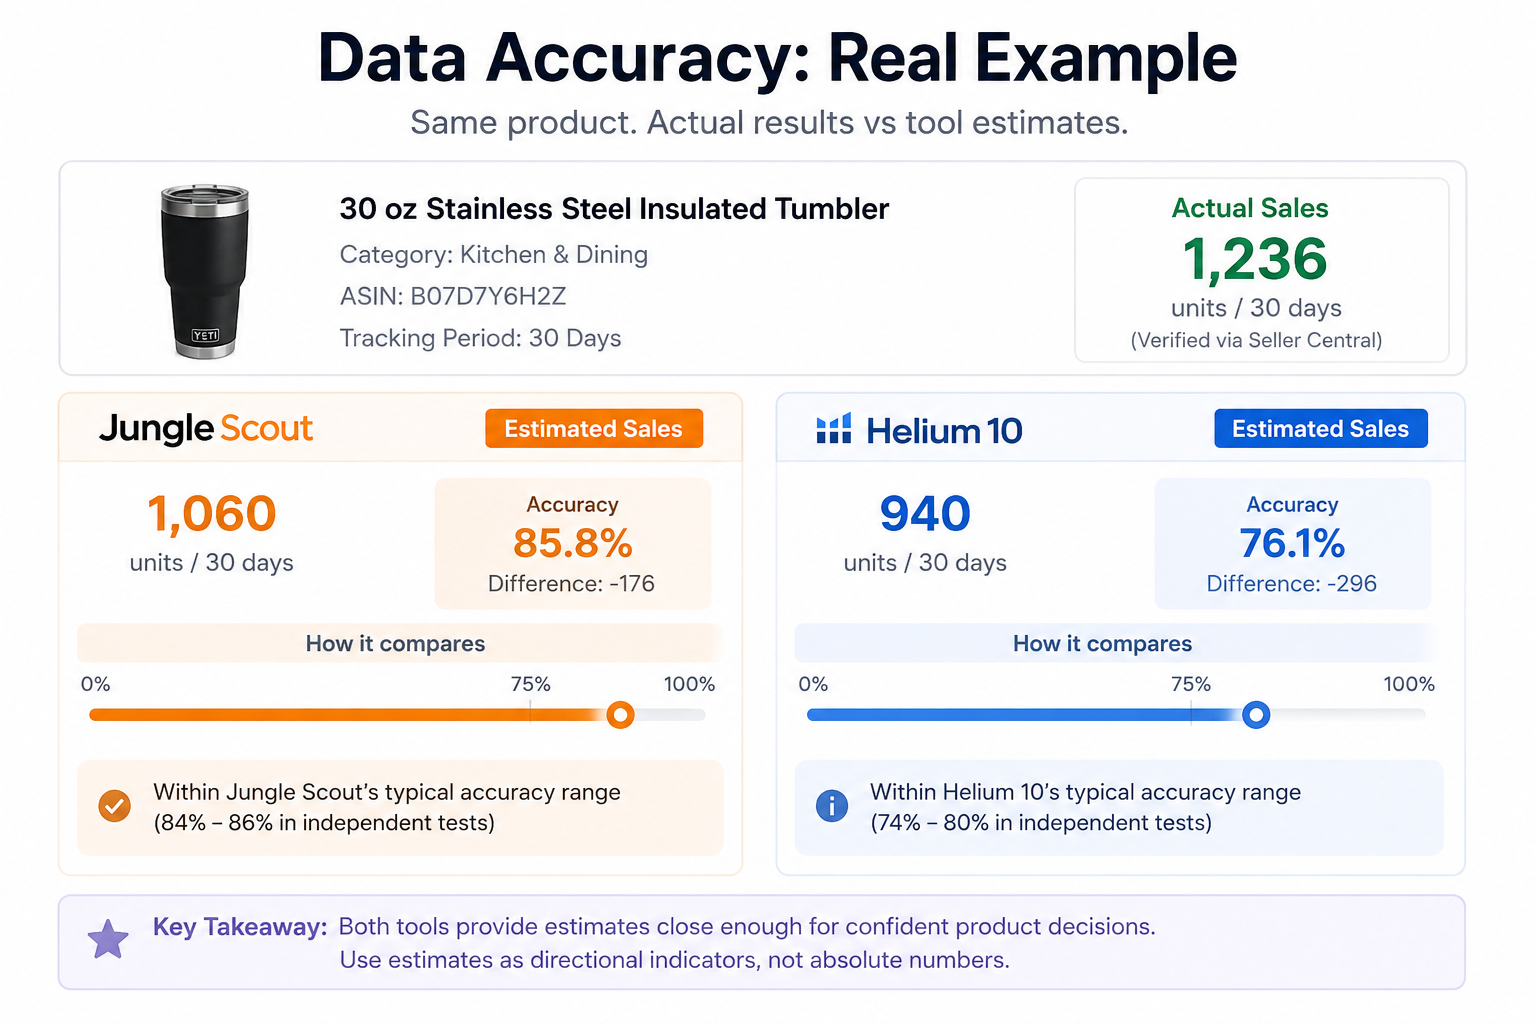
8. Data Accuracy
Accuracy is the most debated topic in every Helium 10 vs Jungle Scout comparison, and both platforms claim to be the most accurate. Here is what the independent testing actually shows.
Jungle Scout's own study claims 84% accuracy in sales estimation, placing itself first among all Amazon tools. Independent reviewers have largely confirmed this range, with most tests landing between 84% and 86%. Jungle Scout's 11 years of historical data and variation-level tracking contribute to consistently reliable estimates.
Helium 10's accuracy is more contested. Helium 10's own research claims 93.5% accuracy for normalized keyword search volume. Independent testers report sales estimation accuracy between 74% and 80%, depending on the product category and testing methodology.
The reality is that both tools provide estimates sufficient for product validation and business decisions. Neither is perfectly accurate, and treating any tool's estimates as gospel is a mistake. The smarter approach is to use estimates as directional indicators and validate with real sales data.
Our Verdict: Jungle Scout has a slight edge in overall sales estimation accuracy based on the weight of independent testing. Helium 10 has an edge in keyword search volume precision. In practice, both are reliable enough that accuracy alone should not be your deciding factor.
Related: SmartScout publishes transparent accuracy data. See how their estimates compare in the SmartScout Accuracy report.
9. Chrome Extension
Jungle Scout's Chrome Extension is available as a free standalone tool with limited functionality and as a full version included with all Catalyst plans.
It works on both Chrome and Firefox browsers. The extension provides sales estimates, BSR data, revenue figures, and basic competitive metrics directly on Amazon product pages.
Helium 10's Xray Chrome Extension is included with paid plans and provides more data points per product: estimated net profit, inventory stock levels, exact star rating breakdowns, and supplier lookup. However, it only works on Chrome.
Our Verdict: Tie with different strengths. Jungle Scout wins on browser compatibility (Chrome + Firefox) and free access. Helium 10 wins on data density per product page.
Worth noting: SmartScout also offers a free Chrome extension with 1,000 uses per month. It includes an FBA calculator with 2026 fee rates, BSR tracking, seller analytics, and a product opportunity score. No subscription required.
10. AI Tools
Both platforms invested heavily in AI features throughout 2025 and into 2026.
Helium 10 integrates ChatGPT into its Listing Builder and offers an AI-powered chat assistant within the dashboard. The AI also powers parts of Adtomic's bid optimization engine.
Jungle Scout's AI Assist covers four areas: sales analytics (automated performance insights), review analysis (customer sentiment extraction), listing building (SEO-optimized copy generation), and an always-on Q&A chat.
The integration is tighter across the platform, with AI recommendations surfacing naturally within each tool's workflow.
Our Verdict: Jungle Scout has a slight edge. AI Assist is more deeply integrated across the platform and covers more functional areas (especially review sentiment analysis and sales analytics). Helium 10's ChatGPT-powered listing builder is strong, but its AI features feel more bolted-on than natively integrated.
11. Customer Support and Training
Customer support quality has become a real differentiator between these two platforms in 2026.
Jungle Scout holds a 4.2 rating on Trustpilot with over 3,900 reviews. Users consistently praise the responsive live chat, helpful email support, and the quality of the Jungle Scout Academy training modules. The company responds to 92% of negative reviews within a week.
Helium 10's Trustpilot ratings are around 2.3, with the most recent scores trending lower. Common complaints include difficulty canceling subscriptions, being charged after cancellation, and slow support response times.
The Selling Guys, a well-known Amazon seller review site, reduced their Helium 10 rating from 4.8 to 4.3 in early 2026 specifically due to customer service issues and price increases. The Freedom Ticket course by Kevin King remains excellent, but it does not offset the operational support issues.
Our Verdict: Jungle Scout wins clearly. The gap in user satisfaction scores is too large to ignore. Helium 10's Freedom Ticket is a valuable training resource, but customer support quality matters when you are paying $129 to $359 per month and encounter issues.
Pricing changed significantly for both tools in 2026. Here is what you actually pay today.
Helium 10 Plans
Plan
Monthly
Annual (per month)
Platinum
$129/mo
$99/mo
Diamond
$359/mo
$279/mo
Enterprise
Custom
Custom
Helium 10 also offers a free plan with heavily restricted access. The Starter plan ($39 to $49/month) was retired in early 2026 for new users. Adtomic's full PPC automation requires the Diamond plan. A 2% ad management fee applies on top of the subscription for PPC spend managed through the platform.
Jungle Scout Catalyst Plans
Plan
Monthly
Annual (per month)
Starter
$49/mo
$29/mo
Growth Accelerator
$79/mo
$49/mo
Brand Owner + CI
$149/mo
$129/mo
Cobalt (Enterprise)
Custom
Custom
All Catalyst plans include a 7-day money-back guarantee. The Growth Accelerator plan is widely considered the best value, unlocking the Supplier Database, Review Automation, Inventory Manager, and Advertising Analytics at $79/month (or $49/month billed annually).
Our Verdict: Jungle Scout is significantly more affordable at every tier. Jungle Scout's Growth Accelerator at $49/month (annual) includes features that Helium 10 locks behind the $279/month Diamond plan. Even Jungle Scout's top-tier Brand Owner + CI plan ($129/month annual) costs less than Helium 10's entry-level Platinum at $129/month.
Budget tip: SmartScout's Basic plan starts at $29/month, and the Essentials plan ($97/month) includes brand analytics, Seller Map, and Traffic Graph. A seller running SmartScout Essentials ($75/month annual) and Jungle Scout Growth Accelerator ($49/month annual) pays just $124/month total, which is less than Helium 10 Platinum alone. That combination gives you market intelligence, product research, supplier sourcing, and review automation. See SmartScout pricing for full plan details.
By this point, the pattern should be clear: neither platform is objectively better than the other. Helium 10 offers greater depth, automation, and marketplace coverage, while Jungle Scout prioritizes simplicity, affordability, and product discovery. Here's a quick look at where each platform shines and where it falls short.
Pros and Cons of Helium 10
Pros
Industry-leading keyword research with Cerebro and Magnet
Advanced PPC automation through Adtomic
Supports Amazon, Walmart, and TikTok Shop
Extensive suite of tools for scaling businesses
Includes Freedom Ticket training for paid users
Cons
Significantly more expensive than Jungle Scout
Steeper learning curve due to the large number of tools
Some advanced features require higher-tier plans
Customer support receives mixed reviews from users
Limited supplier intelligence compared to Jungle Scout
Pros and Cons of Jungle Scout
Pros
Beginner-friendly interface and workflows
Strong product research and validation tools
Best-in-class Supplier Database
Built-in review automation and inventory management
More affordable pricing across all tiers
Cons
Less advanced keyword research than Helium 10
PPC tools focus more on analytics than automation
Amazon-focused with no Walmart or TikTok Shop support
Fewer advanced optimization features for large sellers
Limited competitive intelligence compared to specialized Amazon research platforms
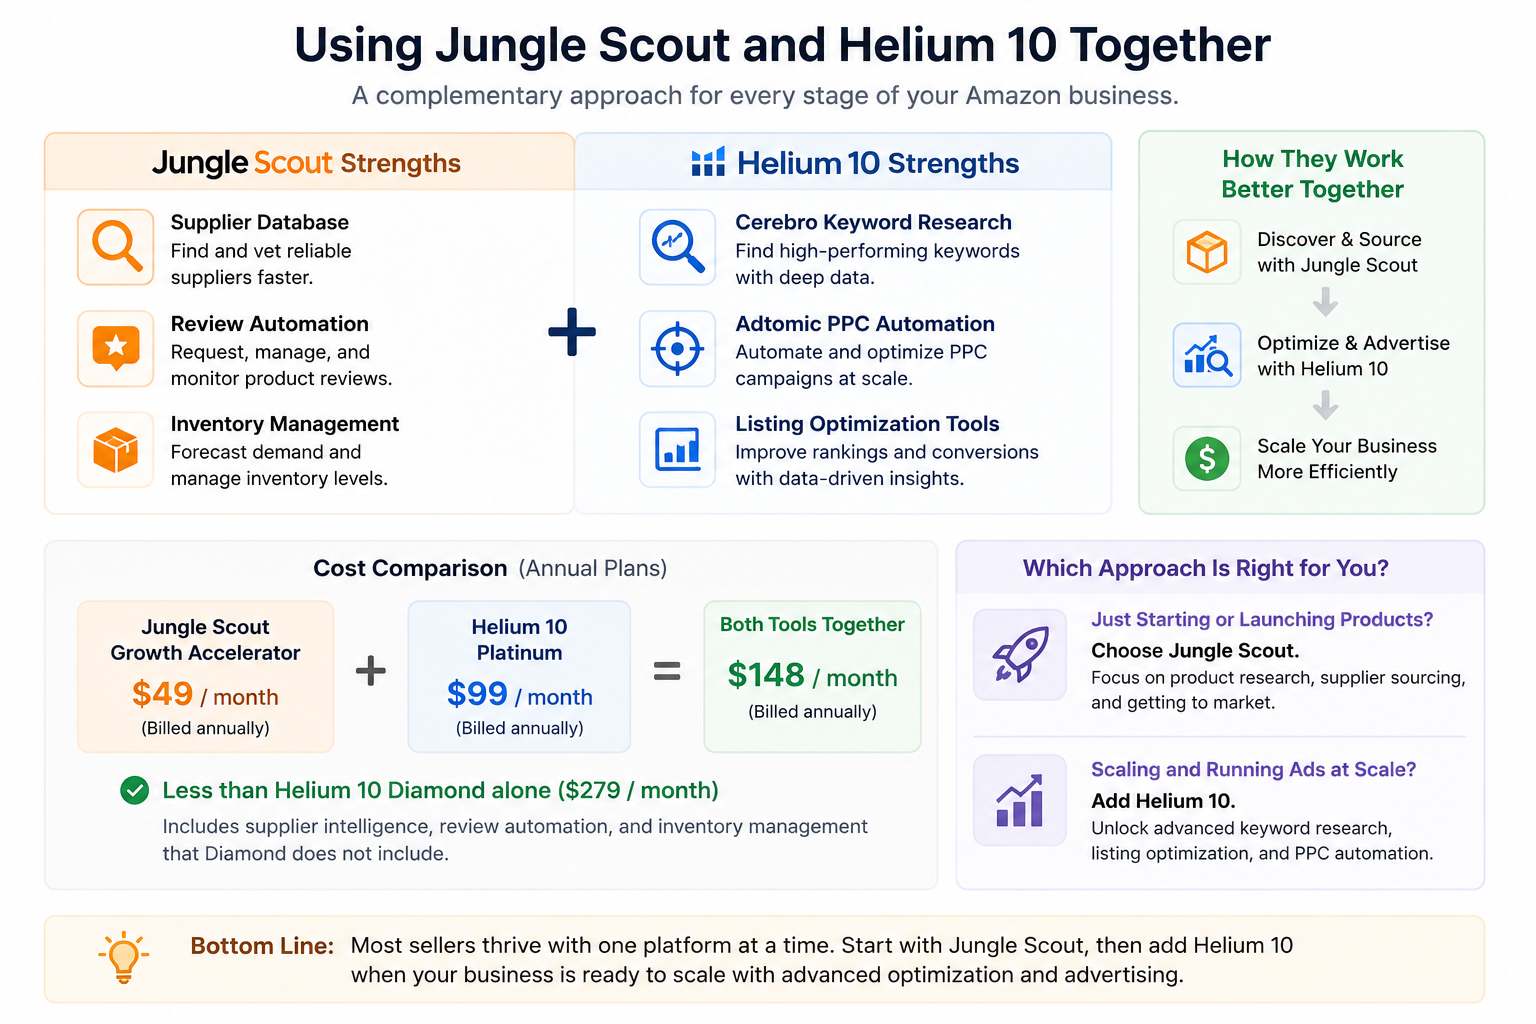
Can You Use Helium 10 and Jungle Scout Together?
Some sellers run both tools simultaneously, and it is not as redundant as it sounds.
The strongest case for using both is pairing Jungle Scout's Supplier Database and Review Automation with Helium 10's Cerebro keyword research and Adtomic PPC automation. Jungle Scout handles the product discovery and sourcing phase, while Helium 10 handles the optimization and advertising phase.
The combined cost of Jungle Scout Growth Accelerator ($49/month annual) and Helium 10 Platinum ($99/month annual) comes to $148/month. That is still less than Helium 10 Diamond alone ($279/month annual), and you get supplier intelligence, review automation, and inventory management that Diamond does not include.
For most sellers, though, choosing one platform is the pragmatic move. Pick Jungle Scout if you are still in the product research and launch phase. Add Helium 10 when your business demands advanced keyword optimization and PPC automation at scale.
The Complete Amazon Seller Stack: Filling the Gaps
Helium 10 and Jungle Scout both excel at product-level operations (keyword research, listing optimization, PPC management, supplier sourcing), but neither provides the market intelligence layer that separates good product decisions from great ones.
Here’s what most sellers do:
Market intelligence (brand analytics, subcategory revenue, seller mapping, traffic flow) for deciding WHERE to compete
Product research and validation (product databases, keyword research, demand estimation) for deciding WHAT to sell
Operational optimization (listing SEO, PPC automation, review management, inventory tracking) for deciding HOW to sell better
Helium 10 and Jungle Scout both cover the second and third layers exceptionally well. They also offer limited market-level visibility through tools such as Market Tracker and Jungle Scout's Market Intelligence capabilities.
The distinction is that these features are primarily designed to monitor products and competitors you already know about. They are less focused on exploring entire categories, evaluating brand ecosystems, mapping seller networks, or identifying market opportunities before product research begins.
However, Helium 10’s market intelligence tool comes as an add-on, whereas Jungle Scout’s unlocks when you go for the highest-tier plan.
SmartScout fills the market intelligence gap at a lower cost. The Subcategories tool maps 40,000+ niches with revenue data. The Brand Database filters 1.5M+ brands by 30+ parameters. The Traffic Graph reveals product relationships and ad targeting opportunities. The Seller Map shows geographic seller distribution worldwide. And the Ad Spy exposes competitor advertising strategies. None of these capabilities exist in Helium 10 or Jungle Scout at any price tier. Book a free SmartScout demo to see how it complements your existing toolkit.
Conclusion: Jungle Scout for Getting Started, Helium 10 for Scaling Up
After testing both platforms extensively, the pattern is clear: these tools serve different stages of the Amazon selling journey.
Jungle Scout Catalyst is the stronger choice for sellers who are finding products, validating demand, sourcing suppliers, launching listings, and building review momentum. The Opportunity Finder, Supplier Database, and Review Automation create a cohesive workflow that takes you from idea to live product with minimal friction. The pricing is fair, the interface is clean, and the customer support is consistently excellent.
Helium 10 is the stronger choice for sellers who have established products and want to maximize their performance. Cerebro's keyword depth, Adtomic's PPC automation, and the multi-marketplace support (Amazon + Walmart + TikTok Shop) give scaling sellers tools that Jungle Scout does not match. The pricing is steep, the learning curve is real, and the support could be better, but the raw capability is undeniable.
If budget forces a single choice: pick Jungle Scout if you are a beginner want to scale on Amazon, and consider Helium 10 when you are a high-end seller and need deeper optimization firepower.
SmartScout offers the capability of both Helium 10 and Jungle Scout at a fraction of the cost. Additionally, you get exceptional features like AI Listing Architect, Traffic Graph, Seller Map, and access to 40K categories, at a starting price of $29/month. New users can start with a risk-free 7-day money-back guarantee.
TikTok Shop crossed $64.3 billion in global GMV in 2025. Social commerce in the US alone is on pace to surpass $100 billion by the end of this year. These are not speculative projections. This is where buyer attention is moving, and the sellers who are winning on TikTok Shop right now share one thing in common: they stopped guessing before everybody else did.
TikTok's commerce engine moves fast enough to break manual research. A product can go from zero to 50,000 units in a week off one viral video, and by the time you spot it, the market is saturated, and margins have collapsed. Views and follower counts say nothing about actual purchases, and Seller Center only shows your own store. You get no read on what competitors are doing or which categories are heating up.
That blind spot is what we built SmartScout TikTok Shop Analytics to close. It brings the category-first approach behind our Amazon Subcategories and Brand Database tools to TikTok Shop, mapping the market before you commit to a product.
To set the context, we tested the top platforms in this space across product research, category intelligence, competitor analysis, creator attribution, and ad tracking, and ranked them on the depth of actionable data they actually deliver.
9 Best TikTok Shop Analytics Tools for Product & Category Research
Here is how the nine platforms stack up at a glance, from category-level market intelligence down to single-purpose ad and own-shop tools, before we break each one down in detail below.
Tool
Key Data Points
Strongest For
Free Trial
Starting Price
SmartScout
Category, shop, product, creator, trend
Category-level market intelligence
Coming soon
$29/mo
Kalodata
Product, creator, video, shop, livestream
Product discovery + creator attribution
Yes (7 days)
$49.99/mo
FastMoss
Product, shop, ad, live, creator
Enterprise monitoring + live commerce
Yes (7 days)
$29/mo
Helium 10
Listing converter, profitability, influencer
Amazon-to-TikTok expansion
Free plan (limited)
$129/mo
EchoTik
Product, creator, shop, live (Chrome ext.)
Free research for beginners
Free plan
$13.9/mo
Shoplus
Product, trend, creator, shop
Budget product research
Free tier
$49/mo
PiPiADS
Ad creatives, product discovery via ads
TikTok ad creative intelligence
Trial available
$49/mo
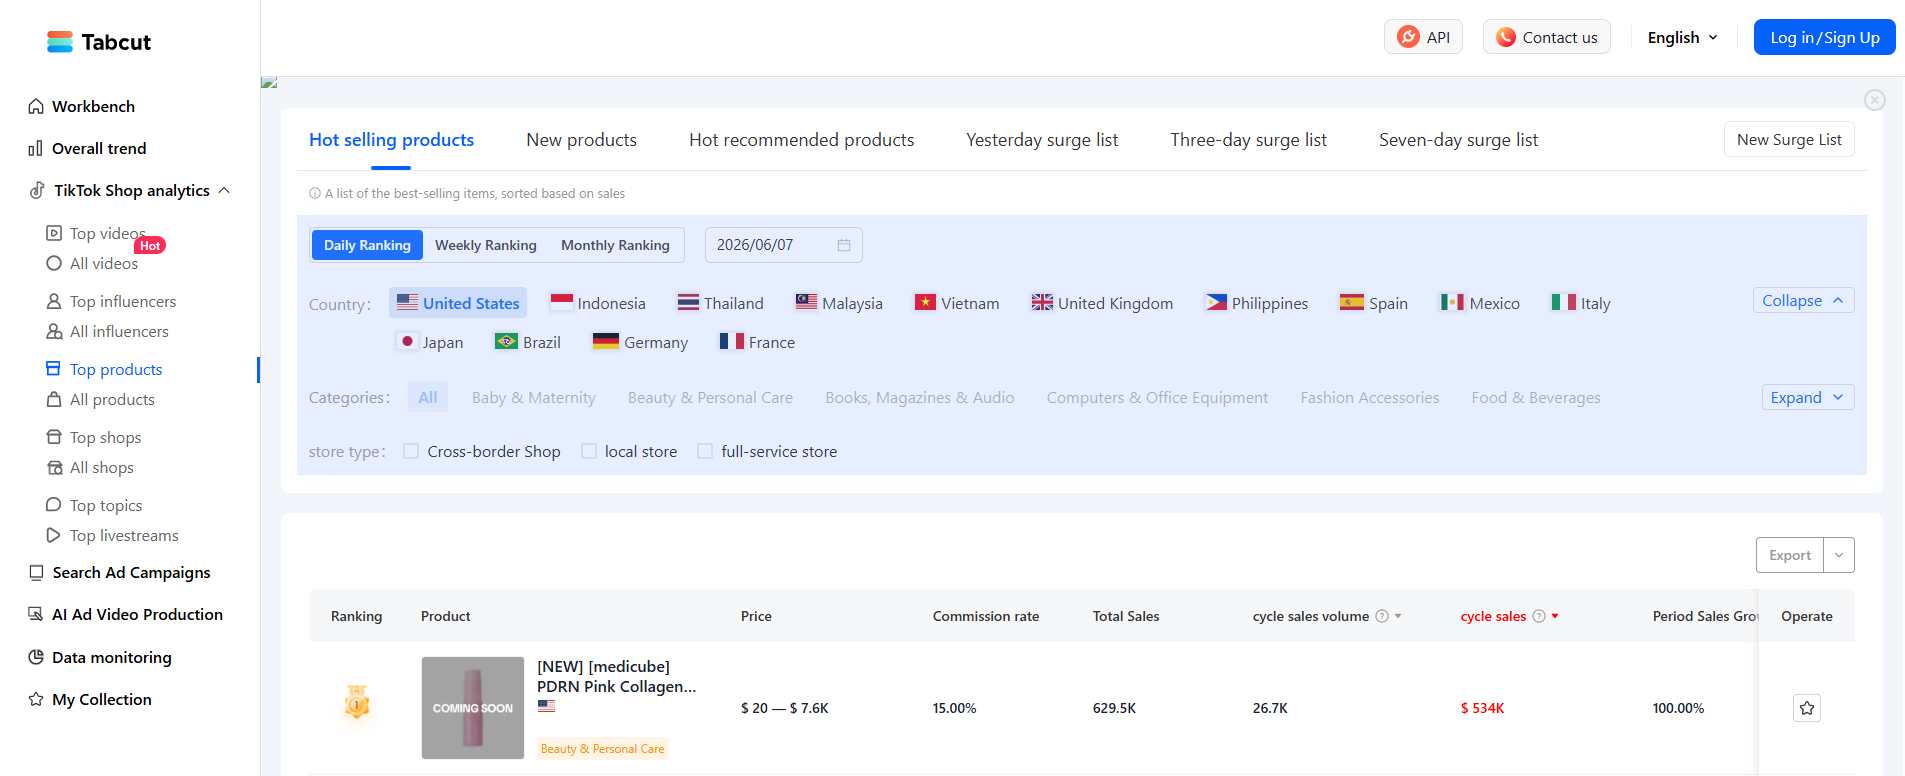
Tabcut
Product, shop, category, API
API access for custom reporting
Free plan
$59/mo
TikTok Seller Center
Own shop: orders, revenue, fulfillment
Your own store analytics
Free
Free
Not sure which of these fits your stage and budget? Answer a few quick questions below, and we'll point you to the tool (or stack) that matches how you actually run your TikTok Shop business, from first product test to full agency monitoring.
Implement the tool (check tab 2 for the tool’s HTML code)
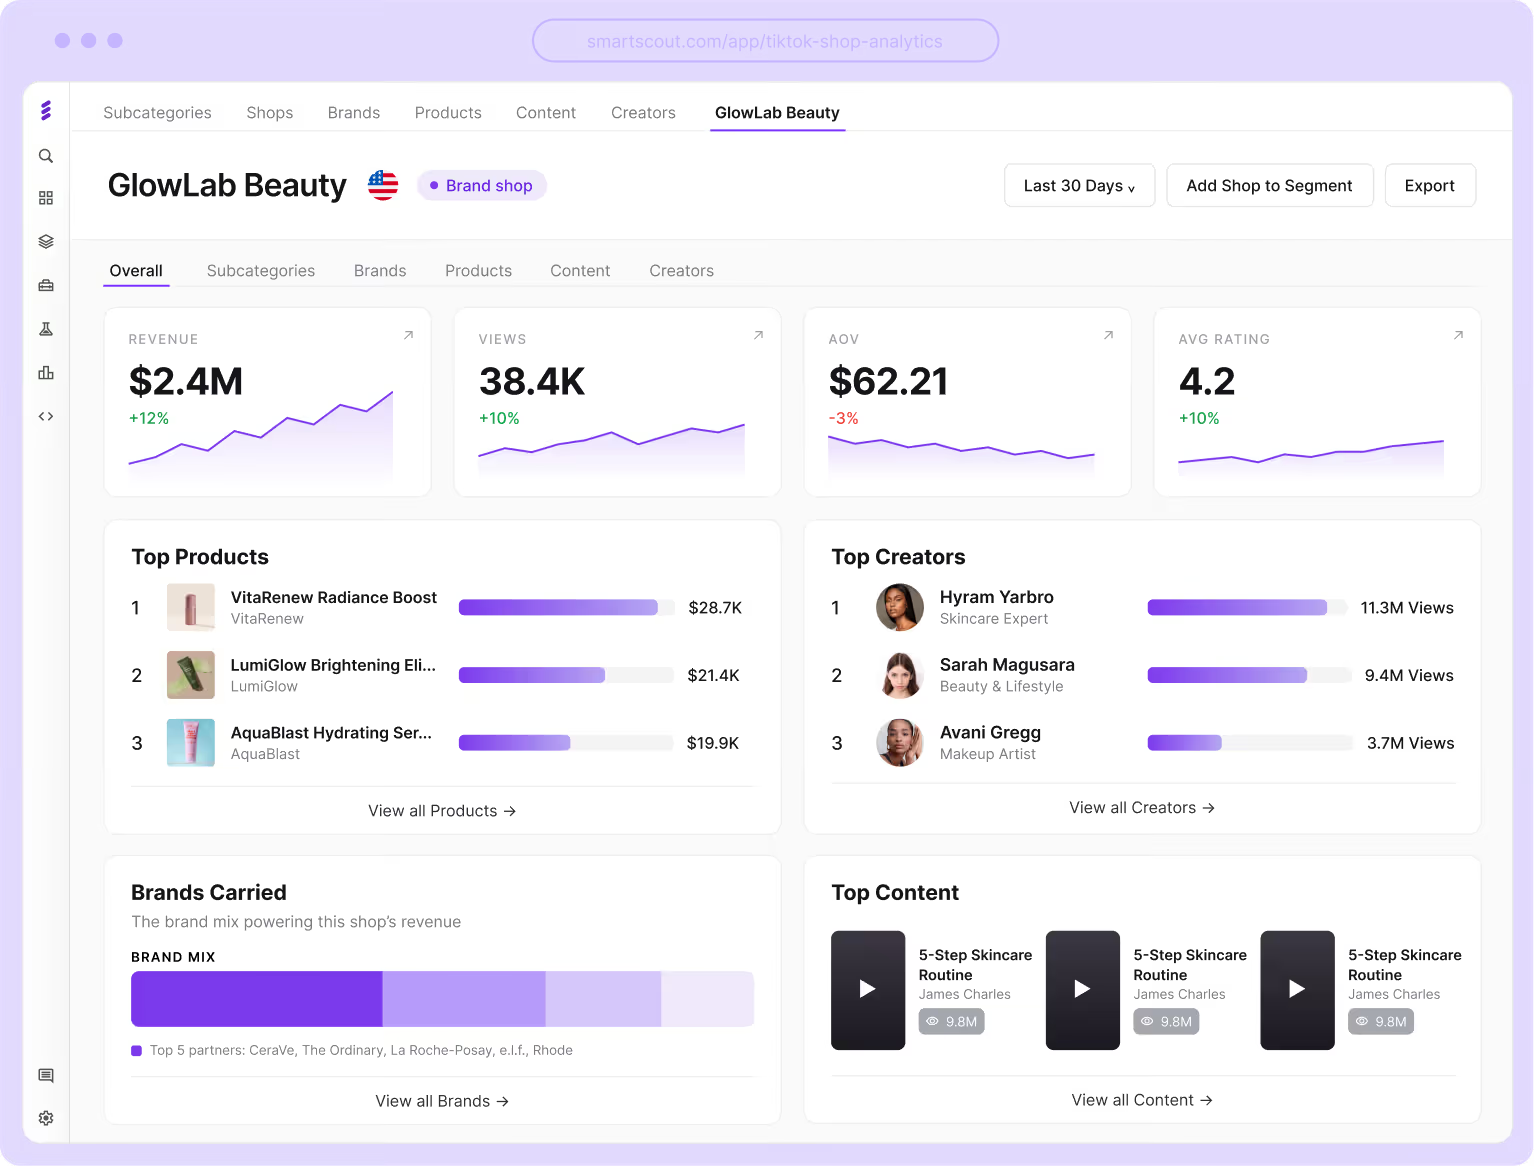
1. SmartScout: Best for TikTok Shop Category Analysis and Market Intelligence
Parameter
Details
Tool name
SmartScout TikTok Shop Analytics
Standout feature
White-space opportunity finder that identifies underserved TikTok Shop categories by revenue, competition density, and growth rate
Data source
Proprietary algorithms processing TikTok Shop category, shop, product, creator, and video data (same engine behind SmartScout's Amazon analytics)
Starting price
$29/month (existing plans). TikTok-specific pricing at launch.
Free trial/plan
7-day money-back guarantee on all plans. Early access registration open.
Every other tool on this list starts the same way: type in a keyword or browse a list of trending products. That workflow answers one question: what is selling on TikTok right now? It does not tell you whether the category behind that product is growing or contracting. It does not tell you whether three shops control 80% of the revenue or whether the market is fragmented enough for a new entrant. And it definitely does not tell you whether the trend you spotted yesterday will still exist next month.
SmartScout is building something fundamentally different for TikTok Shop. Instead of starting with products, it starts with the market structure itself. If you have used SmartScout for Amazon, the philosophy is identical to what the Subcategories tool and Brand Database already do: map the landscape first, then decide where to compete.
What SmartScout TikTok Analytics will offer
The Category Analysis module is the flagship. It will provide revenue estimates for TikTok Shop categories, market share breakdowns by the top shops in each category, product concentration metrics, and a white-space opportunity finder that flags niches where demand outpaces supply. No other TikTok analytics tool currently offers this kind of category-level intelligence.
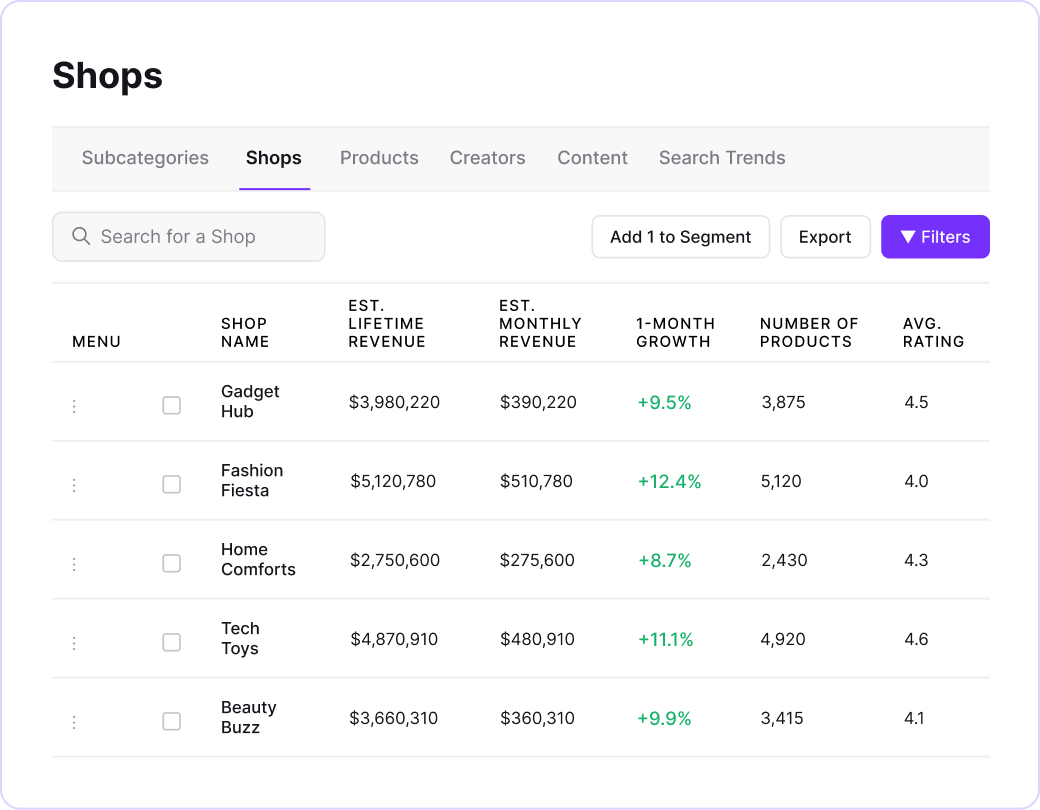
Shop Analysis goes beyond surface metrics. Instead of just showing a shop's product count and follower total, SmartScout will estimate revenue, map the product mix, track growth trajectory over time, and show creator partnership density. You will be able to evaluate whether a competitor's growth is sustainable or driven by a single viral moment.
Creator and Video Performance will connect content directly to commerce. The platform tracks which creators actually drive purchases (not just views), which video formats convert at the highest rate, and which content angles are gaining traction within specific categories. This bridges the gap between social media vanity metrics and real sales attribution.
Trend Validation is where most sellers lose money. A product trending on TikTok is not automatically a good business opportunity. SmartScout will analyze trends through sales velocity, creator activity patterns, and shop-level adoption rates rather than relying on view counts. If a product is being pushed by 200 creators but only 3 shops are actually fulfilling orders, that is a different signal than a product with 40 active shops and steady daily volume.
SmartScout pricing and availability
SmartScout's existing Amazon plans start at $29/month (Basic) and $97/month (Essentials). Pricing for TikTok Shop analytics will be announced at launch. Sellers who already use SmartScout for Amazon will get a unified research experience across both platforms, which is a significant advantage for brands and agencies operating on multiple channels.
Category-level revenue estimates with market share breakdowns by top shops, product concentration metrics, and a white-space opportunity finder that flags niches where demand outpaces supply
Shop-level competitive profiling that estimates revenue, maps product mix, tracks growth trajectory, and measures creator partnership density for any TikTok storefront
Creator and video performance tied to actual commerce: which creators drive purchases (not just views), which video formats convert, and which content angles gain category-specific traction
Trend validation engine that analyzes trends through sales velocity, creator adoption patterns, and shop-level traction rather than relying on view counts or engagement rate
Unified cross-platform intelligence for sellers and agencies operating on both Amazon and TikTok Shop from a single provider
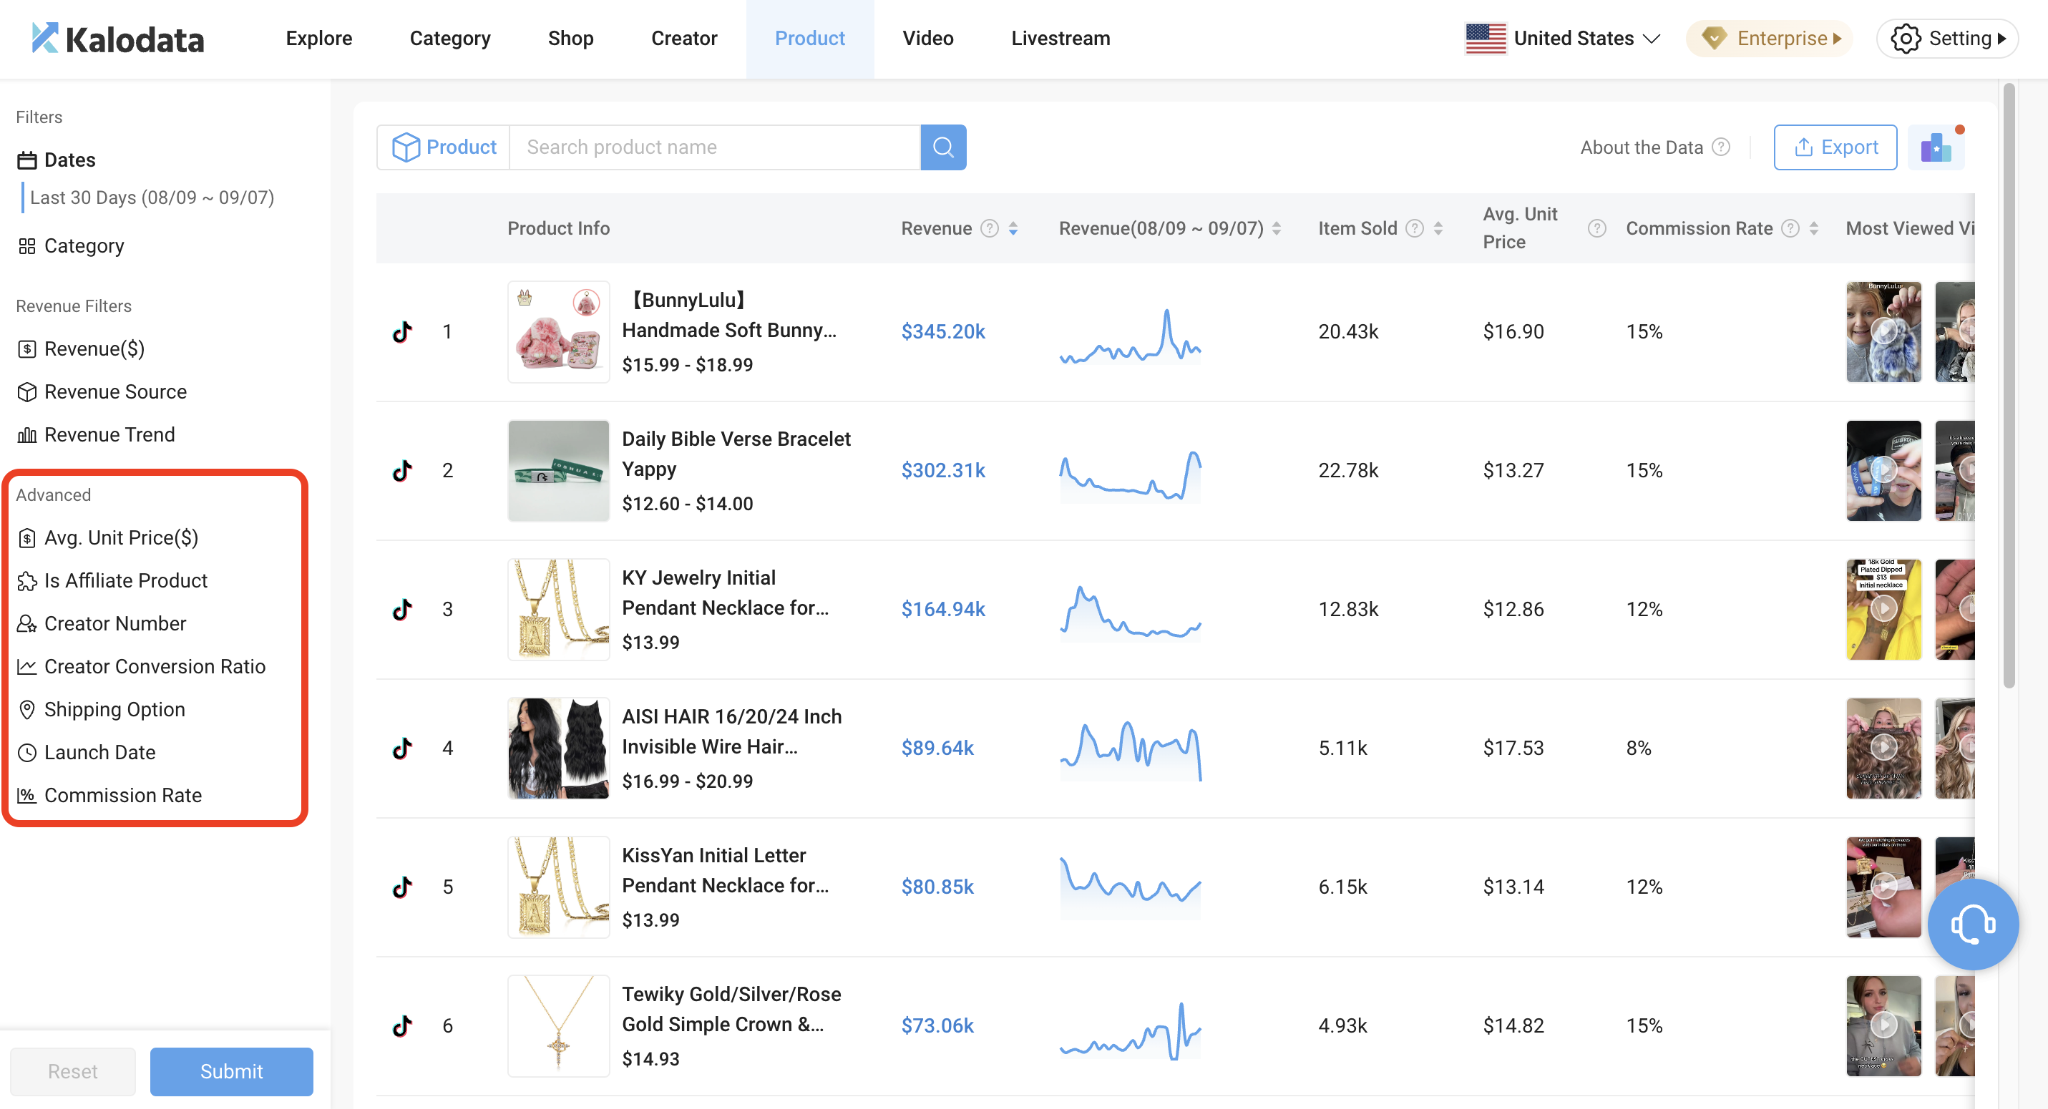
2. Kalodata: Best for TikTok Shop Product Research and Creator Discovery
Parameter
Details
Tool name
Kalodata
Standout feature
Creator-to-sales attribution that tracks how many actual units each creator moved, not just their follower count or engagement rate
Data source
Proprietary AI models trained on 100M+ TikTok Shop products, 200M+ creator profiles, and 300M+ videos. Models retrain daily.
Starting price
$45.99/month (Starter)
Free trial/plan
7-day free trial, no credit card required
The team behind Kalodata came directly from TikTok's own Global E-Commerce Division. These are the people who helped build TikTok Shop from the ground up, and that insider pedigree shows in how the platform handles data. Kalodata does not just scrape public metrics. It processes signals across its massive database to surface patterns that manual research would never catch.
Where Kalodata earns its reputation is in connecting creator activity to actual sales. Most tools show you a creator's follower count and engagement rate, which tells you almost nothing about whether partnering with them will generate orders. Kalodata tracks sales attribution at the creator level, so you can see exactly how many units a creator moved last month, what their average commission rate is, and which product categories they convert best in.
Key features
Margin estimation that factors in product price, TikTok's category-specific platform fees (2% to 8%), and affiliate commission rates before you commit to sourcing
AI-powered video analysis on Professional/Enterprise plans that identifies which content hooks, formats, and scripts are converting in any given category right now
Competitor shop revenue tracking with product-level sales breakdowns and historical performance curves
Livestream analytics covering viewer-to-buyer conversion rates, peak engagement moments, and product-level GMV per session
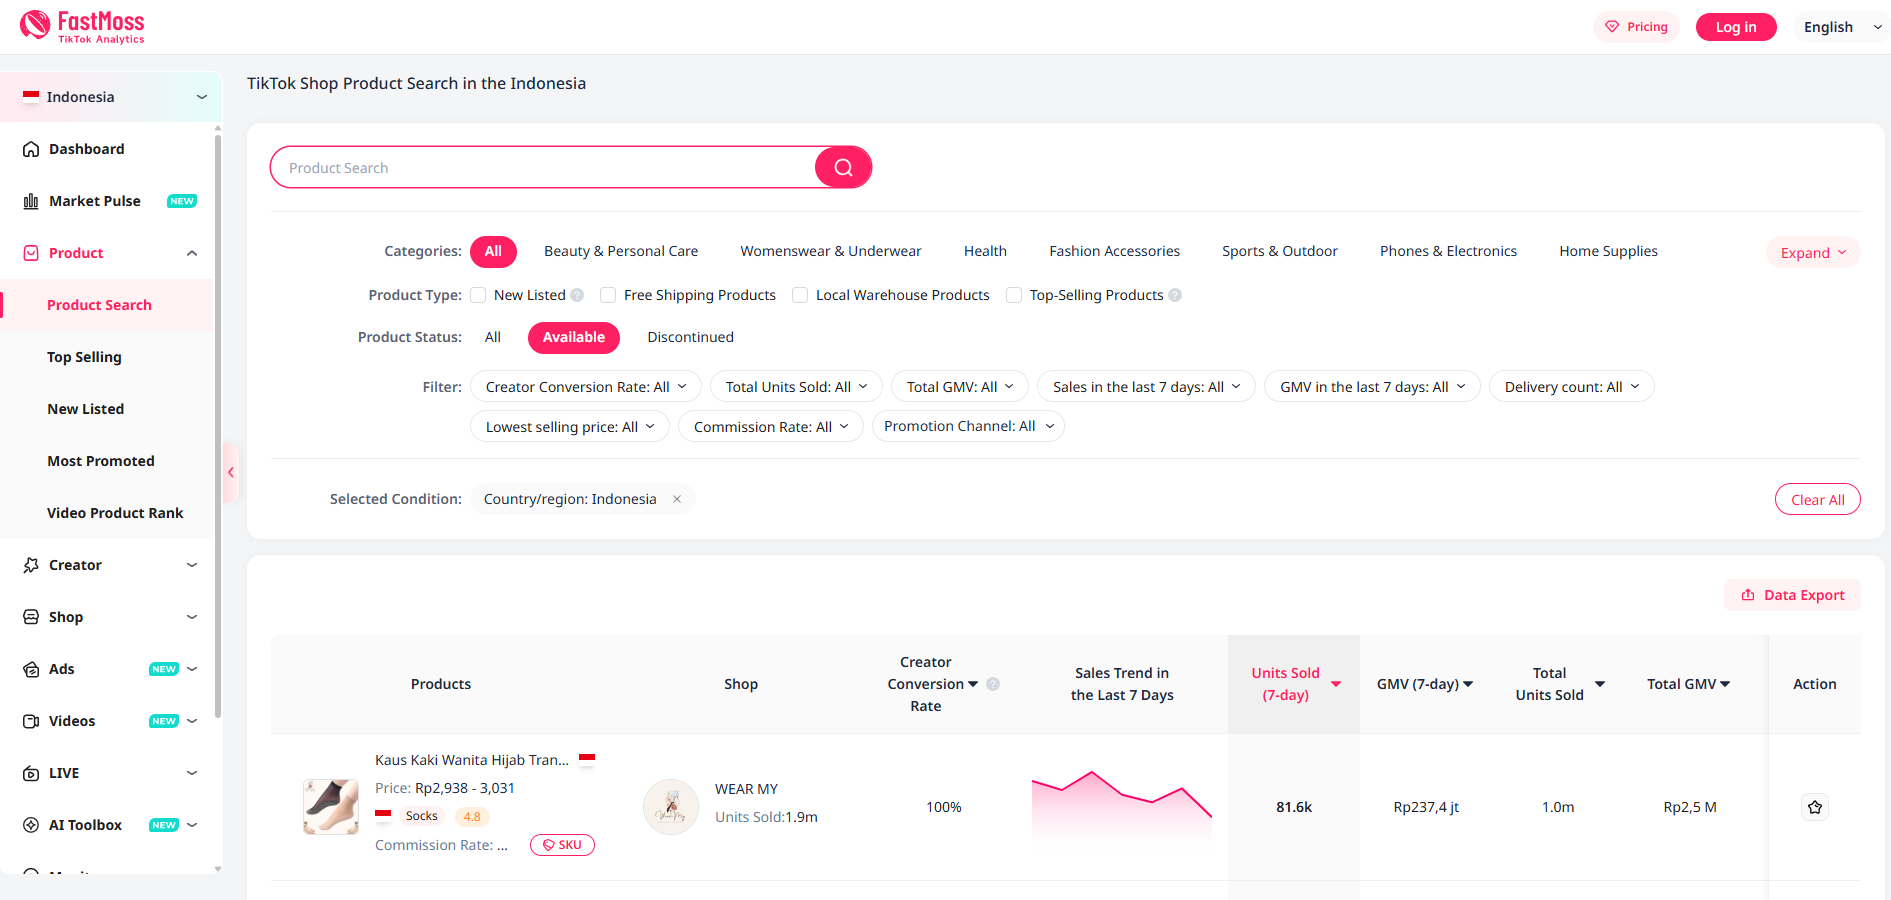
3. FastMoss: Best TikTok Shop Competitor Analysis Tool for Agencies
Parameter
Details
Tool name
FastMoss
Standout feature
Daily Shop Index Ranking that ranks top-performing TikTok Shops globally and by region, updated every 24 hours
Data source
Proprietary data collection across TikTok Shop storefronts, ad ecosystem, livestreams, and creator activity. Longest historical data windows in the category.
Starting price
$29/month (basic access)
Free trial/plan
7-day free trial (auto-renewing subscription)
Picture this: it is Monday morning, and you manage TikTok Shop operations for five client brands. You need to know which competitor launched a new product over the weekend, which creator partnership drove a revenue spike for a rival shop, and whether the category you recommended last month is still growing or starting to flatten. That is the workflow FastMoss was built for.
The platform tracks an enormous volume of TikTok Shop data with some of the longest historical windows in the category. The Shop Module is the centerpiece. You can analyze any TikTok Shop's estimated daily and monthly revenue, product mix, top-selling items, creator partnerships, and fulfillment patterns. The Shop Index Ranking updates daily and ranks the top-performing shops globally and by region, which gives agencies a quick competitive pulse without running custom reports.
Live commerce analytics separate FastMoss from lighter tools. TikTok Shop livestreaming is a massive sales channel (particularly in Southeast Asian markets), and FastMoss tracks peak viewership during live sessions, which products drove the most add-to-cart actions, average viewer duration, and per-session GMV. For brands running live shopping campaigns, this granularity means you can optimize every single session rather than guessing what worked.
Key features
Live commerce session analytics tracking peak viewership, which price points triggered add-to-cart actions, average viewer duration, and per-session GMV for brands running live shopping campaigns
Ad monitoring module that surfaces competitor ad creatives, estimated spend by category, and campaign format trends before they affect your organic rankings
Multi-region data coverage with the ability to compare shop performance across the US, UK, Southeast Asia, and other TikTok Shop markets simultaneously
Historical data windows significantly longer than competing platforms, enabling seasonal trend analysis and year-over-year performance benchmarking
4. Helium 10: Best for Expanding from Amazon to TikTok Shop
Parameter
Details
Tool name
Helium 10
Standout feature
Listing Converter that automatically reformats up to 20 Amazon parent ASINs into TikTok Shop-ready listings in minutes
Data source
Amazon Seller Central API integration for listing data. TikTok Shop Seller Center integration for performance tracking. No proprietary TikTok market data.
Starting price
$129/month (Platinum, basic TikTok access)
Free trial/plan
Free plan with heavily limited tool access. 7-day trial on Diamond plan.
Helium 10 does not belong in the same category as Kalodata or FastMoss. It is not a TikTok-native analytics platform, and it does not pretend to be. What Helium 10 does, and does well, is solve a specific operational pain point: the hours of manual work required to take an Amazon product catalog and get it onto TikTok Shop.
The Listing Converter handles the bulk of that friction. Titles get reformatted for mobile-first reading, descriptions get rewritten to match TikTok's content requirements, and image specifications get adjusted automatically. The Profitability Calculator factors in TikTok's category-specific fees so you can evaluate margins before committing. And the Profits Dashboard tracks revenue across Amazon, Walmart, and TikTok in a single unified view.
Key features
Amazon MCF integration that lets you fulfill TikTok Shop orders from your existing FBA inventory without setting up a separate logistics operation
Influencer Finder with filtered search by niche, follower range, and engagement metrics, plus bulk invitation tools for creator outreach at scale
Cross-channel profit attribution that separates TikTok ad spend, fulfillment costs, and net margins from your Amazon and Walmart operations
The limitation is significant: Helium 10 provides zero TikTok-native product research, zero category analysis, and zero competitor shop intelligence. If you want to discover what is selling on TikTok, you need a different tool entirely.
Related: See our full SmartScout vs Helium 10 comparison for a detailed breakdown of how these platforms differ.
5. EchoTik: Best Free TikTok Shop Analytics Tool for Beginners
Parameter
Details
Tool name
EchoTik
Standout feature
Chrome extension that overlays product, creator, and shop data directly on your TikTok feed while you scroll. No tab switching required.
Data source
Public TikTok Shop data processed through proprietary estimation models. Lighter data coverage than Kalodata or FastMoss.
Starting price
$13.9/month (Basic)
Free trial/plan
Free plan with real data, no credit card, no time limit
$0/month. That is what it costs to start using EchoTik, and the free plan is not a gated trial that expires in 7 days. You get real product data, creator analytics, and shop tracking with no credit card and no time limit.
The Chrome extension is the feature that makes EchoTik stand out from everything else on this list. Instead of opening a separate dashboard, you get TikTok Shop data overlaid directly on your feed as you scroll. Product estimates, creator metrics, and shop performance appear in context, right next to the content you are already watching. For sellers who do most of their research inside TikTok itself, this workflow eliminates the constant tab-switching that other tools require.
EchoTik covers the basics well (product discovery, creator profiles, shop tracking, live stream monitoring), but the data does not go as deep as Kalodata or FastMoss on any individual metric. There is no category-level market sizing, no long historical data windows, and no AI-powered trend forecasting. Think of EchoTik as the tool that tells you enough to make a first move, not the tool that gives you full conviction.
Key features
AI trend detection that flags products gaining momentum before they peak, surfacing early signals that manual browsing would miss
Browser compatibility across Chrome and Firefox, unlike most competitors, which support Chrome only
Shop-level tracking and live stream monitoring are included in the free tier, giving beginners competitive visibility without any financial commitment
6. Shoplus: Budget-Friendly TikTok Shop Product Research Tool
Parameter
Details
Tool name
Shoplus
Standout feature
Hourly data updates on paid plans for near-real-time visibility into which products are gaining traction right now
Data source
TikTok Shop public data with proprietary sales estimation algorithms. Smaller database than Kalodata or FastMoss.
Starting price
$49/month
Free trial/plan
Free tier with limited product searches and data access
Before Shoplus, the alternative was scrolling TikTok for hours, screenshotting products that looked popular, and trying to reverse-engineer sales volume from comment counts. Shoplus replaces that entire process with a structured dashboard of trending products, sales estimates, and category breakdowns. For sellers who just need a starting point for product ideas, it gets the job done at a price that does not require a second thought.
The limitations surface quickly as you scale. Historical data is capped at 90 days. There is no competitive shop tracking. And some users report inconsistent accuracy in sales estimates. Use Shoplus for idea generation, then move to a deeper tool when your TikTok Shop revenue justifies the upgrade.
Key features
Category browsing with basic revenue estimates and product concentration data, useful for initial niche exploration
Creator discovery module with filtering by niche and follower range for finding potential affiliate partners
Simple, clean interface that requires zero learning curve. Open it, filter by category, and browse trending products immediately.
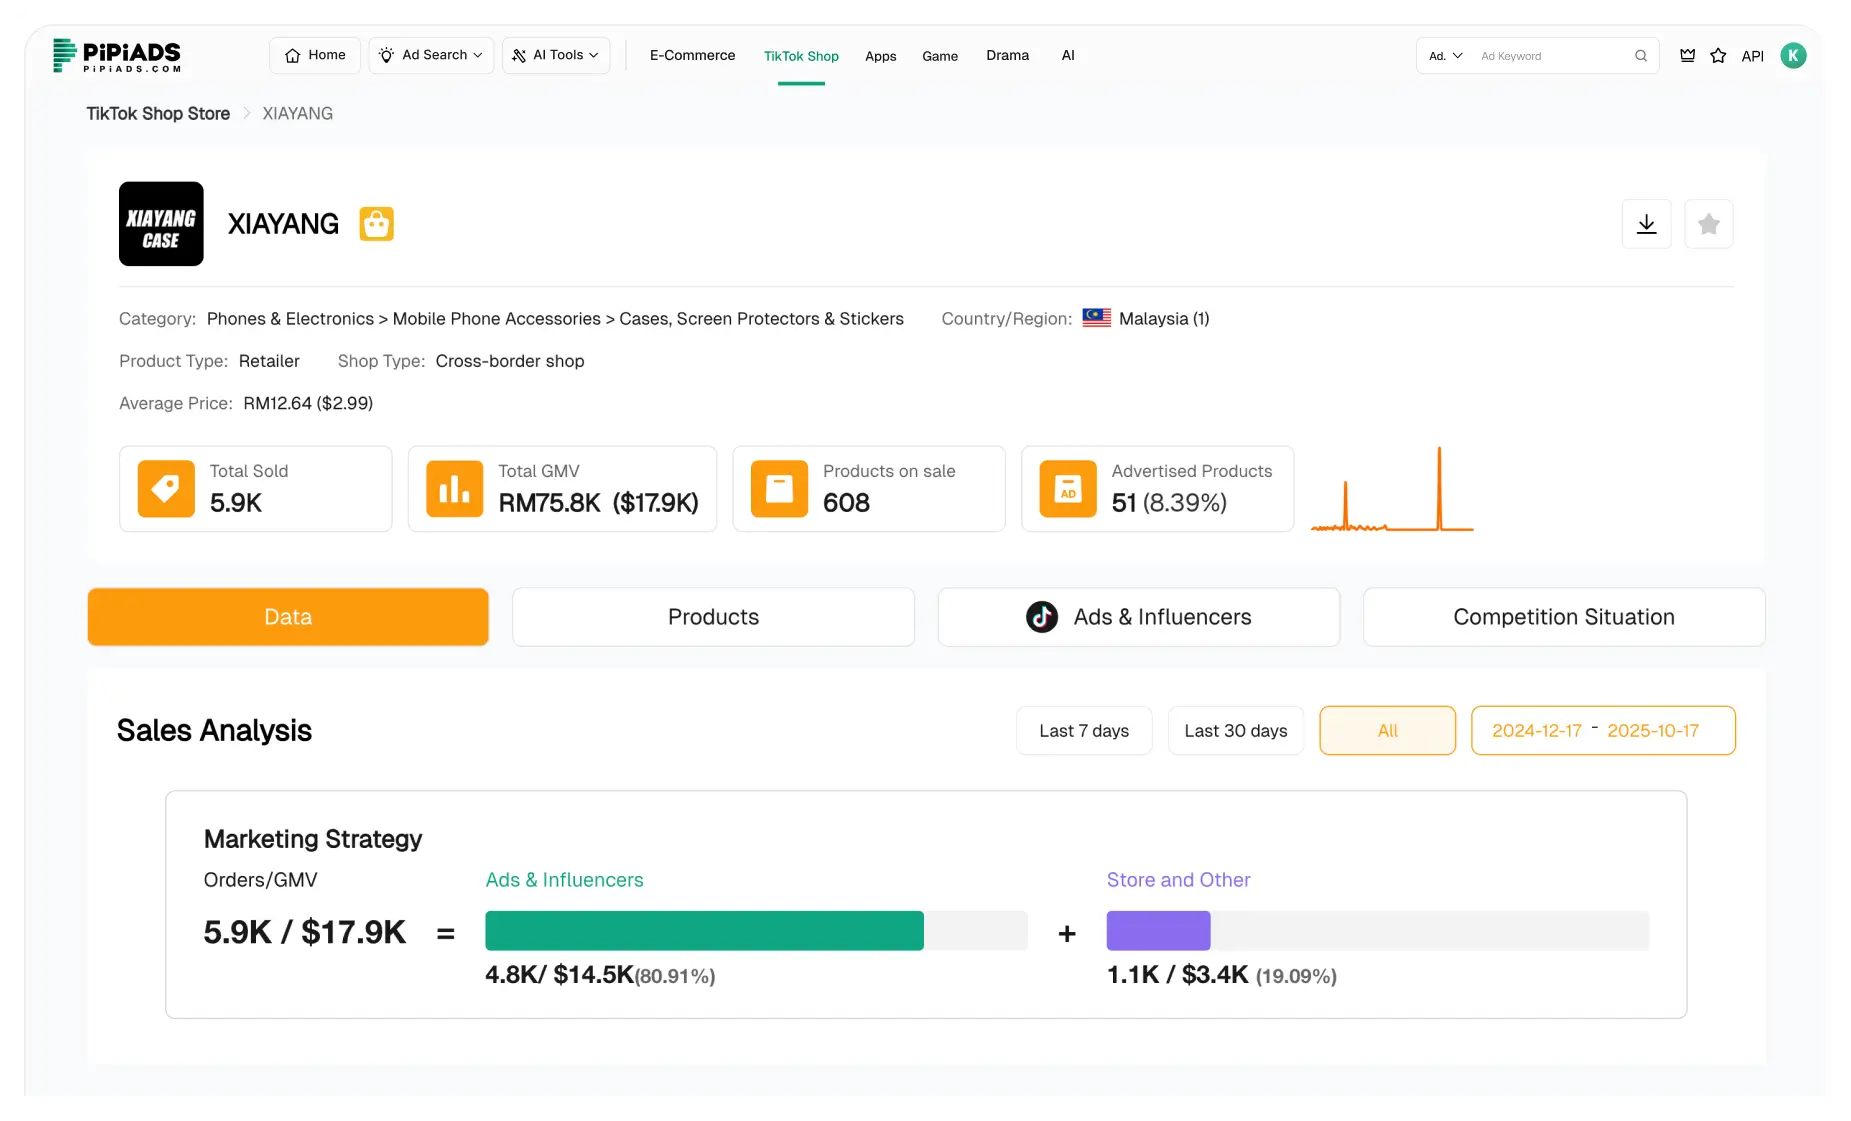
7. PiPiADS: Best TikTok Shop Ad Spy Tool
Parameter
Details
Tool name
PiPiADS
Standout feature
20M+ TikTok ad creative database with filters for engagement, country, format, run time, and ROAS signals
Data source
TikTok Ads Library data processed through proprietary tracking and estimation models. Focused entirely on paid advertising.
Starting price
$49/month (Starter)
Free trial/plan
Trial available (limited)
Follow the ad spend, not the views. That is the logic behind PiPiADS. If a seller is spending money to advertise a product on TikTok, that product almost certainly has margins strong enough to support the ad cost. PiPiADS tracks over 20 million TikTok ad creatives and lets you filter by engagement, country, ad format, run duration, and conversion signals to identify the campaigns that are actually working.
PiPiADS does not cover organic product trends, shop analytics, category intelligence, or creator discovery. It is a specialist, and at $77/month for the entry tier, you are paying for one capability. For sellers who spend heavily on TikTok advertising, that single capability is worth the cost.
Key features
Reverse-engineering workflow: find products validated by sustained paid promotion (30+ day ad runs with strong ROAS), not just organic virality
Ad creative analysis showing which hooks, formats, and content angles drive the highest conversion rates in each product category
Landing page tracking that connects ad creatives to their destination shop pages, revealing the full funnel from impression to purchase
Related: For Amazon advertising intelligence, SmartScout's Ad Spy provides comparable competitor ad tracking across the Amazon marketplace.
8. Tabcut: Best for API Access to TikTok Shop Data
Parameter
Details
Tool name
Tabcut
Standout feature
API access that lets development teams pull TikTok Shop product, shop, and category data directly into custom dashboards and automated reporting pipelines
Data source
TikTok Shop public data processed through proprietary models. Category rankings and shop metrics available via both web interface and API.
Starting price
$59/month
Free trial/plan
Free plan with basic web access
Most TikTok Shop analytics tools assume you want a dashboard. Tabcut assumes you might want to build your own. The platform provides product research, shop analytics, and category-level data through a web interface that is functional if not particularly polished. But the real differentiator is the API access on higher plans, which lets development teams pull TikTok Shop data directly into internal dashboards, spreadsheets, or automated reporting pipelines.
For agencies with proprietary reporting stacks or brands with data engineering teams, the ability to programmatically access category rankings, product performance metrics, and shop-level data without manual exports is a meaningful operational advantage. The web interface serves as a quick-lookup tool alongside the API.
Key features:
Programmatic access to category rankings, product performance metrics, and shop-level data without manual CSV exports or screenshot workflows
Category-level data including top products by subcategory, shop distribution, and growth rate trends
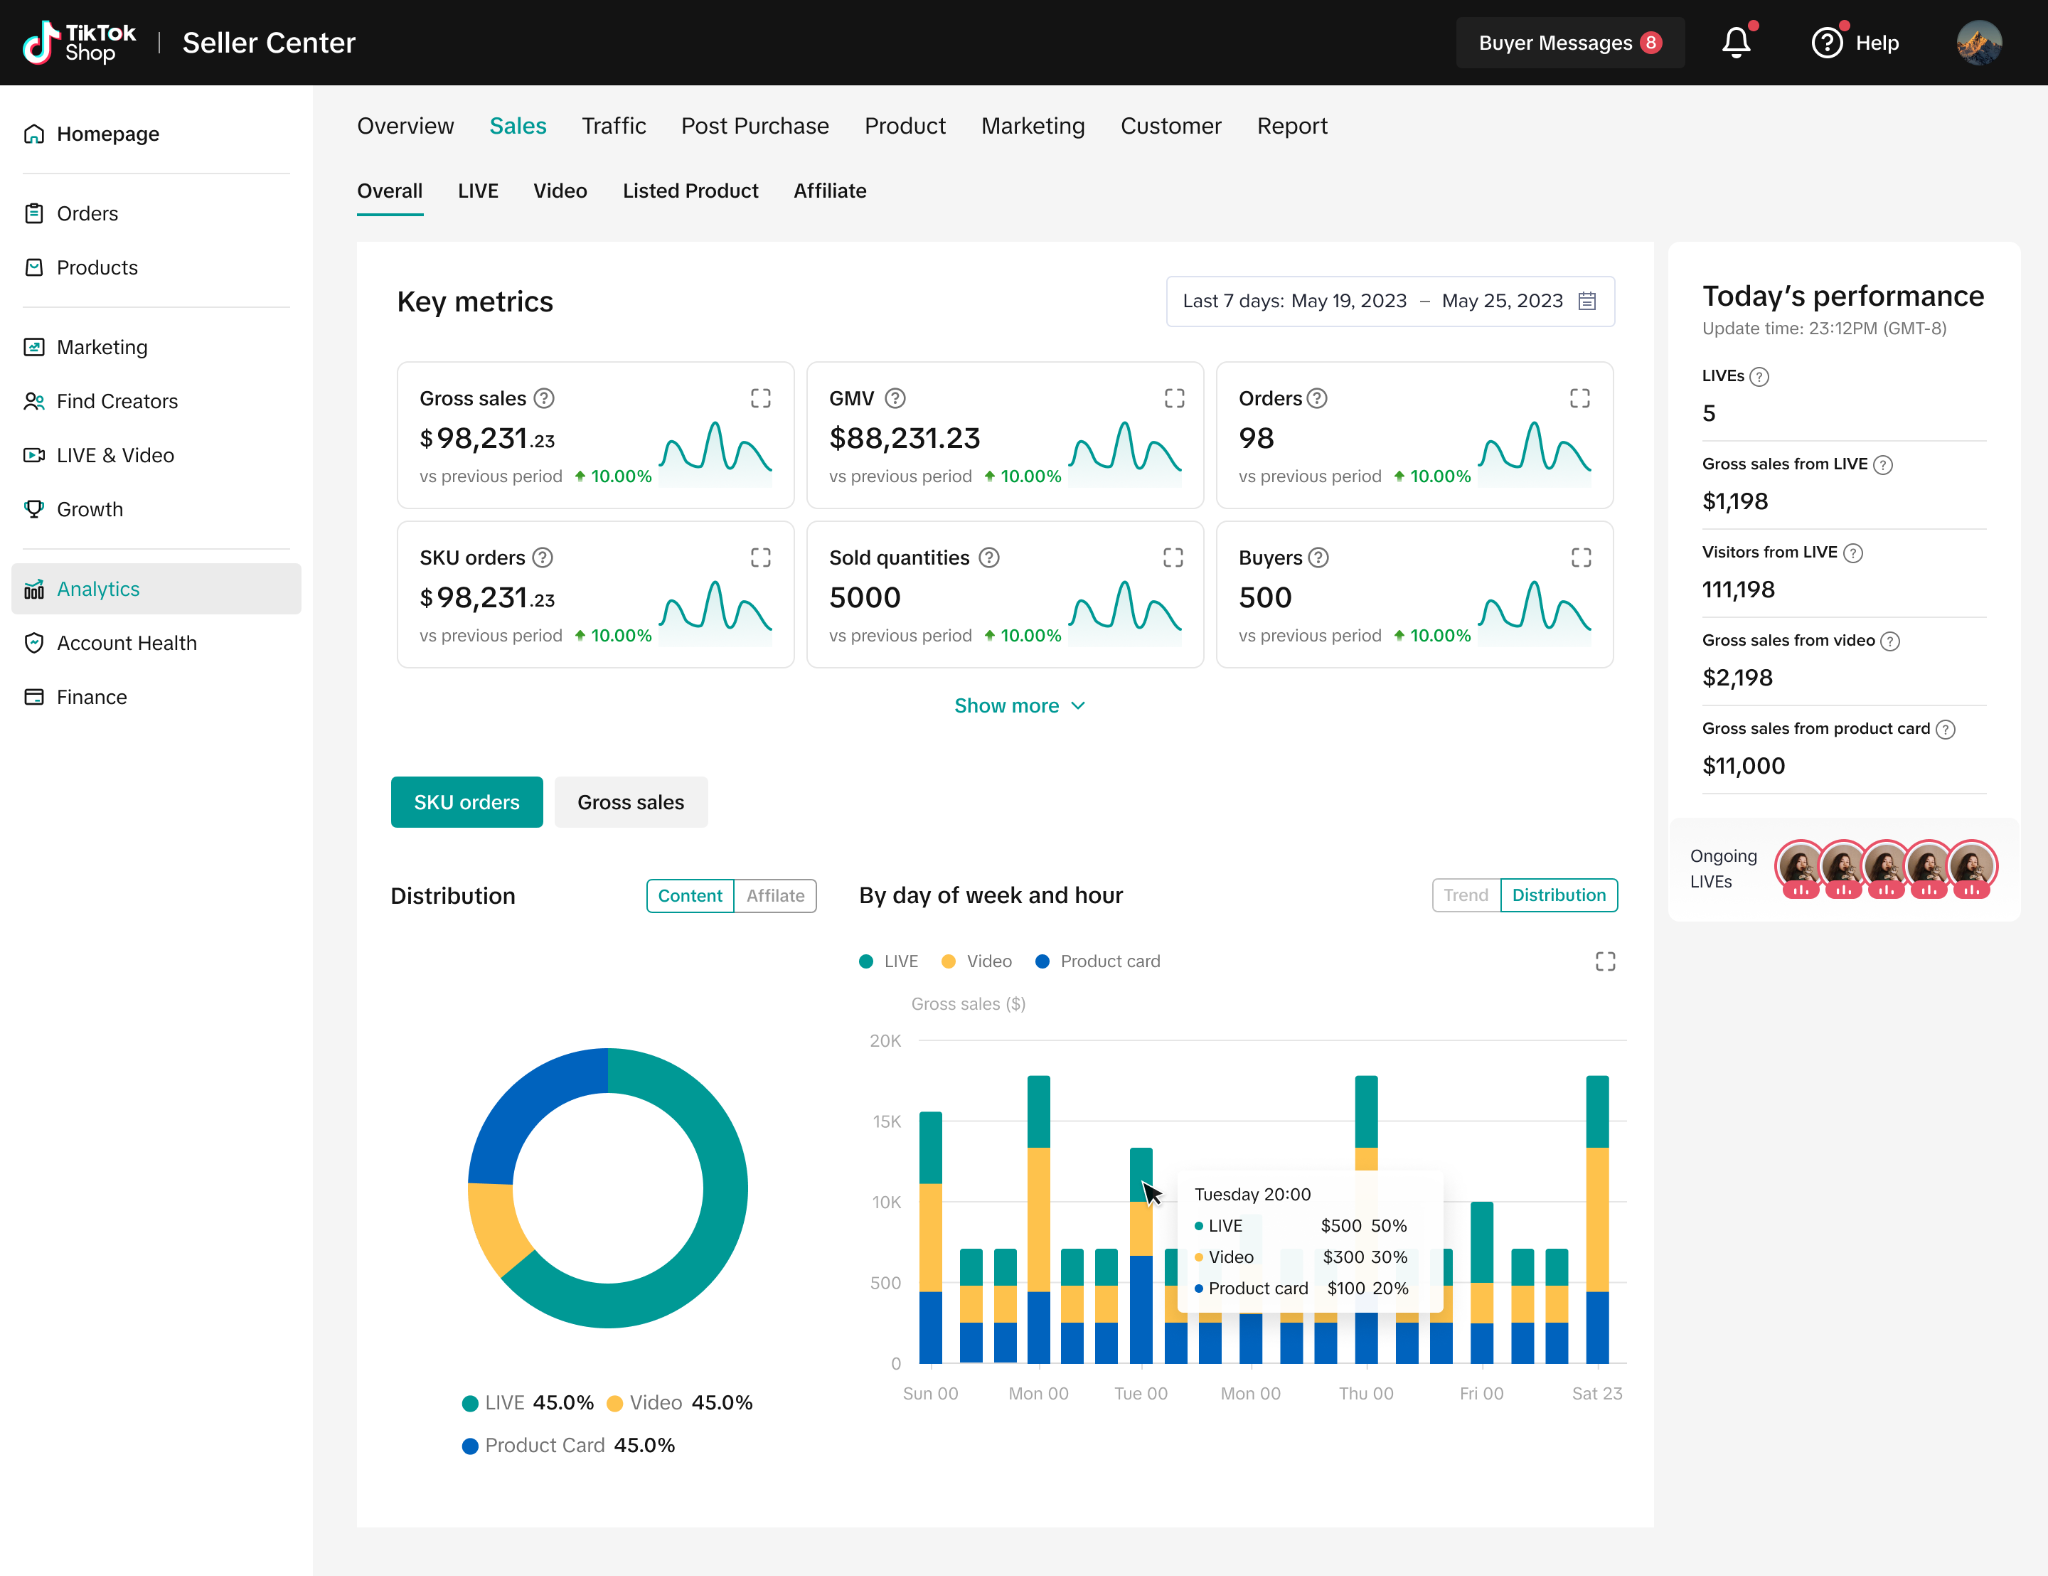
9. TikTok Seller Center: Free Official Analytics for Your Own Shop
Parameter
Details
Tool name
TikTok Seller Center
Standout feature
First-party data accuracy. Revenue, order, and fulfillment metrics come directly from TikTok's internal systems, not third-party estimates.
Data source
TikTok's own platform data. First-party, verified, no estimation.
Starting price
Free
Free trial/plan
Free for all TikTok Shop sellers
Before spending a dollar on third-party analytics, make sure you are actually using what TikTok gives you for free. Seller Center provides first-party data on orders, revenue, fulfillment performance, and basic advertising metrics. The data is accurate because it comes directly from TikTok's internal systems rather than being estimated by an outside algorithm.
The limitation is obvious: Seller Center shows only your data. You cannot research competitors, discover trending products across the platform, or analyze category-level demand. It is a necessary foundation. It is not a substitute for competitive intelligence.
Key features
Opportunity Center flags high-demand product categories with limited supply, which is TikTok's own signal for where organic traffic support is available
Creator Marketplace for finding and contacting affiliate partners at no additional cost, with filtering by niche and content style
Creative Center surfaces trending hashtags, popular sounds, and content formats gaining traction, useful for content strategy even without paid tools
How to Choose the Right TikTok Shop Analytics Tool
The right tool depends on the specific bottleneck you are trying to solve, not on which platform has the most features.
If you need to understand the market structure before entering a category, SmartScout TikTok Analytics is the only platform building that capability. Register for early access.
If you need to find specific products to sell and identify creators to partner with, Kalodata provides the deepest product and creator data available. The 7-day free trial makes it risk-free to evaluate.
If you run an agency or manage multiple TikTok Shop brands, FastMoss gives you the competitive monitoring infrastructure that agency workflows demand.
If you are an Amazon seller adding TikTok Shop as a new channel, Helium 10 handles the operational logistics of listing conversion and cross-channel profit tracking. But pair it with a TikTok-native research tool for product discovery and competitive intelligence.
If you are testing whether TikTok Shop is worth your time and do not want to spend anything until you know, start with EchoTik's free plan and TikTok's own Seller Center. Upgrade once your revenue justifies the investment.
The Complete TikTok Shop Analytics Stack for 2026
No single tool covers every layer of TikTok Shop intelligence. The sellers and agencies generating the most revenue tend to stack two to three tools that complement each other without overlapping.
Ad creative intelligence: PiPiADS (if you run paid TikTok campaigns)
Own-shop performance: TikTok Seller Center (free, non-negotiable)
For sellers already using SmartScout for Amazon, the TikTok launch means evaluating market opportunities across both platforms from a single provider. That cross-platform view is particularly valuable for brands and agencies deciding how to allocate inventory and advertising budgets between channels.
The Bottom Line
Most TikTok Shop tools answer the same question in slightly different ways: what is selling right now? That question matters, but it is the second question, not the first. A product can be selling well inside a category that is already saturated, controlled by three dominant shops, or about to roll over. Knowing what is hot without knowing the shape of the market around it is how sellers end up entering categories at the exact moment margins collapse.
That is the case for starting with category intelligence. Map the market first, find the niches where demand is outpacing supply, then use product and creator tools to execute inside the categories worth entering. SmartScout TikTok Analytics is being built around that exact sequence, the same way SmartScout already maps Subcategories and brands on the Amazon side. For sellers and agencies running both channels, it means evaluating opportunities across Amazon and TikTok Shop from a single provider instead of stitching together separate tools and separate logic.
If you want to be first in line when the TikTok module launches, register for early access. And if you want to start putting category and market intelligence to work today, every SmartScout plan comes with a 7-day money-back guarantee, so there is no risk in seeing what category-first research does for your sourcing decisions before you commit.
Amazon wanted more people to join Prime, and one big sale day was the cleanest way to do it. This is when Prime Day first began in July 2015 as a one-day birthday promotion.
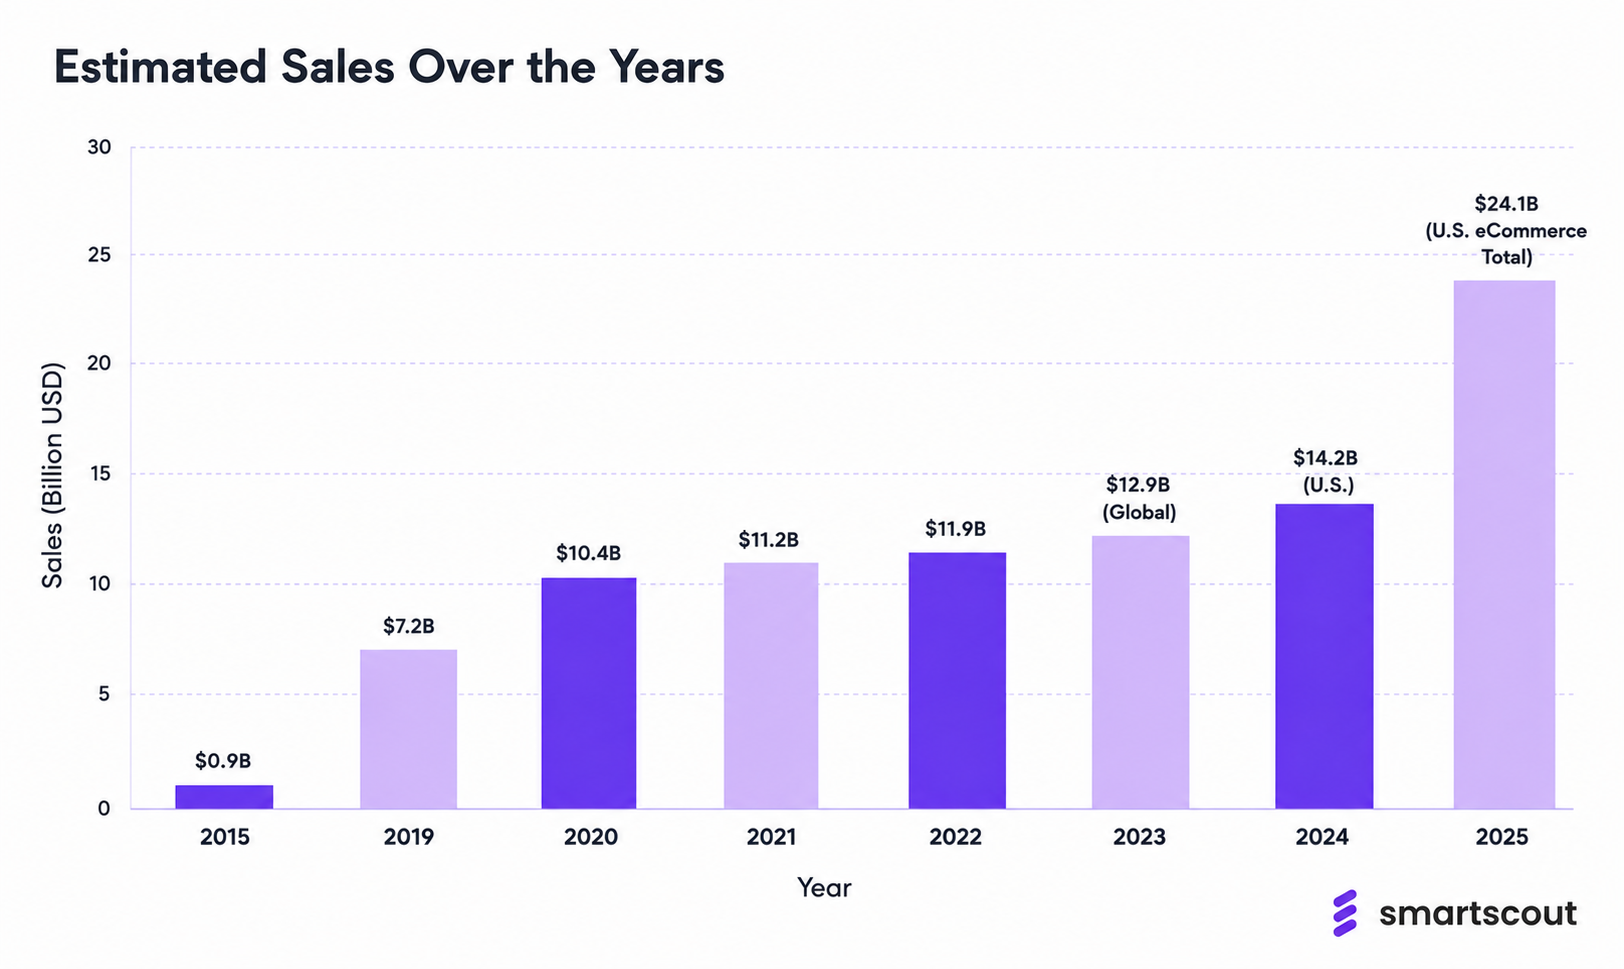
Eleven events later, it has become something much bigger. The 2025 edition stretched across four days, ran in more than 25 countries, and drove an estimated $24.1 billion in U.S. online spend across every retailer, not just Amazon.
This guide pulls together the most recent Prime Day statistics in one place, with sources you can verify. SmartScout tracks Prime Day closely because the patterns that surface during the event tend to shape seller strategy for the rest of the year.
Key Prime Day Statistics at a Glance
Shoppers in the US spent $24.1 billion online in 2025 across all retailers, up 30.3% year over year
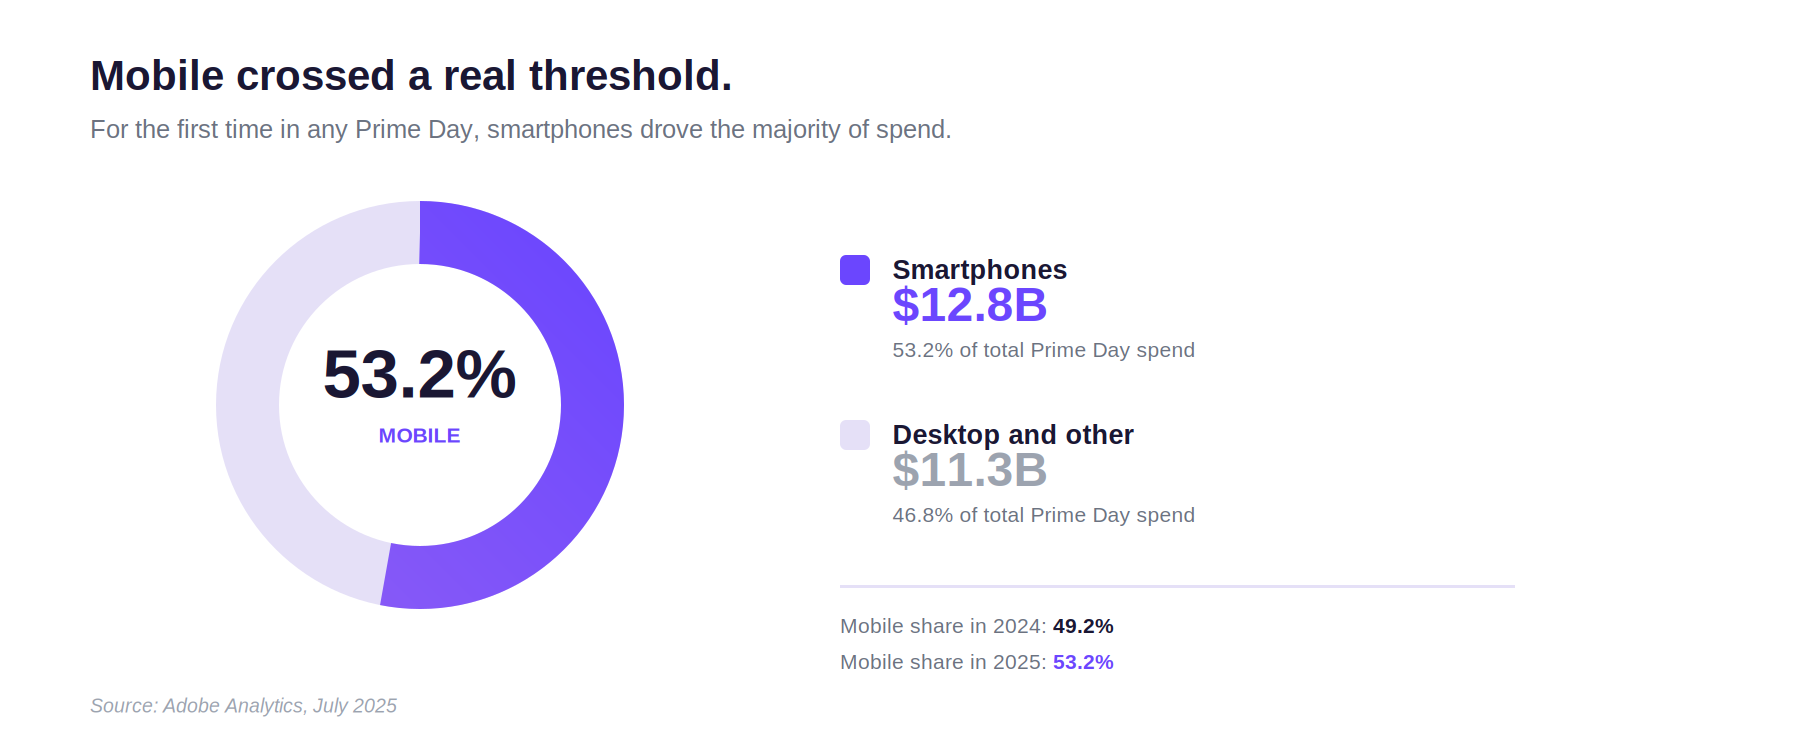
53.2% of transactions happened on mobile devices, with smartphones contributing $12.8 billion in Prime Day Sales 2025
The average order value was $53.34, and the average household spent around $156.37
67% of items sold were priced under $20
Traffic from generative AI tools to U.S. retail sites jumped 3,300% year over year during the Prime Day event
Buy Now, Pay Later orders accounted for a total of 8.1% of all online orders, totaling $2 billion across four days
Amazon Prime Day Sales Statistics
Amazon does not publish Prime Day-specific revenue figures. The numbers below come from third-party analysts, mainly Adobe Analytics for U.S. spend and Statista's compiled series.
Methodologies and geographic coverage differ between sources, so these are estimated numbers rather than exact figures.
Year
Estimated Sales
Notes
2015
$0.9 Billion (global)
First Prime Day, 24-hour event
2019
$7.2 Billion (global)
Expanded to 48 hours
2020
$10.4 Billion (global)
Delayed to October due to COVID-19
2021
$11.2 Billion (global)
Returned to summer
2022
$11.9 Billion (global)
Over 300 million items sold
2023
$12.9 Billion (global) / $12.7B (U.S.)
375 million items sold worldwide
2024
$14.2 Billion (U.S.)
11.7% YoY growth in the U.S.
2025
$24.1 Billion (U.S. ecommerce total)
First four-day event, 30.3% YoY growth
Sources: Statista global series, Statista U.S. series, and Adobe Analytics for 2025. The 2025 figure measures total U.S. retailer online spend during the window, not Amazon-only revenue.
The format change is the single biggest reason 2025's headline number was up 30% year over year. Longer event, more transaction time, more reported revenue. For context, the 2025 four-day total roughly matched the combined 2024 Black Friday and Cyber Monday online sales.
Per-day intensity actually dropped. NielsenIQ's panel data shows the average daily order total in 2025 was 136% above Amazon's year-to-date daily average, versus 247% above the year-to-date daily average in the 2024 two-day event.
So the event is bigger overall, but each individual day is less concentrated than before.
Prime Day Shopper Statistics
About 89% of 2025 Prime Day shoppers said they had shopped a previous Prime Day, and 87% identified as Prime members of more than a year.
A further 96% of shoppers knew it was Prime Day before they shopped, and 52% said Prime Day was their primary reason for visiting Amazon during that period.
Profile Dimension
2025 Snapshot
Typical observed shopper
High-income, suburban female, age 45 to 64
Gender share
Women accounted for a higher share than in H1 2025
Top generations
Gen X and Millennials led shopping share
Income mix
Lower-income shoppers no longer over-indexed (a shift from 2024)
Prime member share
About 87% identified as Prime members of more than a year
Walmart Deals, Target Circle Week, and Best Buy's Black Friday in July all pulled real Prime Day attention. 49% of Prime Day shoppers also shopped Walmart, 38% shopped Target Circle Week, and 11% shopped Best Buy. And 57% of Prime Day shoppers compared Amazon's prices to other retailers before placing orders.
Prime Day Consumer Spending Statistics
The average Prime Day order in 2025 was $53.34, down roughly 8% from $57.97 in 2024. But shoppers placed more separate orders. Roughly 63% of households placed two or more, which pushed average household spend up to $156.37, a 2.6% bump from $152.33 the prior year.
Here is how that broke down by order size and order count:
The pattern is clear once you see the per-item average. Spend per item dropped to $24.59 in 2025 from $28.47 at the same point in 2024. More orders, cheaper items. This was a stock-up event, not a splurge event.
BNPL hit a new high in 2025. It accounted for 8.1% of online orders, up from 7.4% the year before, and totaled $2 billion in spend across the four days, growing 33.3% year over year. Adobe's survey respondents reached for BNPL most often in apparel, electronics, home goods, and health and beauty.
Most Popular Prime Day Categories
Numerator's verified-buyer survey ranked the most-purchased categories. Everyday essentials dominate the leaderboard:
Category
Share of Prime Day Buyers
Household Essentials
30%
Apparel & Shoes
30%
Home Goods (bedding, décor)
27%
Health & Wellness
26%
Beauty & Cosmetics
25%
Consumer Electronics
19%
Pet Products
15%
Groceries
15%
Toys & Video Games
12%
Source: Numerator 2025 Prime Day Survey.
Biggest category lifts on Prime Day
Adobe measures category lift differently. It compares Prime Day sales against the daily average from June 2025, which surfaces where Prime Day pulled in disproportionate demand:
Category
Lift vs. June 2025 Daily Average
Kids’ apparel
+250%
Home security
+185%
School supplies
+175%
Refrigerators and freezers
+160%
Headphones and speakers
+155%
Appliances (broad)
+112%
Office supplies
+105%
Electronics (broad)
+95%
Books
+81%
Source: Adobe Analytics, Prime Day 2025.
Mobile Shopping & Ecommerce Trends
For the first time in any Prime Day, mobile revenue beat desktop revenue. Smartphones generated 53.2% of online sales, roughly $12.8 billion in spending. The 2024 share was 49.2%, so this is not a small jump. It is a structural shift.
Mobile is now the primary driver of e-commerce sales overall, which has real consequences for how sellers should design listings and ads. Mobile-first product imagery, A+ content that renders on small screens, and ads optimized for thumb scrolling all matter more than they did a year ago.
Prime Day Seller Statistics
Most coverage of Prime Day focuses on what consumers did. The seller side often matters more for strategy. Ad costs, conversion rates, and inventory positioning shape outcomes that the GMV number cannot show.
Ad spend and CPC trends
Skai called Prime Day 2025 the biggest Prime Day in Amazon Ads history, though year-over-year ad spend growth was slower than in prior years. Across Skai's client base, daily averages outperformed the 30-day baseline.
Clicks were up 108%, impressions up 114%, click-through rate climbed, and cost-per-click actually fell. That pattern says advertisers paced their budget across all four days instead of front-loading day one.
Metric
Prime Day 2025 vs. 2024
Sponsored Products CPC
Down ~11% YoY
Clicks vs. 30-day baseline
Up 108%
Impressions vs. 30-day baseline
Up 114%
Click-through rate
Higher than 2024
ROAS (one agency benchmark)
~$4.59, up 12.8% YoY
Day 1 share of attributed sales
34%
Day 3 share of attributed sales
19% (lowest)
Halo effects beyond direct deals
Even brands that did not run formal Prime Day deals saw a sales lift. Acadia's data shows roughly a 46% lift versus their normal weekly baseline during the event. That changes the question for many sellers from "should we run a deal" to "are our listings, inventory, and ads ready for the surge either way?"
How two brands used Prime Day differently
The 46% halo lift tells one side of the story. The other side is what happens when brands actively run deals, and how much the execution varies even among large sellers. SmartScout's marketplace data from July 2025 shows two brands that both treated Prime Day as a growth lever but pulled it in opposite directions.
Prime Day 2026 timing has compressed seller prep
Prime Day 2026 is expected in late June rather than mid-July, with industry sources pointing to roughly June 23 to 25. Deal submissions are expected to open in late March and close on May 26. For sellers who used to treat July as a soft prep target, the calendar has shifted by about a month. Inventory and ad planning should start in March, not June.
Prime Day Pricing & Discount Statistics
This is the section that gets the least attention in most Prime Day roundups, which is exactly why it matters. Omnia Retail's proprietary analysis found that the overall average discount depth across discounted Amazon US products in 2025 was around 21.7%.
Amazon's own tech brands like Fire TV, Echo, Kindle, and Ring averaged about 30% off, and Amazon Private Brands ran up to 40% off. For third-party products, the picture was more complicated.
Omnia's most striking finding: 45.5% of products were priced higher during Prime Day 2025 than the week before the event. Only 0.6% of products saw price reductions of more than 20% from the pre-event baseline. For most listings, the "Prime Day discount" reverted prices to where they had been a month earlier, instead of offering a genuinely new low.
Adobe's view shows higher peak discounts
Both views can be accurate at the same time. Adobe measures peak discount depth against listed prices, not pre-event street prices. By that view, here is how the major categories landed:
Category
Peak Discount 2025
Peak Discount 2024
Apparel
24%
20%
Electronics
23%
23%
Toys
19%
15%
Televisions
18%
16%
Appliances
17%
14%
Furniture
16%
16%
Computers
13%
11%
Sporting goods
11%
11%
Source: Adobe Analytics, Prime Day 2025 (Adobe).
Practical takeaway: price-tracking tools like CamelCamelCamel and Keepa saw a spike in usage during the 2025 event. Consumer skepticism about promotional pricing is rising, not falling, and sellers who set genuine discounts off durable baselines will earn more trust than those who inflate prices first.
AI & Prime Day Shopping Trends
This is the fastest-growing storyline in e-commerce, and Prime Day 2025 is the cleanest evidence point so far. Traffic to U.S. retail sites from generative AI sources like ChatGPT, Perplexity, AI-powered browsers, and shopping assistants jumped 3,300% year over year during the four-day event. For context, the same traffic was up 1,300% during the 2024 November to December holiday window. The curve is accelerating, not flattening.
Inside Amazon, Rufus, the AI-powered shopping assistant, handled an estimated 274 million queries per day by October 2024, about 13.7% of all Amazon searches, with that share projected to reach 25 to 35% by the end of 2025. To handle Prime Day volume, Amazon deployed roughly 80,000 AWS AI chips to process about 3 million tokens per minute for Rufus queries.
AI is still small compared to traditional channels in absolute terms. During Prime Day 2025, paid search drove 28.5% of online retail revenue (up 5.6% YoY), and affiliates and partners drove 19.9% (up 15%). But AI-referred visitors convert 31% better than non-AI traffic, and revenue per visit is up 254% year to date. The channel does not have to overtake paid search to start mattering.
For sellers, the practical implication is direct. Product listings need to be AI-ready. That means clear, structured answers to common customer questions inside the listing, reviews that surface key features, and titles and bullets written in a way that an LLM can summarize cleanly.
Amazon Prime Day vs Black Friday Statistics
Prime Day has steadily narrowed the gap to Black Friday on most metrics, and in some cases, passed it. The 2025 four-day Prime Day generated more total online retail spend than the 2024 Black Friday and Cyber Monday combined.
Comparing a four-day event to a one-day Black Friday flatters Prime Day. The fairer reading is that Prime Day is now Amazon's mid-year demand peak, comparable to but not yet a replacement for the November to December window. Black Friday still has a broader cultural reach, since 36% of consumers planned to shop it in 2024, versus 32% who planned to shop Prime Day.
Prime Day Statistics for Small Businesses
Amazon frames Prime Day as a small-business event, and the data partially supports the narrative. Capital One Shopping estimates small businesses made roughly $3.63 billion in sales during Prime Day 2024). Independent sellers, described by Amazon as mostly small and medium-sized businesses, sold more than 200 million items during the two-day 2024 event.
The official recap says independent sellers achieved record sales and a record number of items sold, but Amazon withheld the specific unit count for the first time since 2020. That is a notable break from past disclosures. Amazon previously shared 375 million units for 2023, over 300 million for 2022, and over 250 million for 2021.
Third-party seller share has been trending up for years. Marketplace items now account for roughly 60% of total Amazon retail sales. For independent sellers, that means Prime Day is increasingly about competition among thousands of marketplace listings rather than Amazon's first-party deals. That is exactly where SmartScout's marketplace intelligence shows up.
Methodology
We compiled this report from multiple publicly available sources, drawing on a mix of primary disclosures (Amazon's official Prime Day recaps, press coverage, and SEC-tracked retail reporting) and third-party analytics platforms (Adobe Analytics, Numerator, NielsenIQ, Statista, and others).
Because Amazon does not disclose Prime Day-specific revenue or unit figures for most metrics, several of the numbers in this article are estimates produced by independent analysts and agencies. Methodologies and geographic coverage differ between sources, so we have flagged those distinctions throughout the article rather than treating every figure as an exact measurement. All data reflects what was available as of November 2025.