AI Prompts to Build an Amazon Prospect List With SmartScout
Most Recent
Feature Launches
10.24.26
0
分钟
Build Me a Target List of 100 Brands Worth Pitching
The Prompt
Preview
You have the SmartScout MCP connected. we are an Amazon agency — we do full-service management: retail media/ads, listing content and catalog, review velocity, and marketplace strategy. We have no outbound sales team and want a data-backed target list.
Build me a prospect hit list of 100 brands that show clear, fixable underperformance on Amazon right now. Screen on signals like: declining revenue or subcategory market share over the trailing 6–12 months, weak paid presence relative to category peers, low review counts or ratings versus competing ASINs, thin or stale listing content, and unprotected/contested buy box. Prioritize brands large enough to afford agency fees but not so large they already have a sophisticated internal team — roughly $2M–$50M annual Amazon revenue.
Output in two parts:
Part 1 — Top 5, detailed. For each: brand, category, est. annual Amazon revenue, the specific decline or gap with numbers, which our service fixes it, the outreach angle in one or two sentences, and what to say in the first email.
Part 2 — Top 100, table. Brand, category, est. revenue, trailing trend, primary weakness, primary agency service fit. One row each, no commentary.
State your screening criteria and thresholds before you start pulling so I can adjust.
Three Techniques Doing the Heavy Lifting
Say who you are and what you sell. Listing the four service lines is why every prospect comes back matched to a specific service instead of a generic "needs help."
Ask for the criteria before the work. The last line is the most useful sentence in the prompt. You get the thresholds first, adjust them, and only then does it go pull 100 brands. Without it you find out the screen was wrong after the output exists.
Ask for two tiers. Five worked in full plus 100 in a table gives you something to act on Monday and something to work through for a quarter.
What You Get Back
A screened list of 100 brands in a $3M to $20M revenue band with trailing declines from 3% to 40%, across four categories, plus the top five worked all the way to a written first email.
The screen states its own thresholds up front: revenue band, decline range, a minimum catalog of 10 products and 100 reviews to exclude noise, and a manual exclusion of brands owned by major CPG or luxury parents. That last filter is what makes the list usable, since a brand inside a large parent is not an agency's buyer.
Preview
Prospecting reference
Amazon prospect hit list — declining mid-market brands
One hundred brands doing $3M–$20M on Amazon with a trailing revenue decline and at least one diagnosable gap: underfunded paid, a rating under the conversion threshold, thin review depth, or missing catalog and storefront coverage. Five are worked in full, with the numbers and a first email.
Data sourceAmazon US marketplace
Revenue history throughMid-July 2026
100Brands screened in
$3M–$20MTTM revenue band
−3% to −40%Trailing 12-mo MoM trend
4Categories in scope
Screening criteria
Composite scored on depth of trailing decline, ad spend as % of TTM revenue, average rating, reviews per ASIN, and storefront presence.
Filter
Threshold
Field
Revenue band
$3M – $20M TTM
Trailing 12-month revenue
Trailing decline
−3% to −40%
Average 12-month MoM growth
Real catalog
≥ 10 products
Total products
Real review base
> 100 reviews
Total reviews
Categories
Beauty & Personal Care, Home & Kitchen, Health & Household, Grocery & Gourmet Food
Primary category
Excluded manually
Brands owned by major CPG or luxury parents, and rows with visible category misclassification.
Every month from Dec 2025 forward is below the same month a year earlier. This is not seasonality — the year-ago comparison controls for it.
The gap, with numbers
Ad Spy shows "beach waver curling iron" pulling 35,360 monthly searches at an estimated CPC of $8.48 (range $6.36–$10.60), with 20 brands actively advertising on it. Generic "curling iron" clears at $1.99. Competitors have bid Beachwaver's own brand term to more than 4x the category rate. Total ad spend is $227K against $13.2M TTM — 1.7% of revenue, well under the 3–6% category norm. They are being conquested on their own name and not defending it.
Retail mediaDefensive brand-term campaigns first
Outreach angle
Twenty brands are paying up to $10.60 a click to intercept people searching for Beachwaver by name, and Beachwaver isn't bidding hard enough to hold the top slot. That's the cheapest revenue in the account to win back.
First email
Subject: 20 brands are bidding on "beachwaver" — you're not top slot
Hi [name],
I pulled Amazon ad data on your category this week. "Beach waver curling iron" gets about 35,000 searches a month, and 20 brands are currently bidding on it — CPC is running $6–$10 versus $1.99 for generic "curling iron." That premium exists because people are typing your name and competitors are paying to get in front of them.
Your Amazon revenue is down roughly 45–55% year over year across Feb through June. Some of that is category, but branded-term leakage is the part that's fixable in about 30 days.
Worth 20 minutes? I'll walk you through the keyword data — no deck.
[signature]
2
Frownies
Eye wrinkle pads & patches · Beauty
Est. annual revenue$19.5M
Trailing trend−25.5%Verified vs. monthly series
Monthly revenue series
Month
Revenue USD
Note
Sep 2025
$1.78M
Baseline
Nov 2025
$2.47M
Holiday peak
Apr 2026
$1.19M
No recovery
Jun 2026
$1.08M
−39% vs. Sep
No month after November recovers to the September starting level. June is the weakest complete month in the window.
The gap, with numbers
Average rating 3.98 across 56,095 reviews — the lowest rating of any brand in this revenue band in the set, and below the 4.2 threshold where Amazon conversion falls off sharply. Ad spend is $57,497 on $19.5M TTM: 0.30% of revenue, roughly a tenth of category norm. Catalog is only 20 products for a $19.5M brand.
Review velocityRetail media, second
Outreach angle
A 130-year-old brand doing nearly $20M on Amazon with a 3.98 rating is leaving conversion on the table on every session — and at 0.30% ad spend, they're not buying traffic either. Both are fixable without touching the product.
First email
Subject: Frownies is at 3.98 stars — that's the whole conversion problem
Hi [name],
Frownies is doing close to $20M a year on Amazon, which is remarkable for a 20-SKU catalog. But you're sitting at 3.98 stars across 56,000 reviews, and 4.2 is roughly where Amazon's conversion curve breaks. Every point of traffic you get converts worse than it should.
The other half: your Amazon ad spend looks like about 0.3% of revenue. Category peers run 3–6%. So you're converting below par on traffic you're barely buying.
Your revenue is down about 39% from September to June. I think a meaningful chunk of that is these two things, not demand.
Can I show you the numbers? 20 minutes.
[signature]
3
THE COMFY
Wearable blankets · Home & Kitchen
Est. annual revenue$14.4M
Trailing trend−8.5%Unconfirmed — see caveat
Trend caveat
This brand is heavily gift-seasonal — Dec 2025 peaked at $4.50M against $182K in June 2026. Prior-year monthly comps were unavailable, so seasonal decay cannot be separated from true decline. Treat the trend as unconfirmed; the ad gap stands on its own.
Dec 2025$4.50M
Jun 2026$182K
The gap, with numbers
Total ad spend of $3,142 against $14.4M TTM revenue — 0.02% of revenue, the lowest ratio of any brand in the 100-brand set. Meanwhile the brand holds a 4.78 average rating across 125,791 reviews, the strongest rating/review profile in the top 5. They have earned the social proof and are buying almost no traffic to put in front of it.
Retail mediaBuilt from zero
Outreach angle
A 4.78-star brand with 125,000 reviews spending $3,000 a year on Amazon ads is the rarest thing in the category — proven conversion with no traffic engine attached. Paid is pure upside here, not a rescue.
First email
Subject: 4.78 stars, 125k reviews, $3k in ad spend
Hi [name],
THE COMFY has one of the best review profiles I've seen in home goods on Amazon — 4.78 stars across 125,000+ reviews. That's the hard part, and you've already done it.
What caught my attention is that your Amazon ad spend appears to be around $3,000 against roughly $14M in sales. Most brands your size run 3–6% of revenue. You're at a fraction of a percent.
That's unusual, and it's good news: when conversion is already proven, paid traffic is additive rather than a gamble. Given how seasonal your business is, there's a case for building this before Q4 rather than during it.
Open to a short call?
[signature]
4
EYE-VAC
Canister vacuum cleaners · Home & Kitchen
Est. annual revenue$14.7M
Trailing trend−8.7%Field-based, not verified
Signals
Ad spend$47,0940.32% of revenue
Average rating4.6333,069 reviews
Catalog29products
Category paid norm3–6%of revenue
The gap, with numbers
Strong conversion signal, near-zero paid support, and a narrow SKU footprint in a category where variant coverage drives share. Ad spend $47,094 on $14.7M TTM = 0.32% of revenue; rating 4.63 across 33,069 reviews; catalog thin at 29 products.
Retail mediaCatalog & variation expansion, phase two
Outreach angle
4.63 stars and 0.32% ad spend means EYE-VAC wins every comparison it's actually shown in — it just isn't being shown. Paid plus wider variant coverage is a straightforward share play.
First email
Subject: EYE-VAC converts well — it's just not getting shown
Hi [name],
Quick observation from Amazon category data: EYE-VAC holds a 4.63 rating across 33,000 reviews, which is above most of the canister vacuum set. But your ad spend looks like roughly 0.3% of revenue, and you're running about 29 SKUs.
Translation: when a shopper sees you next to a competitor, you tend to win. The problem is how rarely that comparison happens.
Revenue is off modestly over the trailing year. I'd argue that's a visibility problem rather than a product one, and it's the more fixable of the two.
Worth a conversation?
[signature]
5
Nextmug by Nextboom
Tea & espresso beverage warmers · Home & Kitchen
Est. annual revenue$15.1M
Trailing trend−10.5%Field-based, not verified
Signals
Ad spend$23,4030.15% of revenue
Average rating4.25At the threshold
Total reviews7,654365 per ASIN
Catalog21products
The gap, with numbers
Rating 4.25 is right at the conversion threshold, and low for a premium-priced device. Only 7,654 total reviews across 21 products — thin for a brand at this revenue, which suggests review velocity has not kept pace with sales volume. Ad spend is 0.15% of revenue.
Review velocityListing content, then retail media
Outreach angle
$15M on a 21-SKU catalog with only 7,600 reviews and a 4.25 rating — the sales are there but the social proof and the paid engine are both underbuilt, which is why the trend has turned.
First email
Subject: $15M in sales, 7,600 reviews — that ratio is the issue
Hi [name],
Nextmug is doing around $15M a year on Amazon across about 21 SKUs. Impressive. But you've only accumulated ~7,600 reviews, and you're sitting at 4.25 stars.
For a premium-priced device, both of those numbers are working against you at the moment of decision — shoppers comparing warmers see thinner social proof than your actual sales volume would suggest, and 4.25 is right at the edge where Amazon conversion softens.
Your ad spend also looks like about 0.15% of revenue, so there's not much pushing against it.
Revenue is down roughly 10% over the trailing year. I think review velocity is the highest-leverage fix. Can I show you what I'm seeing?
[signature]
Part 2
The full 100
PaidAd spend under ~1% of revenue
RatingAverage rating below 4.30
ReviewsThin reviews per ASIN
ContentNo Brand Store, catalog gaps
StrategyDecline steeper than 25%, paid already funded
92Great Bay HomeHome & Kitchen$17.8M−5.1%Paid — 0.16% of revRetail media
93PompeianGrocery$18.4M−4.8%Paid — 0.91% of revRetail media
94UmbraHome & Kitchen$16.2M−4.3%Paid — 0.98% of revRetail media
95MorovanBeauty$11.0M−3.8%Paid — 0.18% of revRetail media
96IvilonHome & Kitchen$15.7M−3.7%Paid — 0.45% of revRetail media
97SeoulCeuticalsBeauty$10.9M−3.6%Paid — 0.76% of revRetail media
98The Republic of TeaGrocery$20.0M−3.1%Content — no storefrontCatalog & content
99BruderHealth & Household$19.3M−3.1%Paid — 0.69% of revRetail media
100L'ANZABeauty$12.4M−3.0%Content — no storefrontCatalog & content
No brands match these filters. Clear the search or pick “All categories” and “All services”.
What Makes the Top Five Worth Reading
Each one names the specific fixable gap with a number attached. Competitors bidding a brand's own name to more than 4x the generic category rate while the brand spends 1.7% of revenue on ads against a 3 to 6% norm. A brand sitting at 3.98 stars, below the threshold where conversion falls off, spending 0.30% of revenue on ads. A brand with 4.78 stars across 125,791 reviews spending $3,142 a year on advertising, which is proven conversion with no traffic engine attached.
That last framing is the interesting one. It is not a rescue pitch, it is pure upside, and it reads completely differently in a first email.
The Integrity Move
The report checks declines against prior-year monthly comps to rule out seasonality, and where those comps were not available it says so and marks the trend unconfirmed rather than quietly counting it. One gift-heavy brand went from $4.50M in December to $182K in June, which looks catastrophic and is mostly a calendar. The entry stands on its ad gap instead. Worth copying that habit, because a prospect will absolutely know their own seasonality.
Data It Touches
Brand search across the revenue band, market share and subcategory trend, product research on catalog and review depth, ad spy for spend and CPC, search term volumes.
Go Deeper
Re-run the screen with the revenue band at [RANGE] and tell me what changes
Rank all 100 by how fast the primary gap could be fixed
Pull the full teardown on the top three before I reach out
Which of these have contested buy boxes, and who is on the listings
Where It Gets Soft
Revenue, ad spend, and CPC are estimates, so a brand near a threshold may not belong in the band at all. Widen the range rather than trusting the edges.
A trailing decline is not automatically a problem to sell against. It can be seasonality, a deliberate SKU exit, a channel shift, or a parent-company decision, and the brand knows which. Check prior-year comps before treating any decline as a finding, and say so when you cannot.
Category norms like a 3 to 6% ad spend benchmark are reasonable rules of thumb rather than measured figures from this dataset. Present them as context, not as the brand's own number.
Pitch a Prospective Client With Their Own Data
How an agency wins a new client: show up to the first meeting already holding a diagnosis of their business.
The Prompt
Preview
I have a meeting with [BRAND] and want to present a brand analysis to them. identify the top subcategories they operate in and their market positions, how their share has grown or shrunk in each, their resellers, and identify opportunities to grow based on strengths and weaknesses illuminated in the data.
Then a second step that most people skip: attach the agency's brand style guide as a template and run the report through Claude Design to produce the finished presentation.
That second step is the difference between a document and a deliverable. The analysis is the same either way. Feeding it a style guide is what makes it land as something you built for them rather than something you generated.
What You Get Back
A seven-section pitch deck on Amazon UK. £2.89M trailing twelve, #1 in retractable ballpoint pens, and revenue down 17.1% month over month. Strong brand, stalled momentum, which is the opening an agency wants.
The finding that sells the meeting is distribution. Zebra runs a storefront but does not control its own listings: one seller holds 63.2% of brand revenue, the top two hold about 85%, and roughly 48 more sit in the tail. That concentration plus long tail is the signature of grey-market resale, and it points straight at a MAP enforcement and seller consolidation programme. It is a problem the brand can feel and an agency can fix.
The second finding is demand drifting away from the brand name. The generic term now out-searches the branded one, with 15 brands competing on the generic against 10 on the branded. Dupes are intercepting demand the brand built. Meanwhile "ballpoint pen" runs 9,568 searches a month across 29 fragmented brands with no dominant owner, which is an obvious paid opening given the #1 position in retractables.
The deck is also honest about what is noise. One category shows a large share swing off a single ASIN, and the report says so rather than counting it as momentum.
Zebra Pen preview
Amazon Growth Partners
Amazon UK Marketplace Analysis
Zebra Pen
A growth diagnosis & the plan to defend and expand share
£2.89MTrailing 12-month revenue
#1Retractable ballpoint pens
−17.1%Revenue, month-over-month
Prepared forZebra Pen — brand leadership team
Data: SmartScout · July 2026
01Executive summary
A strong year — with momentum that has stalled
Zebra Pen holds a fragmented, category-dependent position on Amazon UK. It leads retractable ballpoint pens — its largest category — yet slips to #6 in general ballpoint pens and #9 in highlighters, a category where a globally iconic Zebra line (Mildliner) is losing search visibility to competitors and dupes.
£149,311Estimated monthly revenue
£2.89MTrailing 12-month revenue
528Active ASINs
+24.1%Revenue growth, trailing 12 mo
−17.1%Revenue change, month-over-month
4.51★339,990 reviews — trust is not the barrier
What the data is telling us
01
Category-dependent, not category-wide
#1 in retractable ballpoint pens, its largest category, but #6 in general ballpoint pens and #9 in highlighters.
02
A strong year, a stalled quarter
+24.1% over the trailing 12 months, but −17.1% month-over-month. Momentum has cooled across nearly every category.
03
Reseller concentration risk
Two sellers control ~85% of Zebra revenue, with a long tail of 48+ smaller and unauthorised sellers.
04
Highlighters bleed ad budget
Zebra spends near BIC-level ad share while holding a fifth of BIC’s category share — the clearest inefficiency in the portfolio.
05
The brand is losing its own word
“Mildliner” now out-searches “Zebra Mildliner” — demand is genericising, and copycats are positioned to intercept it.
02Brand snapshot — UK
The brand at a glance
Monthly revenue (est.)£149,311
Trailing 12-month revenue£2,892,374
Monthly units sold41,711
Active ASINs528
Average price£13.25
Avg sellers per ASIN3.26
Review rating4.51★
Brand Score7.6 / 10
12-month growth+24.1%
Month-over-month growth−17.1%
Reseller concentration is the headline risk
Zebra runs a storefront on Amazon UK but has no single-seller lock on its own listings. A single seller controls 63.2% of brand revenue and the top two control ~85% — third parties are actively reselling alongside, or instead of, any authorised presence. That is a direct lever on price integrity and buy-box control.
Figures are SmartScout modelled estimates for the UK marketplace, July 2026 — not confirmed Amazon sales data.
03Market position by subcategory
Seven categories, three that matter
The top three subcategories account for ~89% of Zebra's UK revenue. Every core category except mechanical pencils lost share month-over-month.
Subcategory
Monthly revenue
Market share
MoM revenue
Retractable Ballpoint Pens· Rank #1
£94,491
12.10%
−£17,398
Ballpoint Pens· Rank #6
£28,056
4.34%
−£10,376
Highlighters· Rank #9
£7,836
2.10%
−£4,905
Gel Ink Rollerball Pens
£4,861
0.55%
−£7,736
Fountain Pens
£2,741
0.79%
−£1,783
Mechanical Pencils· gaining share
£2,635
1.10%
−£347
Ballpoint / Fountain / Pencil Sets· single ASIN
£68
17.51%
−£420
Read this carefully
The Sets row shows a large share swing but is a single ASIN — statistically noisy, not a trend. Mechanical pencils is the only category gaining share, but inside a rapidly shrinking search market. The real story sits in the top three revenue categories on the next pages.
04Competitive landscape — top 3
Where Zebra wins, and where it is exposed
Retractable Ballpoint PensZebra’s stronghold
#1
Zebra Pen
£94,491−0.05
BIC
£78,169+0.57
Parker
£46,866−0.25
Chipate
£32,908+3.15
Paper Mate
£22,816+0.04
Cross
£22,502−0.21
Ballpoint PensWeakest major category
#6
BIC
£89,584−1.30
Parker
£80,999+3.02
Paper Mate
£56,798−1.44
Eziglide
£39,522−0.37
Yoosso
£33,192+2.24
Zebra Pen
£28,056−1.44
HighlightersDisproportionate ad spend
#9
STABILO
£86,016ad 10.8%
STAEDTLER
£39,948ad n/a
BIC
£39,762ad 23.2%
Amazon Basics
£27,496ad n/a
Crayola
£18,577ad n/a
Zebra Pen
£7,836ad 12.3%
05Reseller & distribution
Two sellers control 85% of the brand
A concentrated top plus a long tail of 40+ small sellers is the classic footprint of unauthorised, grey-market resale — a common source of price erosion and diluted brand experience.
This concentration-plus-long-tail pattern is a strong basis for a MAP enforcement and seller-consolidation programme — regaining buy-box control, stabilising price, and consolidating revenue behind an authorised presence.
06Keyword & demand signals
Demand is genericising away from the brand
"Mildliner" now out-searches "Zebra Mildliner"
"mildliner" (generic)
4,538/mo
"zebra mildliner"
3,560/mo
15 brands compete for the generic term versus 10 on the branded one. If Zebra isn't bidding on the generic term, competitors and dupes intercept that demand.
Category terms mapped to Zebra's footprint
Search term
Searches/mo
12-mo trend
Zebra position
"ballpoint pen"
9,568
+2,093
#6 · 4.3% share
"gel pen"
11,137
−937
Not top-3 for Zebra
"rollerball pen"
3,951
−1,214
0.55% share
"highlighter pens"
16,465
+1,016
#9 · 2.1% share
"fountain pen"
56,991
−12,220
0.79% share
"mechanical pencil"
66,798
−7,517
1.1% share, gaining
"Ballpoint pen" (9,568/mo, 29 fragmented brands, no dominant owner) is a clear PPC opening given Zebra's #1 in retractables. Fountain pens and mechanical pencils carry the biggest volume but are in the steepest decline of any term measured — low-reward for growth investment.
07Strengths, weaknesses & opportunities
The honest picture
Strengths
Category leadership in retractable ballpoint pens — £94K/mo, #1 by revenue
Strong review base and rating — 4.51★ across 340K reviews. Trust is not the barrier
Recognised product line (Mildliner) with standalone search demand
Weaknesses
Weak in broader ballpoint pens despite the largest catalogue there (166 ASINs)
Highlighter ad spend is disproportionate to the share it returns
High reseller concentration (2 sellers = 85%) plus an unauthorised long tail
Recent MoM softness across nearly every category
Opportunities — where we go to work
1Defend & expand the retractable lead — audit pricing and conversion at ASIN level as Chipate moves fast.
2Reallocate highlighter ad spend — cut to match realistic share, or fix listing quality and commit.
3Capture the generic "mildliner" term — a direct, low-effort keyword and PPC win.
4Consolidate the reseller base — open a MAP enforcement and seller-monitoring conversation.
5Test the "ballpoint pen" mega-keyword — 9,568/mo, no dominant owner, fragmented field.
6Don’t over-invest in fountain pens or mechanical pencils — huge but fast-declining demand.
Why partner with us
Your growth partner on Amazon
Zebra's brand strength is not in question — a 4.51★ rating across 340K reviews proves the trust is there. The gap is execution: category-level defence, ad efficiency, keyword ownership and distribution control. That is exactly the work we do.
Weeks 1–2Full account audit
ASIN-level pricing, buy-box, and listing health across all seven categories.
Weeks 3–4Distribution control
Map the reseller base and stand up a MAP enforcement plan.
Month 2PPC & keyword ownership
Reclaim "mildliner" and test the "ballpoint pen" mega-term.
OngoingDefend & grow
Protect the retractable lead; monthly share and efficiency reporting.
Brand search, subcategory market share and rankings, seller and offer data, search term volumes and trends, product research.
Go Deeper
Which of these opportunities pays back fastest in the first 90 days
Map every seller on the brand's listings and rank them by revenue and offer count
Show me the branded versus generic search split over 24 months
Build the same analysis for [SECOND PROSPECT] before next week
Where It Gets Soft
Seller data shows offer patterns, not authorisation status. A concentrated top plus a long tail is consistent with grey-market resale, but it is a hypothesis to raise with the brand, not a finding to assert. Keep that framing in a pitch. Revenue and share are modelled estimates rather than confirmed Amazon sales, and this one runs on the UK marketplace, so figures are thinner than US equivalents. Single-ASIN categories swing hard month to month and should be read as noise until a second month agrees.
Turn a Revenue Decline Into a Cold Email That Gets a Reply
Most entries here are single prompts. This one is a repeatable workflow our outbound team runs daily, packaged as two Claude skills that pull live SmartScout data before writing anything.
What It Does
Give it a name, a title, and a company. It searches SmartScout for the strongest divergent signal on that brand, then writes the email around that signal instead of around a pitch.
Divergent is the operative word. A prospect's own top-line revenue is not a hook, because they already know it. What they usually have not seen is the tension: one line declining while the category grows, a competitor climbing in the same subcategory, ad spend rising without sales following, seller count creeping up, a MAP break, a rank shift.
The angle then gets matched to what the title actually owns. An ecommerce director hears about share loss and reseller exposure. A growth lead hears about ad efficiency. An analytics lead hears about visibility gaps in their own reporting. Same underlying data, different framing.
There are two skills. One handles the cold open with no history to work from. The other handles a prospect who went quiet, and its rule is that the follow-up has to arrive with something the first email did not have. Repeating the ask louder does not count.
What Comes Out
Subject [PRODUCT LINE 1] and [PRODUCT LINE 2] down
Hi [FIRST NAME],
[BRAND]'s [PRODUCT LINE 1] lost $18,240 in Amazon revenue last month and [PRODUCT LINE 2] lost $26,910, two lines that haven't come up as headline numbers before but add up to just over $45,000 gone in a single month.
SmartScout tracks revenue and units across every subcategory, so smaller declines like these show up before they get lost inside one blended brand total.
Do you have 20 minutes Thursday at 1pm or Friday at 9am Mountain to walk through where it's concentrated?
Best, Brett
No greeting windup, no platform paragraph, no feature list. The observation opens the email, one line explains why it matters to that seat, and the ask names two specific times.
Why It Works
The subcategory split is the whole trick. Rolled up to one brand total, two declines like these disappear inside a number that looks flat. Split by line, they are a $45,000 hole in a single month, which is specific enough that a stranger reads past the first sentence.
The skills also enforce a writing standard: no colons anywhere including the subject, five words maximum on the subject line, no template jargon, and a banned-phrase list for constructions that read as machine-written no matter what data sits behind them. The bar is that it should read like it was typed between two calls.
Results
Six of our top targets have booked calls off this workflow, together representing roughly $481M/yr in Amazon revenue.
Where It Gets Soft
Revenue and unit figures are estimates, so quote the direction and the rough magnitude rather than presenting a number to the dollar as fact. Parent company names often return nothing, so search the consumer-facing brand instead. And when no divergent signal exists, the honest move is a plain line about what the data covers. A forced hook reads worse than no hook.
Should We Buy This Brand, and What Would We Do With It?
Preview
Using SmartScout and Amazon data, pressure-test Vital Pet Life as an acquisition target and give me a go / no-go view plus the value-creation plan if we buy.
Don't use the Amazon in stock rate metric at all during this analysis
First, establish the baseline:
Trailing-12-mo and monthly revenue, unit velocity, MoM & 12-mo growth.
The 2–3 subcategories where revenue concentrates, and top competing brands in each by revenue (with their share and momentum).
Pull the top ~75 ASINs and quantify revenue concentration (top-5 and top-10 ASIN share of tracked revenue).
Then assess the four things an acquirer underwrites:
REVENUE QUALITY & DURABILITY
Is growth broad-based or dependent on 1–2 hero ASINs / one subcategory?
Search-demand trend for the brand's core terms (growing, flat, fading?).
Seasonality, and any recent step-changes (launches, one-time spikes).
MOAT & DEFENSIBILITY
Review moat (count, rating, velocity) vs. top competitors.
Rank & buy-box stability; is the brand the sole/primary seller?
Share trend vs. competitors — gaining or bleeding.
RISK / RED FLAGS (the reasons to walk)
ASIN or subcategory concentration; single-point-of-failure SKUs.
Catalog/Expansion: adjacent subcategories, new price bands, fast-growing segments the brand is underweight in, international.
Size each lever's plausibility and rough impact where the data allows.
Deliver:
A one-paragraph VERDICT up top: acquire / pass / conditional, with the 2–3 factors driving it and what would change the answer.
An executive summary of the 3–4 most decisive findings.
Sections for Revenue Quality, Moat, Risks, and Value-Creation Levers.
A simple "underwriting scorecard" (Quality / Moat / Risk / Upside, each High-Med-Low) and the levers ranked by impact-vs-effort.
No length limit — build it out as a full report or deck, not one slide.
Include supporting visuals for the key findings. Flag that all figures are SmartScout estimates and month-to-month swings can be promo-driven.
Two details worth copying. The second line tells it to ignore a specific metric, which works and is the fastest way to keep an analysis off a number you do not trust. And asking for a verdict plus "what would change the answer" is what turns a data dump into something an investment committee can act on.
What You Get Back
A full underwriting report with a conditional lean-buy verdict up front. The decisive finding is that a $10.6M brand is really one listing wearing a brand's clothing: the 64oz fish oil ASIN is roughly 60% of revenue and the top two are 91%, across only nine total ASINs. The brand is down 11% year over year while its subcategory grows 12%, so it is donating share to Native Pet and Nutramax. What you would actually be buying is a review moat and buy-box control, sole seller on every ASIN with about 37,000 reviews at 4.5 stars.
The search-term work is the part that changes the deal. The brand's number one term, salmon oil for dogs, is down 26% year over year, while its hero SKU rides fish oil for dogs, up 12%. Consumer language is shifting underneath the catalog.
Preview
Acquisition Underwriting · Amazon Brand Diligence
Vital Pet Life
A pressure-test of the fish-oil-for-dogs brand as an acquisition target — revenue quality, moat, red flags, and the value-creation plan if we own it.
CategoryDog Fish Oil Supplements
Trailing 12-mo revenue~$10.6M
Category rank#6 of 311 brands
PreparedJul 2026 · SmartScout
RecommendationConditional — lean buy
Analysis brief · verbatim request
What was run to produce this
For transparency on scope and method, this is the exact instruction used to generate the diligence below. It was executed live against SmartScout and Amazon marketplace data — no figures were hand-picked; every metric is pulled from the brand, subcategory, product, and search-term APIs.
Prompt · Vital Pet Life acquisition pressure-test
Using SmartScout and Amazon data, pressure-test Vital Pet Life as an acquisition
target and give me a go / no-go view plus the value-creation plan if we buy.
Don't use the Amazon in stock rate metric at all during this analysis

First, establish the baseline:
  • Trailing-12-mo and monthly revenue, unit velocity, MoM & 12-mo growth.
  • The 2–3 subcategories where revenue concentrates, and top competing
    brands in each by revenue (with their share and momentum).
  • Pull the top ~75 ASINs and quantify revenue concentration (top-5 and
    top-10 ASIN share of tracked revenue).

Then assess the four things an acquirer underwrites:
  1. REVENUE QUALITY & DURABILITY
     - Is growth broad-based or dependent on 1–2 hero ASINs / one subcategory?
     - Search-demand trend for the brand's core terms (growing, flat, fading?).
     - Seasonality, and any recent step-changes (launches, one-time spikes).
  2. MOAT & DEFENSIBILITY
     - Review moat (count, rating, velocity) vs. top competitors.
     - Rank & buy-box stability; is the brand the sole/primary seller?
     - Share trend vs. competitors — gaining or bleeding.
  3. RISK / RED FLAGS (the reasons to walk)
     - ASIN or subcategory concentration; single-point-of-failure SKUs.
     - Buy-box suppression, hijackers, 3P sellers, out-of-stock exposure.
     - Declining review velocity, rating erosion, price/margin compression,
       rising competitive intensity, or a shrinking category.
  4. VALUE-CREATION LEVERS (upside if we own it)
     Organize under Content, Pricing, Advertising, and Catalog/Expansion:
     - Content: variation consolidation, A+/listing gaps, suppressed listings,
       weak titles, storefront.
     - Pricing: price-band gaps, trade-up ladders, buy-box/margin recovery,
       under- vs. over-priced vs. category and vs. own catalog.
     - Advertising: ad-spend share vs. market share, branded-term whitespace,
       under-indexed high-volume terms.
     - Catalog/Expansion: adjacent subcategories, new price bands, fast-growing
       segments the brand is underweight in, international.
     Size each lever's plausibility and rough impact where the data allows.

Deliver:
  • A one-paragraph VERDICT up top: acquire / pass / conditional, with the
    2–3 factors driving it and what would change the answer.
  • An executive summary of the 3–4 most decisive findings.
  • Sections for Revenue Quality, Moat, Risks, and Value-Creation Levers.
  • A simple "underwriting scorecard" (Quality / Moat / Risk / Upside, each
    High-Med-Low) and the levers ranked by impact-vs-effort.
No length limit — build it out as a full report or deck, not one slide.
Include supporting visuals for the key findings. Flag that all figures are
SmartScout estimates and month-to-month swings can be promo-driven.
Data sources: SmartScout brand / subcategory / product / search-term & Ad-Spy APIsMarketplace: Amazon USExcluded by request: Amazon in-stock-rate metric
V
The verdict
Conditional — lean acquire, but only at a price that underwrites a declining, hyper-concentrated cash cow, not a growth story.
Vital Pet Life is a clean, high-margin, brand-controlled asset sitting on a deep review moat — but it is a single-ASIN business in disguise, and it is quietly losing share in a category that is otherwise growing. Three factors drive the call:
Concentration is the whole thesis
One SKU (the 64 oz fish oil) is ~60% of revenue; the top two are ~91%. Nine total listings, five that matter. The entire investment is really an underwrite of one listing's durability.
Declining brand, growing category
Brand is −11% YoY while the subcategory is +12%. Native Pet, Nutramax and Pet Honesty are taking the share Vital Pet Life is donating. This is a fixable trajectory — but it is real.
Clean asset, clear levers
Sole seller on every ASIN, stable buy box, 4.5–4.6★ on ~37K reviews. Pricing, content, a cat line, and adjacency demand are all un-pulled. The upside is operator-dependent but concrete.
What would change the answer. A no-go if the seller prices it as a growth asset, or if diligence surfaces fragility in the hero listing — supply/co-pack single-source, trademark/IP gaps, review authenticity, or a variation restructure that could vaporize the 29K-review anchor. A firmer go if the hero ASIN's supply and IP are clean and transferable, DTC (vitalpetlife.com) adds a second channel of scale, and we have an operator lined up to execute the levers in year one.
All revenue, unit, share and search figures are SmartScout estimates. Month-to-month swings are frequently promo- or deal-driven and should not be read as trend on their own. The Amazon in-stock-rate metric was deliberately excluded from this analysis.
E
Executive summary — the decisive findings
The business is one listing wearing a brand's clothing
The 64 oz "Fish Oil for Dogs" ASIN did ~$6.36M of the brand's ~$10.6M trailing-12 (≈60%). Add the 32 oz salmon oil (~$3.31M) and two SKUs are ~91% of everything. There is no "top-75 ASIN" tail to analyze — the brand lists only nine ASINs. Single-point-of-failure risk is the dominant fact of this deal.
Share is bleeding into a rising tide
Category revenue is growing ~12% YoY; Vital Pet Life is −11%. It holds ~6% share (#6 of 311) but is one of the only top brands losing revenue month-over-month, while Native Pet (+$488K/mo), Nutramax and Bark&Spark gain. The brand is a share donor in a market that rewards format innovation and marketing muscle it currently lacks.
Its biggest search term is fading — but its hero rides a growing one
"Salmon oil for dogs" (the brand's #1 term) is down ~26% YoY, and the salmon SKUs that depend on it are exactly the ones eroding. But the hero's term, "fish oil for dogs," is up ~12% and the hero ASIN is essentially flat. Consumer language is shifting salmon→fish-oil/omega-3; the acquisition works only if we lean into the growing framing.
What you're actually buying is a review moat and buy-box control
Sole seller on all ASINs, buy box held at $49.95 / $34.95 unchanged for two years, ~37K reviews at 4.5–4.6★ on the two hero listings. That's a durable, transferable asset a new entrant can't replicate quickly — and it's the foundation the value-creation plan builds on.
01
Baseline
Scale, velocity, and where the money actually comes from.
$10.6M
Trailing-12 revenue (est.)
$628K
Latest monthly revenue
−8%
Revenue MoM
−11%
Revenue 12-mo
~19K
Units / month
9
Total ASINs (5 meaningful)
1.0
Sellers per ASIN — sole seller
4.48★
Brand avg rating
Weekly revenue, two years
Gentle erosion, not collapse — a flat hero masking a shrinking tail. Seasonal dips are promo/Prime-driven.
Where revenue concentrates: one subcategory, one SKU
~99% of tracked revenue sits in Dog Fish Oil Supplements; the remaining ~1% is scattered across a few adjacent pet-supplement subcategories and is rounding error. There is effectively no subcategory diversification to speak of — the "2–3 subcategories" the brand spans are one subcategory plus noise. Within it, the hero 64 oz fish oil and the 32 oz salmon oil carry the business; the 16 oz and 8 oz salmon SKUs are small and shrinking.
Competitive set — Dog Fish Oil Supplements ($9.9M/mo, 311 brands)
Monthly market share. Bars mark momentum: gaining, losing, flat. Vital Pet Life sits mid-pack and is sliding.
Top competitors by revenue and momentum: Zesty Paws 18% (declining leader), Native Pet 12% (surging, +$488K/mo), Nordic Naturals 10%, Nutramax 8% (+, highest ad spend), Natural Dog Company 7%. Vital Pet Life 6% and losing ~$66K/mo.
02
Revenue quality & durability
Is the revenue broad-based and durable, or one listing away from a step-change?
Not broad-based. Growth and decline both trace to a handful of SKUs. The hero 64 oz is roughly flat (−0.6% TTM) and rides a growing query. The 32 oz salmon oil is down ~10% TTM (−$345K), and the smaller salmon SKUs have lost 50–60% of their units over two years. So the brand's decline is really salmon-line erosion partly offset by a stable hero.
Demand is diverging under the brand's feet. The single largest search term, "salmon oil for dogs" (~72K/mo), is down ~26% YoY. Meanwhile "fish oil for dogs" (~63K/mo) — where the hero ranks #2 organically — is up ~12%. Consumer language is migrating from "salmon oil" toward "fish oil / omega-3." Two of the brand's ASINs are positioned on the fading term.
Seasonality & step-changes. Mild seasonal lift late summer/early fall (shedding and skin-allergy season) and around Prime events; the sharp single-week dips are promo cadence, not trend. No evidence of a one-time spike propping up the trailing-12 — the base is real and recurring, which is good for durability of the floor even as the ceiling drifts down.
Demand divergence — YoY search growth
The category and the hero's term are growing; the brand's flagship "salmon" term is not.
Durable
Recurring, subscription-friendly consumable. Hero ASIN listed since 2021, sits top-15 in subcategory, rides a growing term. Deep reviews defend the floor.
Watch
No branded search demand — buyers search the category, not the brand. Revenue is discovery-driven, so it lives and dies by organic rank and ads, not loyalty.
Fragile
60% of revenue on one listing tied to one co-pack and one buy box. Any rank suppression, supply gap, or variation misstep on that ASIN is a company-level event.
03
Moat & defensibility
What stops the next well-funded entrant from taking this shelf?
~37K
Reviews on the two hero listings
4.5–4.6★
Hero ratings
1 seller
On every ASIN — no hijackers, no 3P leakage
2 yrs
Buy box price unchanged & uncontested
Real, and transferable
Review depth. The 32 oz salmon oil carries ~29K reviews and the hero ~8.6K — among the deepest in the category (per-ASIN reviews second only to Zesty Paws). That's years of social proof a challenger can't buy.
Clean ownership. Sole FBA seller on all ASINs, buy box fully controlled, price rock-steady. For an acquirer this is the ideal shape: no gray-market erosion, no MAP wars, no buy-box roulette to inherit.
Organic rank. Hero ranks #2 on "fish oil for dogs," #4 on "salmon oil for dogs," #1 on "dog fish oil supplements." That real estate is the moat's active ingredient.
Thinner than it looks
No brand equity. Competitors own branded demand — thousands of monthly searches for "Zesty Paws," "Native Pet," "Nordic Naturals," "Welactin." Vital Pet Life generates essentially none. The moat is listing-and-review based, not brand-based; it protects the shelf, not the customer.
Format exposure. The brand is liquid-only while the fastest growers (Native Pet, Zesty Paws) win with chews/soft-chews. A format shift is the most credible way a competitor routes around the review moat.
Rank volatility. The hero bounces between ~800 and ~1,050 with brief spikes past 1,200 — healthy but not fortress-like; it must be defended with spend.
Net: a medium moat. Strong enough to protect a stable cash flow for years; not strong enough to assume the brand compounds on its own. It buys time to execute, not a pass on execution.
04
Risks & red flags — the reasons to walk
Ranked by how much each could impair the thesis.
Severity: critical
1 · Single-point-of-failure catalog
60% of revenue on one ASIN, 91% on two, one subcategory at 99%, nine SKUs total. There is no diversification cushion. A listing suppression, ingredient/supply disruption, or a botched variation change on the hero is an existential event, not a bad quarter. This alone caps the multiple you should pay.
Severity: high
2 · Losing share in a growing category
−11% brand vs +12% category. The share is moving to better-marketed, chew-format rivals. Absent intervention, the trajectory continues — you'd be buying a melting (slowly) ice cube unless the levers are executed.
Severity: medium
3 · Positioning tied to a fading query
"Salmon oil for dogs" −26% YoY drags two SKUs. The fix (re-SEO toward "fish oil / omega-3") is cheap, but the exposure is real today and the salmon line will keep eroding until it's addressed.
Severity: medium
4 · No brand pull + format gap
Zero meaningful branded search and a liquid-only lineup while the category shifts to chews. The brand competes purely on shelf position, which must be rented with ads at $5–$10 CPCs.
Severity: low / clean
5 · Buy box & sellers — no issue found
No hijackers, no buy-box suppression signal, no 3P sellers competing on-listing, no price war. Two years of stable, uncontested buy box. A rare clean bill on the usual Amazon landmines.
Severity: diligence item
6 · Confirm in diligence
Co-pack/supply single-sourcing on the hero; trademark & listing ownership; review authenticity; DTC channel size and profitability; and whether the 32 oz variation family is structurally stable (its review anchor is worth protecting).
05
Value-creation levers — the upside if we own it
Organized by Content, Pricing, Advertising, and Catalog/Expansion, with rough sizing where the data supports it.
Content
Fix the hero listing. The 64 oz page scores 7.8 while the 32 oz sibling scores 9.0 — lift title, A+, and imagery to match. On a $6.36M ASIN, a ~5% conversion gain is ~$300K.
Re-SEO the salmon SKUs toward "fish oil / omega-3" framing to arrest the −26% term decline.
Storefront + adjacency copy for skin/itch/allergy/shedding use-cases the product solves but doesn't rank for.
Pricing
Raise the hero. $49.95 held for two years; brand avg $27.95 sits below premium peers ($37–$43). A modest +6% with sole-seller control likely holds → ~$300–380K near-pure margin.
Premium "wild Alaskan" tier — high-intent term, 46% top-3 conversion, $9.79 CPC; a trade-up SKU captures willingness-to-pay the value line leaves behind.
Subscribe & Save + bundles to lift LTV and stabilize the eroding SKUs.
Advertising
Under-indexed on spend (~5% ad share vs 6% market share) in a category where the top-3 capture only ~21–30% of conversions — it's winnable, if CPCs ($5–$6 head, up to $10) are managed.
Adjacency whitespace — itch/allergy/shedding/coconut-oil terms where the hero sits rank 30–45 organically.
Catalog / Expansion
Dedicated cat line. The brand already ranks #2–3 on "salmon oil for cats" (23K), "fish oil for cats" (14K), "omega-3 for cats" (15K) with no cat-specific listing. A purpose-built cat SKU could add $0.5–1M+.
Soft-chew format — the biggest strategic bet and the category's growth engine (Native Pet). Highest effort/capex; builds a second moat.
Spanish-language listing — "aceite de salmón para perros" ~8K/mo, low-effort capture.
Impact vs. effort
Bubble number = priority rank. Start upper-left: content and pricing are near-free and land fast; the cat line is the biggest defensible add; soft-chews are the high-cost strategic bet.
STRATEGIC BETSQUICK WINSLOW PRIORITYImpact ↑Effort — lowEffort — high →
1
Hero listing / content fix
2
Hero price +6% & margin recovery
3
Dedicated cat line
4
Adjacency + conquest PPC/SEO
7
Soft-chew format line
5
Re-SEO salmon SKUs + Subscribe&Save
6
Spanish-language listing
Levers ranked — impact vs. effort
#
Lever
Impact
Effort
Rough size
1
Hero content / listing fix
High
Low
~$300K
2
Hero price +6% & margin recovery
High
Low
~$300–380K
3
Dedicated cat line
High
Med
$0.5–1M+
4
Adjacency + conquest advertising
Med
Med
$0.2–0.5M
5
Re-SEO salmon SKUs + Subscribe&Save
Med
Low
Defensive
6
Spanish-language listing
Low–Med
Low
~$0.1M
7
Soft-chew format line
High
High
Strategic / new moat
Sizes are directional order-of-magnitude estimates from SmartScout demand and revenue data, not a model. The first two levers are near-free and could plausibly offset the current decline on their own; levers 3 and 7 are what turn a stabilized cash cow into a growth story.
S
Underwriting scorecard
Revenue quality
Low–Med
Recurring & real, but declining and undiversified. Floor is solid; ceiling is drifting down.
Moat
Medium
Deep reviews + sole-seller buy-box control. No brand equity; format-flanked.
Risk
High
Concentration + share loss. High risk = discipline on price, not a walk on its own.
Upside
Med–High
Several concrete, ownable levers. Operator-dependent, but the roadmap is clear.
Underwriting stance. Buy on SDE/EBITDA with a concentration discount, not on peak or headline revenue. Price the −11% trajectory into the base case and treat the levers as upside you earn, not value you pay for. If the hero ASIN's supply and IP clear diligence and DTC adds real scale, this is an attractive, cash-generative tuck-in with a credible path back to growth. If it's priced as a grower, pass.
Data It Touches
Brand search, market share and subcategory competitive sets, product research at the ASIN level, search term history, ad spy.
Go Deeper
Rank the value-creation levers by impact against effort in year one
Show me the review velocity trend against the top three competitors
What is the cat-line adjacency worth if we launch into it
Run the same pressure test on [SECOND CANDIDATE] so I can compare
Where It Gets Soft
Revenue, unit, share, and search figures are estimates. Month-to-month swings are often promo or deal driven and should not be read as trend on their own. The prompt asked for the top 75 ASINs and the brand only lists nine, which the analysis handled fine, but it is a reminder that a template written for a big catalog needs a sanity check on a small one.
Find Acquisition Candidates in Pet Supplements
Preview
Using SmartScout and Amazon data, build me a shortlist of acquisition targets that fit this thesis:
Category / niche: pet supplements
Revenue band: $3M–$25M trailing-12-mo
Growth: flat-to-positive 12-mo; not collapsing
Ownership signal: prefer single-seller / high own-buy-box brands (clean cap table, not a reseller free-for-all)
Anything to exclude: heavy seasonality, sub-4.2 stars
Screen the brand universe on SmartScout and return a RANKED shortlist of 10–15 candidates. For each, pull and reason over:
Size & trajectory — trailing-12-mo revenue, monthly run-rate, MoM and 12-mo growth, and whether growth is broad or one-ASIN-driven.
Ownership cleanliness — # sellers per ASIN, FBA seller count, buy-box control / suppression, single-seller flag. Flag brands where 3P sellers or hijackers hold the buy box (messy to acquire).
Moat — review count & rating, review velocity, rank stability, brand score, and how concentrated revenue is (top-5 ASIN share, subcategory count).
Fit-to-thesis score (1–5) with a one-line "why this could be a good buy" and the single biggest red flag.
Organize output as:
A ranked table (rank, brand, category, rev, growth, #sellers, rating, top-ASIN concentration, fit score).
A short "top 3 to prioritize" write-up with the deal angle for each.
A "screened out / watch" list with the disqualifying reason.
Lead with a 3–4 bullet read on where the best opportunities cluster in this thesis and why. Multi-section report is fine — no length limit. Include supporting visuals (concentration, growth, competitive-intensity) where they sharpen the point. Note that all figures are SmartScout estimates.
What You Get Back
A full screen of roughly 2,300 brands across the dog, cat, and horse supplement nodes, narrowed to the 25 sitting inside the revenue band and the 13 that clear the thesis. Ranked table, a growth-versus-concentration scatter, competitive intensity bars, three prioritized targets with deal angles and red flags, plus a watch list and screened-out list with reasons.
Pet supplements: a ranked shortlist of buy-side targets
A brand-level screen of the Amazon pet-supplement universe against a single-owner, clean-buy-box, durable-growth thesis. From ~2,300 brands across the dog, cat, and horse supplement nodes, 25 sit inside the revenue band; 13 clear the bar.
Niche
Pet supplements
Rev band (TTM)
$3M – $25M
Growth
Flat-to-positive
Ownership
Single-seller / own BB
Exclude
Seasonal · <4.2★
01
Where the opportunity clusters
Four reads on the shape of the deal set before the individual names.
Read 01 · Ownership is not the constraint
Buy-box control is table stakes here — durability is the real filter
~20 of the 25 in-band brands run ≤1.3 sellers per listing with Amazon off the listing (in-stock-rate ≈ 0), so clean cap tables are the norm, not the exception. The differentiator that actually separates targets is growth durability and SKU concentration — not whether a hijacker holds the buy box.
Read 02 · Two distinct profiles
Stable "franchise" brands vs. hero-SKU rockets
The top of the board splits cleanly: (a) scaled, single-owner franchises anchored by a branded hero line — Bernie's Perfect Poop, Wholistic's organic vitamins, Revival — compounding ~8–13%; and (b) fast movers riding a format/ingredient wave (chews +96%, liquid collagen +122%, functional mushrooms +570–740%) where concentration and a <2-year track record are the tax on the upside.
Read 03 · Format & ingredient tailwinds
Soft chews, liquid omega/collagen, functional mushrooms are pulling the category
The dog fish-oil node ($131M TTM, +12%) and dog herbal node ($76M TTM, +45%) are both larger and faster than powder multivitamins. Cat supplements ($82M TTM, +41%) are an under-shopped adjacency. Category revenue is ~78% seller-owned (not Amazon), which is exactly what you want when buying independent brands.
Read 04 · Risk-adjusted takeaway
Buy the broad-catalog compounders; option-value the rockets
The cleanest risk-adjusted entries pair single ownership with broad SKU spread and a review moat — Chew + Heal, Wholistic, Revival, Rx Vitamins. The highest-return / highest-variance entries are the sub-two-year, single-hero spikes (Pets Are Kids Too, Petsology, SalutemPet). Size those as options, not as the core of a roll-up.
02
The opportunity map
Every candidate carries the same tension: growth on one axis, single-SKU concentration risk on the other. Bubble area is TTM revenue; color is fit-to-thesis. The sweet spot is upper-right — growing and broad.
Fit 5Fit 4Fit 3○ bubble = TTM revenue*Petsology +570% plotted at right edge
Competitive intensity
Avg. sellers per listing. ~1.0 = clean single-seller / own buy-box. Screened-out names shown for contrast.
VetSmart
0.82
Rx Vitamins
0.85
GoodGrowlies
0.89
Tomlyn
0.91
Wonder Paws
0.94
Revival
0.96
Chew + Heal
0.93
Wholistic
1.05
Four Leaf Rover
1.15
Petsmont
1.20
Bernie's
1.57
HomeoPet
2.42
Vet Classics
2.38
Grizzly ✕
3.36
Ceva ✕
5.60
✕ = screened out on ownership. 3P sellers on the listing make the buy box (and the deal) messy.
03
Ranked shortlist
13 brands clearing the thesis, ranked on a blend of clean ownership, durable (broad) growth, size, moat, and low single-SKU concentration. Fit 1–5. All figures SmartScout estimates; run-rate = latest monthly revenue.
#
Brand
TTM rev
Run-rate/mo
MoM
12-mo
Sellers/listing
Rating
Reviews
Brand score
Top-ASIN conc.
Fit
1
Bernie'sDog digestive
$16.5M
$1.00M
−8%
+13%
1.6 (1 FBA)
4.41
15,770
8.4
~48% hero line
5
2
Chew + Heal LabsDog fish oil
$11.8M
$984K
−1%
+96%
0.9 (0.9 FBA)
4.28
28,834
8.2
Low · 128 SKUs
5
3
Wholistic Pet OrganicsDog multivitamin
$5.6M
$467K
~0%
+13%
1.1 (1 FBA)
4.44
10,536
8.9
Low · 59 SKUs
5
4
Wonder PawsDog fish oil / collagen
$7.5M
$567K
−20%
+122%
0.9 (0.9 FBA)
4.34
17,417
8.2
~26% collagen hero
4
5
Revival Animal HealthDog multivitamin
$5.8M
$363K
−5%
+8%
1.0 (0.7 FBA)
4.47
25,814
8.4
Low · 80 SKUs
4
6
VetSmart FormulasDog herbal
$4.4M
$238K
−2%
+52%
0.8 (0.6 FBA)
4.30
5,428
7.7
Mod · 11 SKUs
4
7
Four Leaf RoverDog herbal · DTC-native
$4.6M
$312K
−10%
+24%
1.2 (1 FBA)
4.27
6,330
8.8
Mod · 26 SKUs
4
8
TomlynDog multivitamin · legacy
$4.5M
$359K
+2%
+13%
0.9 (0.9 FBA)
4.40
34,578
8.1
Mod
4
9
PetsmontDog herbal
$4.8M
$311K
−17%
+39%
1.2 (1 FBA)
4.26
4,059
8.4
High · 5 SKUs
3
10
PetsologyMultivitamin
$5.1M
$620K
+8%
+570%
0.5 (0.5 FBA)
4.43
11,792
8.3
High · hero spike
3
11
HomeoPetMultivitamin · homeopathic
$5.3M
$320K
−5%
+1%
2.4 (1 FBA)
4.22
85,241
7.9
Low · 45 SKUs
3
12
Rx VitaminsMultivitamin · vet channel
$4.0M
$262K
−7%
+2%
0.9 (0.8 FBA)
4.33
14,559
7.8
Low · 71 SKUs
3
13
GoodGrowliesDog fish oil
$3.9M
$207K
−21%
+18%
0.9 (0.9 FBA)
4.25
19,406
8.3
Mod · 47 SKUs
3
Concentration note: "Hero line" = variations (flavor/size) of one branded parent product. Bernie's ~$656K/mo of its ~$1.0M runs through the Perfect Poop family; Wonder Paws' collagen SKU is ~$165K of ~$567K. Broad names (Chew+Heal, Wholistic, Revival, Rx) spread revenue across dozens of SKUs — materially lower single-point-of-failure risk.
04
Top 3 to prioritize
The three with the best balance of scale, clean ownership, and defensibility — and the specific angle to run on each.
PRIORITY 01Bernie's · Bernie's Best, Inc.
$16.5M
TTM · SmartScout est.
12-mo growth
+13%
Sellers / listing
1–2 · 1 FBA
Rating
4.41★
Hero-line share
~48%
Fit
5 / 5
Deal angle
The largest genuinely-clean target in the band, and the only one already operating as a franchise. The Perfect Poop digestive line (a #3-ranked sub-category product, ~13k reviews at 4.4★, Amazon off the listing) throws off ~$656K/mo and funds three growing adjacencies — dental chews (+16–42%), joint chews, and a new omega line (+182%). You're buying a proven brand engine plus an early, still-cheap product-extension flywheel. Own-buy-box across the catalog means the revenue is real and defensible day one, and the sub-brand naming ("Perfect Poop," "Charming Chompers," "OMG! Omegas") is portable into new formats.
Biggest red flag
~48% of revenue funnels through the single Perfect Poop parent line; the flagship 12.8oz SKU is already down −20% TTM. Diligence must confirm the adjacencies keep compounding, or the whole thesis rests on one digestive product's shelf-life.
PRIORITY 02Chew + Heal Labs · chewandheal.com
$11.8M
TTM · SmartScout est.
12-mo growth
+96%
Sellers / listing
0.9 · 0.9 FBA
Rating
4.28★
Catalog
128 SKUs
Fit
5 / 5
Deal angle
The rare combination of fast (+96% TTM) and broad (128 SKUs, revenue spread across 30+ ASINs even inside one node). This is a scaled, single-seller soft-chew platform with a 28.8k-review moat and near-zero 3P/Amazon presence on its listings — the growth isn't a single lucky SKU, it's a repeatable formulation-and-launch machine riding the chews tailwind. Weekly revenue has held ~$100K in the fish-oil node with a mild uptrend, so the deceleration risk that usually shadows a +96% brand is muted. Best "buy the engine" candidate in the set.
Biggest red flag
The single largest volume driver is a $9.98 chew moving ~2,000+ units/week — great for rank and reviews, thin on margin. Underwrite the blended contribution margin, not the top line; a chunk of the growth may be low-price traffic products subsidizing the catalog.
PRIORITY 03Wholistic Pet Organics · wholisticpetorganics.com
$5.6M
TTM · SmartScout est.
12-mo growth
+13%
Sellers / listing
1.0 · ISR ~0
Rating
4.44★
Brand score
8.9 (top)
Fit
5 / 5
Deal angle
The cleanest, lowest-risk brand on the board — the "quality compounder." Listed since 2013, highest brand score in the set (8.9), 4.44★, and revenue spread across 59 SKUs (mostly size/format variations of a core organic-vitamin line), every one single-seller with Amazon effectively absent. Premium price points ($35–$100) signal real pricing power and a defensible "organic / made-in-USA" positioning that survives category commoditization. Nothing here is riding a fad; it's a durable, margin-friendly base to bolt faster-growing brands onto in a roll-up.
Biggest red flag
Powder multivitamins are the slower-growing corner of the category, and absolute size is modest ($5.6M). This is a platform anchor or margin ballast — not the growth engine of the portfolio. Pay an anchor multiple, not a growth multiple.
05
Watch list & screened out
In-band names held back for a fixable reason (watch), and names disqualified outright on the thesis's hard rules.
Watch softening / re-check next quarter
Natural Dog CompanyDog fish oil · $19.8M · 166k reviews−15% TTM. Biggest in-band brand but off its peak; a value/turnaround angle if it stabilizes.
Vital Pet LifeDog fish oil · $10.6M−11% TTM. Clean single-seller salmon-oil brand in decline — watch for a base.
Vet PromiseMultivitamin · $4.9M−2% TTM. Clean but drifting flat-to-down; borderline on "not collapsing."
planopawsDog fish oil · $4.0M−8% TTM, −8% MoM. Softening on both horizons.
Native Pet · Pet Honesty · Nutramax · Zesty PawsAbove the band$46M / $62M / $100M+ TTM — over the $25M ceiling.
Data It Touches
Brand search, market share and subcategory profiles, product research at the ASIN level for the priority names.
Go Deeper
Pressure test [TOP CANDIDATE] on revenue quality, durability, and value-creation levers
Which of these depend on a single hero product, and how exposed is each one
Show me revenue seasonality over 24 months for the top three
Re-run the screen in [ADJACENT CATEGORY] with the same thesis
Where It Gets Soft
Revenue figures are estimates, so widen your band rather than filtering a real target out at the edges. Top-ASIN concentration is the number to diligence hardest, since it drives the whole risk picture and needs confirming against Seller or Vendor Central before an LOI. Growth rates above roughly 100% usually trace to a single recent SKU launch rather than broad momentum.
The 100 companies that would leave the biggest hole in the marketplace seller ecosystem if they disappeared, across Amazon, Walmart Marketplace and TikTok Shop. Scored on sourced data as of November 2026.
About the List
The SmartScout Marketplace 100 ranks the companies that would leave the biggest hole in the marketplace ecosystem if they disappeared: the brands, software, agencies, service providers, financiers and communities that third-party sellers depend on.
It was inspired by the Marketplace Pulse 100, published in November 2020. This is an independent rebuild by SmartScout. It is not affiliated with or endorsed by Marketplace Pulse.
A lot has changed since 2020. Walmart Marketplace and TikTok Shop now have their own ecosystems of partners, so this list covers them alongside Amazon. Social commerce, AI tools and cross-border selling have become categories of their own. About a third of the 2020 names have since been acquired, merged, renamed or shut down.
Instead of editorial judgement, every company is scored on the same five pillars: size, reach, team, influence and capital.
Every input has a source, a date and a status, and readers can check any score in the full dataset.
The Full 100
Scores are 0-100 composites.
Change for successors is measured against the best-ranked 2020 predecessor.
#
Company
Category
Score
2020
Change since 2020
1
Anker
Sellers
91.46
#1
Same
2
Pattern
Sellers
82.78
#15
Up 13
3
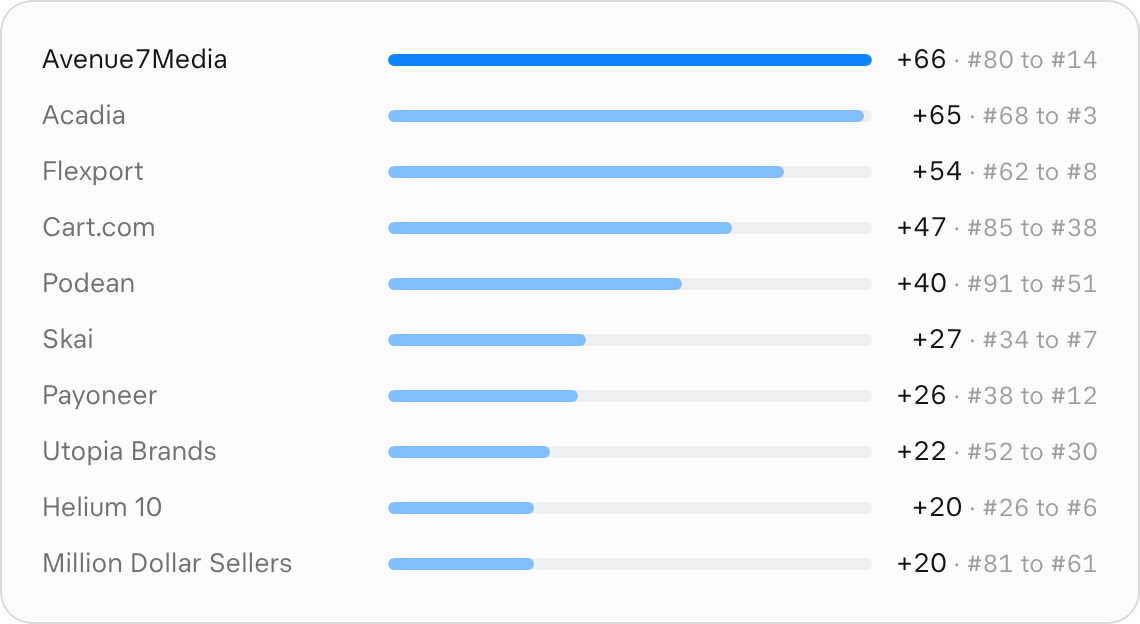
Acadia
Agencies
81.95
#68
Up 65 (successor of Bobsled Marketing #68)
4
Tinuiti
Advertising
78.36
#7
Up 3
5
Jungle Scout
Research Tools
76.64
#6
Up 1
6
Helium 10
Research Tools
76.63
#26
Up 20
7
Skai
Advertising
75.99
#34
Up 27
8
Flexport
Fulfillment
75.48
#62
Up 54
9
Rithum
Management Tools
75.27
#9
Same (successor of CommerceHub #9, ChannelAdvisor #12)
10
Harvest Group
Agencies
73.84
New
11
EasyPost
Fulfillment
73.83
New
12
Payoneer
Finance
73.58
#38
Up 26
13
PingPong
Cross-border
73.26
New
14
Avenue7Media
Agencies
72.85
#80
Up 66 (successor of Cascadia Seller Solutions #80)
15
Mirakl
Management Tools
72.19
New
16
Base.com
Management Tools
72.18
New
17
Teikametrics
Advertising
71.82
#4
Down 13
18
ShipStation
Fulfillment
71.71
#25
Up 7
19
Govee
Sellers
70.96
New
20
Azoma
AI Tools
70.75
New
21
Threecolts
Acquirers
70.58
#20
Down 1 (successor of CedCommerce #20, Seller Locker #100)
22
Pacvue
Advertising
70.24
#31
Up 9
23
Flywheel Digital
Advertising
70.20
#17
Down 6
24
Feedonomics (Commerce.com)
Management Tools
70.17
New
25
FRONT ROW
Sellers
70.15
New
26
Canopy Management
Agencies
69.78
New
27
Freightos
Fulfillment
69.72
#39
Up 12
28
SellerX
Acquirers
69.63
New
29
Keepa
Research Tools
69.06
New
30
Utopia Brands
Sellers
68.89
#52
Up 22
31
My Amazon Guy
Agencies
68.54
New
32
FastMoss
Social Commerce
67.92
New
33
Stackline
Research Tools
67.88
New
34
UGREEN
Sellers
67.54
New
35
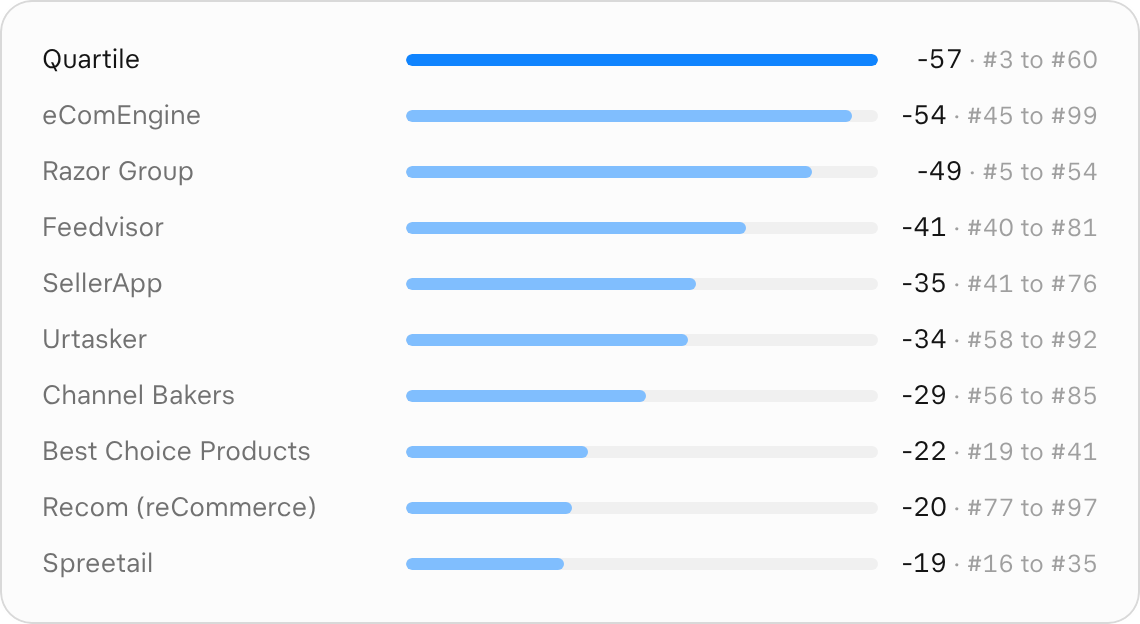
Spreetail
Sellers
67.49
#16
Down 19
36
Celigo
Management Tools
67.47
New
37
Kintsugi
Compliance (Legal & Tax)
67.24
New
38
Cart.com
Acquirers
67.20
#85
Up 47 (successor of SellerActive #85)
39
Salsify
Management Tools
66.78
#29
Down 10
40
Sellercloud + Finale Inventory (Descartes)
Management Tools
66.35
#28
Down 12
41
Best Choice Products
Sellers
66.32
#19
Down 22
42
Linnworks
Management Tools
66.06
#36
Down 6 (successor of SkuVault #36)
43
SalesDuo
Agencies
65.88
New
44
Flippa
Finance
65.82
New
45
Pirawna
Agencies
65.74
New
46
Channable
Management Tools
65.17
New
47
Sports Research
Sellers
64.99
New
48
Bedsure
Sellers
64.89
New
49
ChannelEngine
Management Tools
64.64
New
50
Comfrt
Sellers
64.44
New
51
Podean
Agencies
64.31
#91
Up 40
52
Numeral
Compliance (Legal & Tax)
64.28
New
53
Jackery
Sellers
64.18
New
54
Razor Group
Acquirers
64.16
#5
Down 49 (successor of Juvo+ #5, Perch #32)
55
Optiwise.ai
AI Tools
63.59
New
56
Titan Network
Community
63.17
New
57
Ecomcy
Agencies
62.93
New
58
Taxually
Compliance (Legal & Tax)
62.71
New
59
Pipe17
Management Tools
62.31
New
60
Quartile
Advertising
61.54
#3
Down 57
61
Million Dollar Sellers
Community
61.52
#81
Up 20
62
GlobalBees
Acquirers
61.29
New
63
Kalodata
Social Commerce
61.23
New
64
Micro Ingredients
Sellers
61.12
New
65
Extensiv
Management Tools
60.78
#50
Down 15 (successor of Skubana #50)
66
World of Books
Sellers
60.37
New
67
Profitero (Publicis)
Research Tools
60.35
New
68
Carbon6 (SPS Commerce)
Acquirers
60.25
#65
Down 3 (successor of ManageByStats #65)
69
Euka
Social Commerce
60.09
New
70
AMZScout
Research Tools
60.09
#61
Down 9
71
Detroit Axle
Sellers
60.03
New
72
Momcozy
Sellers
59.90
New
73
BQool
Management Tools
59.66
#59
Down 14
74
Physician's Choice
Sellers
59.34
New
75
Epinium
AI Tools
58.99
New
76
SellerApp
Management Tools
58.82
#41
Down 35
77
PickFu
Research Tools
58.77
New
78
MediaLabs
Social Commerce
58.39
New
79
JoyinDirect
Sellers
58.37
New
80
Reacher
Social Commerce
58.22
New
81
Feedvisor
Management Tools
58.16
#40
Down 41
82
CommerceIQ
Advertising
58.08
New
83
LitCommerce
Management Tools
57.97
New
84
Spigen Inc
Sellers
57.74
New
85
Channel Bakers
Agencies
57.64
#56
Down 29
86
SmartScout
Research Tools
57.44
New
87
AVASK / e-Comas
Cross-border
57.18
New
88
Merama
Cross-border
57.17
New
89
Wayflyer
Finance
57.15
New
90
Nectar
Agencies
57.11
New
91
Superfuel AI
AI Tools
56.66
New
92
Urtasker
Agencies
56.59
#58
Down 34
93
A2X
Management Tools
56.58
New
94
Eccang
Cross-border
56.28
New
95
ASGTG
Community
56.10
#88
Down 7
96
3Dsellers
Management Tools
55.55
New
97
Recom (reCommerce)
Sellers
55.28
#77
Down 20
98
Cabilly & Co.
Agencies
55.00
New
99
eComEngine
Management Tools
54.98
#45
Down 54
100
Levanta
Advertising
54.98
New
#100 is Levanta (54.98), just ahead of #101 ROI Revolution (54.84). Pirawna (#45) is now part of Power Digital, and A2X (#93) has been part of Cin7 since 2024. All 229 ranked companies, with their pillar scores, are in the full dataset.
What Changed Since 2020
Who Is in the 2026 List
What Happened to the 2020 Top 100
61 of the 100 are new since 2020. Of the 30 returning names, 13 moved up, 16 moved down and 1 held its rank. Another 9 places go to companies that absorbed 2020 names.
Biggest Risers Since 2020
Biggest Fallers Since 2020
The 2020 Names That Are Gone
Thrasio (2020 #2), the best-known Amazon aggregator, filed for Chapter 11 in February 2024, sold 48 brands to Inversal that December and reportedly wound down in November 2025.
Deliverr (#10) was bought by Shopify in 2022, then sold to Flexport in June 2023. Flexport is now #8.
Sellics (#8) merged into Perpetua (#14), which Flywheel Digital bought in 2024. Flywheel is #23.
CommerceHub (#9) and ChannelAdvisor (#12) combined and became Rithum in December 2023, now #9.
Bobsled Marketing (#68) became Acadia, now #3: the biggest climb of any 2020 name.
Juvo+ (#5) and Perch (#32) are now part of Razor Group (#54). Pharmapacks (#13) was liquidated in 2022.
2020
Company
What happened
Now
#2
Thrasio
Bankrupt
Chapter 11 in Feb 2024; 48 brands sold to Inversal in Dec 2024; reported wind-down Nov 2025
#5
Juvo+
Merged
Now Razor Group (#54)
#8
Sellics
Acquired
Into Perpetua, then Flywheel Digital (#23)
#9
CommerceHub
Rebranded
Rithum (#9), Dec 2023
#10
Deliverr
Acquired twice
Shopify (2022), then Flexport (#8), Jun 2023
#12
ChannelAdvisor
Acquired
Combined with CommerceHub, now Rithum (#9)
#13
Pharmapacks
Liquidated
2022
#14
Perpetua
Acquired
Flywheel Digital (#23), Jan 2024
#20
CedCommerce
Acquired
Threecolts (#21), Sep 2024
#24
Heyday
Merged
Essor (not ranked), Sep 2024
#30
TaxJar
Acquired
Stripe, Apr 2021
#32
Perch
Merged
Razor Group (#54)
#36
SkuVault
Acquired
Linnworks (#42), Sep 2022
#42
Wunderman Thompson Commerce
Merged
VML (WPP), Jan 2024
#44
Cymax Group
Receivership
Oct 2026
#47
BigCommerce
Rebranded
Now Commerce, Aug 2025 (not marketplace-first, so not ranked)
#48
Viral Launch
Acquired, then shut
Worldeye Technologies (2023); reported shut Dec 2025
#49
Buy Box Experts
Acquired
Spreetail (#35), Sep 2022
#50
Skubana
Acquired
Extensiv (#65), Apr 2021
#65
ManageByStats
Acquired
Carbon6 (#68)
#66
Kaspien (etailz)
Wound down
May 2024
#68
Bobsled Marketing
Rebranded
Acadia (#3), Mar 2022
#72
Marketplace Strategy
Acquired
Code3 (not ranked), Aug 2018
#80
Cascadia Seller Solutions
Acquired
Avenue7Media (#14), Mar 2022
#85
SellerActive
Acquired
Cart.com (#38), Jan 2022
#86
Retail Bloom
Merged
Blue Wheel (#124), Jan 2023
#89
DataHawk
Acquired
Worldeye Technologies (#229), Apr 2025
#90
BuyBoxer
Wound down
2022
#93
Sellozo
Acquired
Netrush (#198), Oct 2021
#97
EliCommerce
Acquired (reported)
Lero, Dec 2021
#99
Downstream
Acquired
Jungle Scout (#5), Mar 2021
#100
Seller Locker
Acquired (reported)
Threecolts (#21)
2020 Names Ranked Outside the Top 100
2020
Company
Rank now
#35
ROI Revolution
#101
#55
eDesk
#102
#95
GETIDA
#114
#37
Seller Labs
#121
#67
Blue Wheel
#124
#73
SellerEngine
#127
#11
ThriftBooks
#135
#92
Flieber
#150
#70
Algopix (Cluster)
#151
#57
Zentail
#158
#54
Sellbrite
#159
#43
Payability
#160
#84
Riverbend Consulting
#161
#75
Red Stag Fulfillment
#164
#64
Informed Repricer
#166
#98
Sourcify
#175
#74
GoDataFeed
#176
#69
CrazyLister
#177
#78
GeekSeller
#184
#60
Boosted Commerce
#188
#94
Listing Mirror
#195
#33
Netrush
#198
#63
MerchantWords
#206
#76
SellersFi
#208
#22
Vir Ventures
#217
#79
Amazzia
#219
#87
Profit Whales
#221
Eleven more 2020 names are not ranked: Shopify is excluded as a storefront platform and Avalara as a general sales-tax and compliance company, rather than marketplace businesses; ShipBob and ShipMonk are excluded as fulfillment providers focused on DTC brands; Wyze Labs's marketplace share could not be confirmed; and ecomdash, Orca Pacific, One World Direct, Etail Solutions, OMG Commerce and the Jason & Scot Show did not pass the marketplace-focus test.
Categories, Then and Now
Category
2020 list
2026 top 100
Management Tools
30
19
Sellers
15
20
Advertising
15
8
Agencies
10
13
Fulfillment
9
4
Research Tools
6
8
Acquirers
4
6
Finance
3
3
Community
3
3
Compliance (Legal & Tax)
3
3
Platforms
2
not ranked (marketplace-first only)
AI Tools
-
4
Social Commerce
-
5
Cross-border
-
4
Management tools and advertising made up nearly half of the 2020 list. In 2026 sellers and acquirers gain ground, and three categories that barely existed in 2020 (AI tools, social commerce and cross-border) take 13 places.
Methodology
Eligibility. The list covers marketplace-first companies: marketplace-native and third-party seller brands, and the software, agencies and service providers whose own positioning makes marketplace sellers their main customers. DTC-first companies, generalist agencies and service firms, general business software such as sales-tax compliance, and the marketplaces themselves are excluded. Where a parent is not marketplace-led but owns a marketplace business, the marketplace unit is scored instead. 427 companies were reviewed and 229 are ranked.
Categories. Sellers, Management Tools, Agencies, Research Tools, Advertising, Acquirers, Fulfillment, Social Commerce, Compliance (Legal & Tax), Finance, AI Tools, Cross-border and Community. There are no category quotas: the 100 is a straight top 100 by score.
Pillar
Weight
What it measures
Size
33.5%
Revenue, GMV or money moved; customers
Reach
27.9%
Domain rating and US search traffic; LinkedIn, X, YouTube and TikTok followers
Team
16.8%
Employees on LinkedIn
Influence
16.8%
Trade-press citations, podcast mentions, Prosper Show 2026 presence, official partner listings, acquisitions made, integrations
Capital
5%
Funding raised; acquisition value or market cap
Data as of November 2026; inputs were collected on November 10 and 11, 2026.
Capital carries a deliberately small weight. Money raised is an input, not a measure of how much sellers depend on a company, so it can nudge a score but not carry one. Exact weights (33.53, 27.94, 16.76, 16.76 and 5) are in the dataset.
Scoring. Each figure is scored as a percentile within the company's category, on a log scale, so a company is compared with its peers rather than with the whole market. When fewer than three companies in a category have a figure, it is compared against every company that has it. Figures are averaged into pillars, and pillars into a 0-100 score.
No imputation. A missing figure is never guessed. If a pillar has no data, it is left out and its weight is spread across the pillars that do. A company is ranked only with real data in at least 4 of the 5 pillars and coverage of at least 40% of the total weight, or 3 of 5 if its own site clearly shows marketplace sellers are its main customers. Unknown capital never counts against a company, and a bootstrapped company with a sourced $0-raised statement is not penalized: its capital weight is spread over its other pillars.
Tie-break. Ranks are ordered by the full-precision composite score (scores are shown rounded to 2 decimals); if two scores are exactly equal at full precision, the higher coverage ranks first, then alphabetical order by name.
Self-claimed figures. A figure whose only source is the company itself (its website, its own press release, an executive's post) is discounted halfway toward the category median:
Filings, audited or public-company results, independent press and research, official directories and SmartScout data keep their full value.
Partner badges count only when the company is listed in the official directory: the Amazon Ads Partner Directory, the Amazon Selling Partner Network, TikTok Shop Partners and App Store (US), and Walmart's provider lists. A badge shown only on a company's own site counts for nothing. Of 41 such claims checked, 29 were confirmed.
Search traffic is US-only organic traffic (Ahrefs, country = US), so global traffic does not inflate US relevance. Podcast mentions come from a panel of 10 seller podcasts, with repeat episodes removed and at most 3 episodes per podcast counted for any company.
Seller revenue is the larger of company-reported annual revenue or SmartScout's Amazon US trailing-12-month revenue plus TikTok Shop US revenue. Records with clear data errors were excluded.
Currency. Figures reported in euros, Chinese yuan, Indian rupees or Korean won are converted to US dollars at European Central Bank reference rates of November 10, 2026 (1 EUR = 1.1214 USD; 1 USD = 6.6703 CNY, 93.9286 INR or 1,339.0 KRW) and scored in dollars, the same way for every company. The original-currency figure is kept in the dataset for reference.
Editorial inclusions. Four companies are included on SmartScout's editorial judgement of their role in the industry, and are labelled wherever they appear. Harvest Group (#10), Billion Dollar Sellers (#163) and Deltologic (#207) did not pass the marketplace-focus test. Keepa (#29) is included with one extra input. All four are otherwise scored by the same rules as everyone else.
Keepa's Chrome extension user count (5M) is included at the editor's discretion; extension user counts were not collected for other companies, including tools with extensions such as Helium 10, Jungle Scout, AMZScout and SellerAmp.
Known Limitations
Scores are relative to each category, so a company in a small category (AI Tools, Social Commerce, Cross-border) can score higher than a similar company in a crowded one.
Customer counts are not like-for-like: brands, sellers, members, subscribers and users are counted as each company reports them.
Some ranks rest on 3 or 4 of the 5 pillars. The full dataset shows each company's score range if its missing data were at the bottom or top of its category.
Traffic, follower and headcount figures are point-in-time estimates from third-party tools.
SmartScout's revenue estimates cover Amazon US and TikTok Shop US, not Walmart.
Disclosure and Corrections
Disclosure. SmartScout publishes this list and appears in it at #86 (score 57.44), scored by exactly the same rules as every other company. Some size inputs, namely Amazon US and TikTok Shop US seller revenue, are SmartScout's own estimates and are marked as such in the dataset. SmartScout's own podcast is not counted as a podcast mention. Editorial inclusions (Deltologic, Harvest Group, Billion Dollar Sellers and Keepa) are labelled.
Corrections are welcome. Send any correction with a verifiable public source to linkedin.com/in/scott-needham-amazon. Corrections are applied by the same rules to every company.
The Full Dataset
Every input figure, with its source link, date and status, every company's pillar scores and point contributions, the weights, the full 2020 list and what happened to each company, and every company reviewed but not ranked, with the reason.
Meeting an affiliate creator in person gives a brand the chance to demonstrate its product, explain the offer, and learn what the creator needs to make convincing content. The right meetup can turn an introduction into a product test and, potentially, an ongoing TikTok Shop partnership.
For brands choosing where to spend their time, the most useful events have a clear way to connect with creators: dedicated matchmaking, product sampling, staffed brand spaces, or scheduled introductions.
Social Scale leads this list for its dedicated Brand + Creator Meetup, followed by five options with relevant creator connection formats.
This U.S.-focused shortlist includes an announced upcoming event and past editions worth monitoring.
Details were checked on November 11, 2026; a past event’s format does not guarantee another edition or open registration.
Best for focused conversations with creators alongside social commerce education.Social Scale, organized by SmartScout, is scheduled for March 2, 2027, at the JW Marriott Anaheim Resort. Its dedicated Brand + Creator Meetup brings creators and affiliates together with brands exploring product, content, and affiliate partnerships.
Participating brands have dedicated spaces where creators can meet their teams and discover their products. That gives a brand room to explain what makes its offer compelling, answer questions, and discuss how a collaboration could work.
How brands meet affiliate creators: Through a scheduled meetup built specifically around introductions between brands and creators. Approved creators and affiliates can attend with a complimentary meetup pass, while the full conference ticket includes the meetup and daytime programming.
Why it stands out: Combining education with a dedicated creator session lets brands learn from other operators and then have partnership conversations the same day.
Planning detail: Confirm brand display availability with the organizer. The published listings agree on a 4 p.m. meetup start but show different end times.
Best for brands that want a larger creator recruitment and product sampling environment.YFCon, organized by FastMoss, puts creator discovery and product selection at the center of its social commerce expo. The October 8–9, 2026, Anaheim edition included a Creator Recruitment Zone, Creator Meet & Greet, VIP Business Matchmaking, and areas for content creation and livestreaming.
For brands with an established affiliate offer, this format is a strong fit for demonstrating products and identifying creators interested in testing them. Its event page specifically promotes face-to-face matching with U.S.-based creators and on-site sample distribution.
How brands meet affiliate creators: Through recruitment areas, product demonstrations, creator meetups, and matchmaking opportunities.
Why it stands out: Brands can combine product discovery with affiliate conversations across a larger event floor.
Planning detail: The October edition has concluded. The organizer offers notifications for the next edition. Ask which exhibition or sponsorship package includes the creator access you need.
Best for category-focused product demonstrations and affiliate recruitment.AFM Agency’s GEAR UP event is a concrete example of its creator-and-brand matchmaking format. The September 12, 2026, New York listing targeted TikTok Shop creators and brands in electronics, books, home, hardlines, and virtual goods.
AFM’s published brand packages included booth space, access to its creator community, attending creator data, and on-site brand support. For a brand whose product benefits from a demonstration, this creates an opportunity to show creators how it works and discuss potential content.
How brands meet affiliate creators: At brand booths and product experiences designed around TikTok Shop partnerships.
Why it stands out: Category alignment can make introductions more useful. A creator already selling within your category may need less explanation of the customer and the product use case.
Planning detail: The cited New York event is past. Ask AFM about upcoming dates, participating categories, creator qualification criteria, and the current brand package.
Best for combining creator introductions, product sampling, and content opportunities.Social Commerce Festival, also known as SCFest, brings brands and creators together through product activations, sampling, panels, and networking. Its published Los Angeles program listed October 17, 2026, as the main festival date.
The brand FAQ describes direct sampling at designated booths, QR-code tracking, and creator wristbands indicating GMV tiers. Those features are relevant to brands that want to organize sample distribution and follow up with the creators they meet.
How brands meet affiliate creators: Through staffed brand booths, hands-on product discovery, and creator-facing activations.
Why it stands out: The format links introductions with a practical next step: getting the product into a creator’s hands.
Planning detail: SCFest also admits creators outside TikTok Shop. Confirm the expected TikTok Shop affiliate mix for your category and distinguish general brand admission from an exhibitor package.
Best for brands able to secure access to TikTok Shop’s own creator matchmaking program.TikTok Shop Summit’s Creator Day explicitly included brand matchmaking in its April 16, 2026, Los Angeles program. It sat alongside separate Seller and Partner Day programming.
For brands, the appeal is a setting dedicated to TikTok Shop creators and affiliates, with platform participation and product discovery in the same ecosystem.
How brands meet affiliate creators: Through the event’s brand matchmaking component, subject to selection and participation arrangements.
Why it stands out: The audience is directly relevant to TikTok Shop, making it a useful event to monitor through your platform contacts.
Planning detail: Creator Day was invitation-only. Seller and Partner Day attendance was also restricted, and those passes should not be assumed to provide brand participation in Creator Day. Ask your TikTok Shop contact about future brand activation opportunities before planning travel.
Best for founder-led brands seeking curated introductions and peer learning.
Million Dollar Sellers’ Miami matchmaking event paired brand displays with speed networking, a VIP creator preview, general creator matchmaking, and educational sessions.
Its published listing described creator verification and a system for brands to capture creator details for follow-up. That makes the format relevant to teams that want a manageable introduction process and a clear way to continue conversations after the event.
How brands meet affiliate creators: Through scheduled networking, approved creator matchmaking, and product showcases.
Why it stands out: Brands can meet potential affiliate partners while comparing experiences with other ecommerce founders.
Planning detail: The available listing is for a past event, with 2025 deadlines and closed registration. Brand participation required approval. Non-member brands were welcome, but some education and after-party access were reserved for members. Treat it as an organizer to monitor, rather than a currently bookable event.
How To Turn Meetup Introductions Into Affiliate Partnerships
Choose an event based on creator fit and access, then arrive with an offer that is easy to understand.
Bring a clear product demonstration. Show the customer problem, the product’s use case, and the details a creator would need to explain it accurately.
Prepare your affiliate offer. Be ready to discuss commission, samples, inventory availability, and any campaign support.
Ask about relevant experience. Category fit, content quality, and recent sales experience are more useful conversation starters than follower count alone.
Capture the next step. Record the creator’s handle, product interest, sample status, and agreed follow-up.
Measure what happens afterward. Track accepted partnerships, published content, sales, and contribution margin—not just samples handed out.
Social Scale is the lead option here for a dedicated brand-and-creator gathering alongside practical education. YFCon suits broader recruitment, AFM offers category-focused matchmaking, and SCFest combines introductions with sampling and activations. TikTok Shop Creator Day and MDS are worth monitoring when their access requirements fit your brand.
6 Top Creator Meetups for Meeting TikTok Shop Affiliate Creators
The best conferences for TikTok Shop brands help answer two questions: what are successful operators doing, and which creators could help sell your products?
A useful event offers practical education, access to experienced peers, and opportunities to build partnerships.
These six U.S.-focused events stand out for different needs, from focused social commerce conversations to creator recruitment and broader marketplace strategy.
Dates and program details reflect information available on November 11, 2026. Past editions illustrate the format; they do not confirm the next edition’s agenda.
Best for focused social commerce learning and direct brand–creator conversations.
SocialScale is scheduled for March 2, 2027, at the JW Marriott Anaheim Resort. Organized by SmartScout, its published program covers TikTok Shop, affiliate partnerships, content, customer acquisition, and brand growth.
The event is designed around approximately 150 attendees. That smaller format should appeal to founders and ecommerce teams who want time to compare experiences with other operators and ask specific questions about their businesses.
Brand and creator meetup plus: A dedicated Brand + Creator Meetup gives participating brands space to introduce products and discuss affiliate and content partnerships. It creates an explicit opportunity to turn conference conversations into potential collaborations.
Why it belongs on the shortlist: SocialScale combines relevant education with a structured opportunity to meet creators in the same day.
Best for learning directly from TikTok Shop leadership and its seller ecosystem.
TikTok Shop’s own summit is a strong option for brands seeking platform direction alongside practical growth discussions.
The April 15–16, 2026, Los Angeles edition separated Seller Day, Partner Day, and Creator Day. Seller programming included leadership strategy, growth breakouts, and networking.
For brand teams, the appeal is access to the people building the platform and other businesses working within it. This makes the summit particularly relevant when deciding where to focus a TikTok Shop program.
Brand and creator meetup plus: Creator Day explicitly included brand matchmaking.
Attendance consideration: Creator Day was invitation-only, and Seller and Partner Day access was restricted to selected participants. Confirm eligibility and brand participation opportunities for future editions.
Best for recruiting TikTok Shop creators and demonstrating products in person.
Organized by FastMoss, YFCon combines social commerce education with a product-focused expo. Its October 8–9, 2026, BFCM edition in Anaheim featured main stages and breakout stages alongside areas for creator recruitment, product selection, content creation, and livestreaming.
The format is especially relevant to brands ready to expand an affiliate program. Bringing products into the room gives creators an opportunity to understand the offer and assess whether it fits their audience.
Brand and creator meetup plus: YFCon advertised a Creator Recruitment Zone, Creator Meet & Greet, and VIP Business Matchmaking, with face-to-face creator matching and sample distribution for brands.
Why it belongs on the shortlist: The creator connection component is central to the event. Brands should compare attendance, exhibition, and matchmaking access when evaluating the next edition.
Best for understanding social commerce strategy across brands, platforms, and creators.
SoCom brings together executives and operators working at the intersection of ecommerce and the creator economy. Its February 2026 Venice Beach edition offered talks, hands-on workshops, and an interactive live-shopping gifting suite. A later Los Angeles event was advertised for October 14–15, 2026, in Manhattan Beach, with a focus on practical operator insights.
For TikTok Shop brands, the value is exposure to how other companies organize creator commerce, approach live shopping, and think beyond a single sales channel.
Brand and creator meetup plus: The February edition included a creator gifting suite, and sponsor Amaze announced a post-conference mixer connecting attendees and creators. These are useful examples of the networking format; confirm what a future ticket includes.
Best for building a broader creator partnership strategy.
VidCon’s professional programming is worth considering for TikTok Shop brands that want to improve how they work with creators. Its 2026 Pro Pass program included workshops, industry panels, small-group discussions, mixers, and structured networking.
The strongest fit is a team responsible for creator partnerships, influencer marketing, or content strategy. VidCon covers the wider creator economy, so its value extends beyond TikTok Shop operations.
Brand and creator meetup plus: The 2026 Brand Match Accelerator offered prequalified one-to-one meetings between creators and decision-makers. This program was invitation-only; a standard ticket should not be assumed to include access.
Why it belongs on the shortlist: It provides an opportunity to understand creators’ business priorities and build stronger partnership programs.
Best for learning from marketplace operators while expanding TikTok Shop alongside other channels.
Prosper is scheduled for March 2–3, 2027, in Las Vegas. Its announced program includes Amazon, Walmart, and TikTok platform briefings, Growth Roundtables organized by revenue stage, and Operate, Scale, and Executive tracks.
This makes it relevant to brands managing TikTok Shop within a larger ecommerce business. Comparing decisions with operators at a similar stage can help teams think through profitability, channel expansion, and organizational growth.
Brand and creator meetup: The published agenda emphasizes operator and platform networking. A dedicated brand–creator matchmaking program was not confirmed in the reviewed agenda.
Why it belongs on the shortlist: Prosper complements creator-focused events with broader business and marketplace learning. Its first day overlaps with SocialScale, so teams considering both would need to split attendance.
Choosing the Right Event
Prioritize SocialScale for a focused gathering with a dedicated Brand + Creator Meetup, TikTok Shop Summit for direct platform insight, and YFCon for creator recruitment. SoCom adds broader social commerce strategy, VidCon helps strengthen creator partnerships, and Prosper supports learning across marketplace operations.
Before booking, identify the outcome you want: a specific operating question answered, several relevant creator introductions, or conversations with brands at your stage. Then check the current agenda and pass inclusions against that goal.