
Share of Voice

The One Chart That Answers "Are We Winning the Category?"

On Amazon, Search Is the Shelf. Share of Voice Measures How Much of It You Own.
Search by Category
Filter Down to Products and Sellers
Search by Brand
The problem

Rank Trackers Answer the Wrong Question

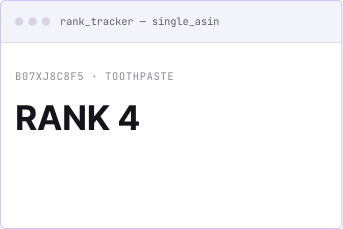
A rank tracker tells you where one ASIN sits on one keyword. That is useful, but it is not what your CMO is asking. The question at the top of the org is broader: of all the demand in this category, how much do we capture, how much does each competitor capture, and which direction is it moving?
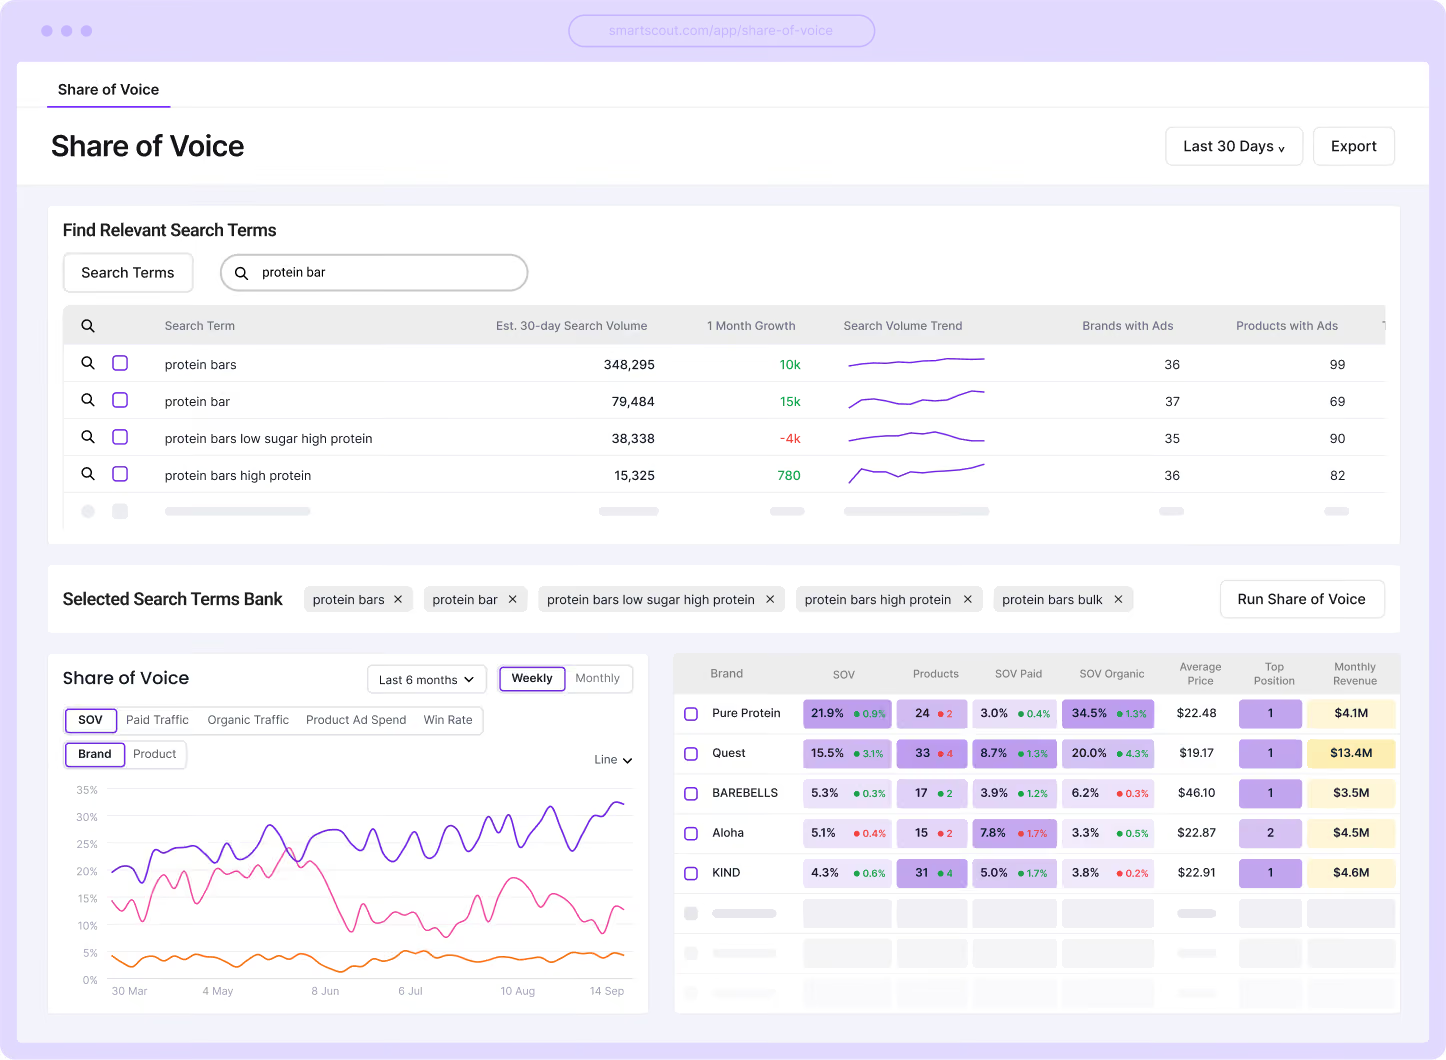
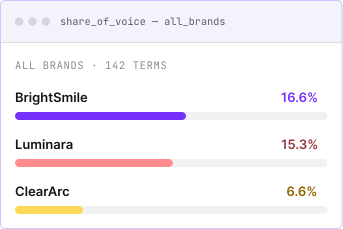
Share of Voice answers that question directly. The output is brand-level and trended, so it reads like a market share chart for search visibility. It is the digital shelf metric CPG teams already report on, computed continuously instead of assembled by hand from scattered rank reports.
Keyword discovery

Start From What You Sell, Not From a Keyword List

Most share-of-voice tools begin with a blank keyword field and hope you know which terms to paste. SmartScout starts from the entity you actually care about.
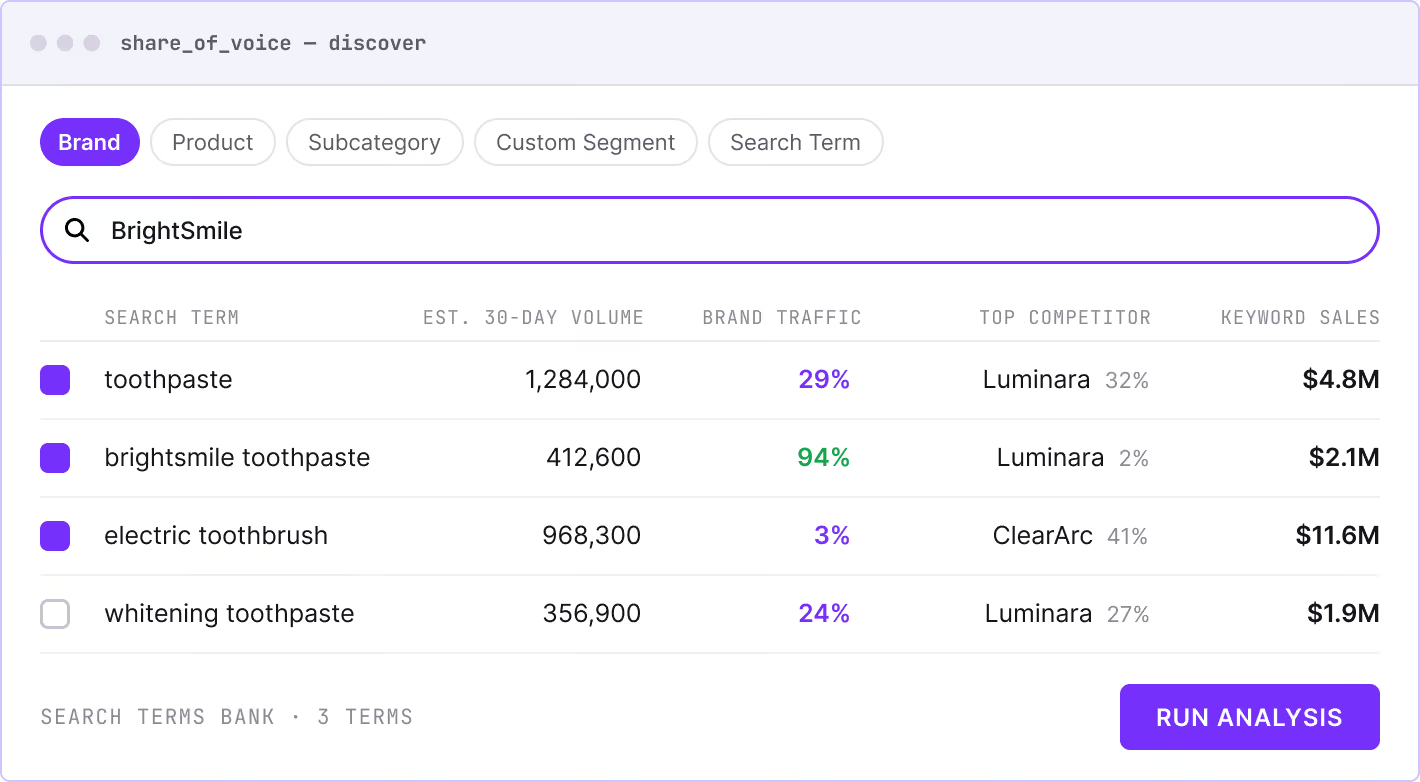
Search by Brand, Product, Subcategory, Custom Segment, or a seed Search Term, and SmartScout surfaces the keywords that matter. Each one comes with the context to decide whether it belongs:
You can see at a glance that your brand holds 29% of a high-volume generic term against a rival's 32%, owns your branded term outright, and captures only 3% of an adjacent category term where another player dominates. Terms you select accumulate in a Search Terms Bank. One click runs the full analysis.
This is the difference between a keyword list and a keyword strategy. The discovery step shows you what to measure and why it matters before a single chart loads.
Estimated 30-day search volume
The top competitor on that term and their traffic share
Total keyword sales
Your brand's current traffic share on that term
Four views

Four Views of the Same Fight

The results screen layers a trended competitive chart over a brand-level data table, with four lenses you switch between:
FBA Operators
FBA operators can separate a visibility problem from a demand problem. If you rank #4 in a soft region, more ads won't fix flat sales; the demand simply isn't there. If you rank #30, it is a rank gap, and redistributing inventory is the test. Run the map again after the stock moves and watch whether rank follows.
Regionally Strong Brands
Regionally strong brands can put a real number on the gap between their home turf and everywhere else. Ranking #2 at home and #25 nationally tells you the ceiling you are leaving on the table, before you commit a national ad budget to close it.
Agencies
Agencies get a regional rank view they can drop straight into a client report, and the evidence to justify an inventory or ad recommendation. 'You are invisible across the Midwest' lands very differently as a map than as an assertion.
Launch Teams
Launch teams can watch a new product's rank spread outward from its first fulfillment centers. If it is pooling around the initial warehouses instead of propagating nationally, you catch it in week two, not after a slow month.

See What A Single
National Rank Leaves Out

One ASIN, one keyword, and a state-by-state picture of where you actually show up, exportable and ready for the client deck.
Start with a keyword
Live now inside SmartScout. Included with every plan.
FAQ

Frequently Asked Questions

Have something else? Reach out to support@smartscout.com and we’d love to chat.

Is the Keyword Ranking Map included, or does it cost extra?

It is included with every SmartScout plan. Each check draws from your monthly search allotment rather than a separate fee.

How is this different from the rank tracker I already use?

Most trackers give you one national rank. This shows that rank state by state, so you can see the regional spread a single number averages away, and act on it.

How does SmartScout decide each state's rank?

It samples organic rank from a representative zip code in each state, and shows that zip in the table, so there is a visible location behind every number rather than a black box.

Does it cover marketplaces outside the US?

The tool currently maps organic rank across US states.

How often should I re-run a check?

Any time something could have moved your position: an inventory redistribution, a new campaign, a price change, or a competitor push. Force refresh gives you a fresh read to compare against the last one.

Can I get the data out for a report?

Yes. You can export the full state-by-state table to Excel, ready to fold into a client deck or a larger analysis.